


 |
市場調查報告書
商品編碼
2072729
創收型行銷服務市場:市場佔有率分析、產業趨勢與統計、成長預測(2026-2031)Revenue Marketing Services Market - Market Share Analysis, Industry Trends & Statistics, Growth Forecasts (2026 - 2031) |
||||||

※ 本網頁內容可能與最新版本有所差異。詳細情況請與我們聯繫。
根據 Mordor Intelligence 預測,營收行銷服務市場將從 2025 年的 311 億美元和 2026 年的 341.5 億美元成長到 2031 年的 548 億美元,2026 年至 2031 年的複合年成長率為 9.90%。
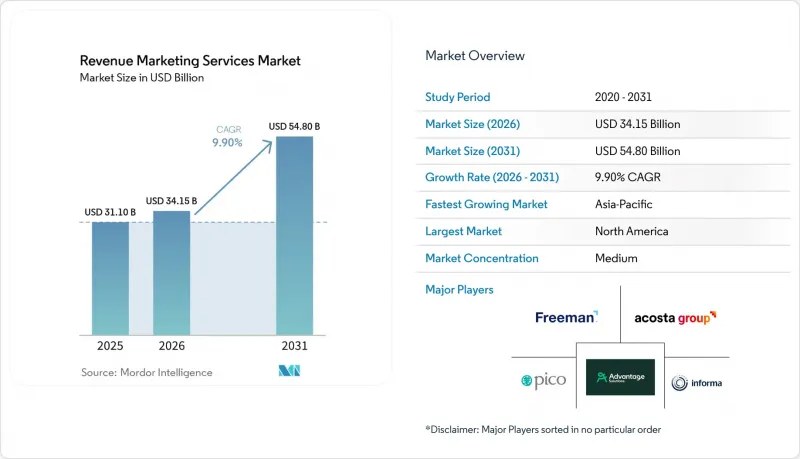
本報告按服務類型(策略/專案設計、現場實施/人員配備等)、終端用戶行業(零售/電子商務、消費品/美容等)、互動形式(離線專案、混合專案等)、宣傳活動目標(客戶獲取、潛在客戶開發等)和地區細分。市場預測以美元計價。
全球營收行銷服務市場趨勢與洞察
對可衡量、體驗式投資報酬率的需求日益成長
在收益行銷服務市場,對可衡量的活動和現場活動成果的需求日益成長。這是因為財務部門不再將現場活動視為不受收益審查的支出。活動團隊正在提升將參與者行為與客戶關係管理 (CRM) 和銷售管道報告關聯起來的能力,即使到了 2026 年,仍有 40% 的組織者表示難以證明投資回報率 (ROI),低於 2025 年的 70%。這項改善意義重大,因為它表明,不僅支出水平,調查方法本身也在改變買家對收益行銷服務市場的信心。中小品牌的預算審查也日趨嚴格,統一的報告和令人信服的歸因分析在合約續約中變得越來越重要。能夠證明活動參與度如何與銷售管道進度和客戶維繫的供應商,在收益行銷服務市場中正佔據更有利的地位。即使執行品質出色,那些仍然依賴孤立的活動儀表板和手動編制的匯總文件的供應商,也面臨更高的合約續約風險。
擴大全通路和線下通路的結合
如今,收益行銷服務市場不再僅限於線上和線下預算之間的簡單權衡,許多客戶現在同時投資線上和線下管道,並在同一專案中扮演不同的角色。線下活動越來越需要產生數位訊號,而數位管道則被用於擴展後續跟進、重定向和與線下活動相關的效果衡量。這正在改變收益行銷服務市場的營運模式,因為現場團隊現在需要在活動實施過程中支援QR碼兌換、獲取用戶許可和即時跟進。法國公共廣播公司 (France Pub) 的一份報告指出,儘管法國廣告市場將在 2025 年萎縮,但活動和體驗式行銷的表現將優於其他線下類別。這印證了這樣一種觀點:品牌並沒有放棄線下活動,而是將支出轉向更易於衡量的店內互動。因此,服務供應商需要培訓員工處理整合的線上線下工作流程,而不僅僅是管理傳統活動。這種轉變正在推動創收行銷服務市場的成長,在這個市場中,面對面的互動仍然至關重要,而客戶也需要數位專案的覆蓋範圍和數據分析能力。
預算審查及延長收入示範期
由於離線專案通常比數位媒體需要更長時間才能顯現最終的銷售和轉換結果,預算審查正成為營收行銷服務市場成長的主要障礙。行銷團隊面臨日益嚴格的內部審查,根據行銷長調查,到2026年,培訓預算將降至行銷支出的3.8%,員工成長速度也將逐年大幅放緩。這種環境導致營收行銷服務市場出現一系列趨勢,例如採購週期延長、試點實施要求增加以及專案期間績效評估增加。這個問題具有結構性,因為零售銷售業績、重購率和客戶關係管理(CRM)轉換率通常需要在專案完成後60到90天才能顯現。這個時間節點可能與目前的核准流程相衝突,後者要求更快地驗證結果並提供易於財務部門接受的文件。能夠將工作分解為里程碑並以易於財務團隊接受的格式報告進度的供應商,更有可能在營收行銷服務市場中獲得預算。
細分市場分析
2025年,現場執行與部署服務佔營收行銷服務市場佔有率的27.74%。這反映了其作為幾乎所有下游服務類別營運基礎的重要角色。產品展示、路演、店內促銷和銷售支援都依賴在每個地點持續部署訓練有素的人員,因此該服務仍然佔據核心地位。在營收行銷服務市場,這一主導地位也帶來了更多挑戰,例如不斷上漲的工資壓力、勞動力平台的轉型以及客戶要求提供數位檢驗的績效而非自我報告的活動日誌。 Advantage Solutions報告稱,2026年第一季活動數量成長近20%,執行率提升94%,這體現了集中式勞動力管理和大規模、持續的技術升級的價值。衡量與分析是成長最快的服務類型,2026年至2031年的複合年成長率(CAGR)為14.26%,顯示績效架構正日益成為採購決策的核心因素。
儘管「策略和方案設計」在營收行銷服務產業中仍屬於高價領域,但由於其通常作為執行服務的一部分而非獨立產品採購,因此其市場規模相對較低。 「零售商品商品行銷和店內促銷」繼續受益於零售商和品牌商之間的責任分擔協議,這些協議要求更嚴格的貨架陳列合規性和更完善的門市層面報告。活動和路演管理、潛在客戶開發和銷售支援以及產品演示和樣品派發仍然是營收行銷服務市場中頗具吸引力的領域,但這些領域正變得日益分散,將執行與效果評估相結合的能力變得越來越重要。因此,能夠將人事費用、工作流程系統、分析和客戶報告打包在一起的供應商,比那些只提供執行服務的供應商更具價格競爭力。
在2025年的收入行銷服務市場規模預測中,零售和電子商務將佔據30.16%的佔有率,這反映出在貨架可見性、銷售點轉換率和貿易夥伴支援方面持續存在的競爭。這一領先地位與零售業的激烈競爭密切相關,品牌仍需要在門市和現場部署人才,以影響產品組合、合規性和消費者決策。消費品和美妝產業的重要性緊隨其後,因為在這些對試用高度敏感的品類中,試用裝和演示仍然是新產品上市支援和重複購買策略的核心。 IT、電信和銀行、金融和保險(BFSI)產業正在以不同的方式利用收入行銷服務市場,更加重視B2B活動、路演、潛在客戶開發和銷售通路拓展。醫療保健和生命科學是成長最快的終端用戶類別,預計從 2026 年到 2031 年將實現 15.44% 的複合年成長率。這表明,在多年接觸醫療保健專業人員的機會有限之後,合規的全通路互動正迅速成為優先事項。
Real Chemistry 預測,2025 年營收將達到 5.6 億美元,較 2024 年成長 14%。該公司還指出,隨著人工智慧服務的推出和精準媒體服務的拓展,這一成長動能將在 2026 年進一步加速。這個案例意義重大,因為高度專業化的醫療保健機構能夠應對普通公司往往難以駕馭的收入行銷服務市場中複雜的監管環境。 HIPAA、GxP 標準以及特定類別的行銷規則雖然增加了合規負擔,但也設定了准入門檻,從而為收入行銷服務行業中能力卓越的公司提供了更高的利潤率。儘管媒體娛樂、教育、旅遊酒店、工業和汽車行業都在積極利用收入行銷服務,但不同行業的實施計劃、衡量框架和客戶優先事項卻不盡相同。
區域分析
到2025年,北美將佔據全球營收行銷服務市場46.30%的佔有率,並持續維持其領先地位。美國佔據了該地區的大部分需求,這得益於其成熟的外包現場行銷體系、零售商與品牌之間深度合作投資模式以及活躍的B2B活動。加拿大也呈現類似的市場需求模式,但規模小規模。同時,隨著有組織零售業的擴張以及跨國消費品品牌加大對現場執行的投資,墨西哥市場也持續發展。北美也是營收行銷服務市場預算管理最嚴格的地區,行銷團隊在人員和支出方面都受到更嚴格的控制。此外,該地區對隱私合規的重視程度也不斷提高,這增加了即時專案資料處理的成本和複雜性。
歐洲仍是創收型行銷服務市場第二大區域板塊,這得益於德國和英國成熟的B2B活動基礎設施,以及法國和義大利日常消費品(FMCG)和美妝品牌對體驗式行銷的強勁需求。該地區還擁有廣泛的全通路活化需求,人們越來越期望店內互動能夠超越單純的品牌曝光,並產生可衡量的客戶訊號。法國公共廣播公司(France Pub)的一份報告指出,儘管法國廣告市場預計在2025年將出現萎縮,但活動和體驗式行銷預計將超越其他傳播類別,這為將預算重新分配到可衡量的店內互動提供了依據。由於GDPR及相關的國家隱私法規,歐洲仍然是資料收集方面合規要求最嚴格的地區,這增加了營運成本,但也有利於擁有健全管治結構的供應商。
亞太地區是創收型行銷服務市場成長最快的地區,預計2026年至2031年複合年成長率將達到14.18%。中國、印度、日本、韓國和澳洲各自採用不同的活化模式,這意味著服務提供者不能將該地區視為單一的商業環境。在印度,受有組織零售和醫療保健相關領域需求擴張的推動,服務需求成長速度高於區域平均。同時,在日本,隨著品牌競相在成長放緩的品類中吸引關注,對高階店內體驗的系統性投資正在增加。澳洲隱私監管局(OAIC)已啟動一項2026年全面合規性調查,重點關注組織如何管理個人數據,這與面對面收集消費者資訊的現場專案和抽樣專案直接相關。南美洲的巴西、墨西哥(擁有緊密貿易的品牌網路)、智利和哥倫比亞均呈現強勁成長。中東地區則受惠於B2B活動基礎設施的建設和對體驗式零售的投資。同時,非洲仍然是最小的區域叢集,但南非、埃及和奈及利亞在日常消費品(FMCG) 樣品發放、電信現場銷售和金融服務潛在客戶開發發揮主導作用。
其他好處:
- Excel格式的市場預測(ME)表
- 3個月的分析師支持
目錄
第1章:引言
- 研究假設和市場定義
- 調查範圍
第2章:調查方法
第3章執行摘要
第4章 市場狀況
- 市場概覽
- 市場促進因素
- 對可衡量、體驗式投資報酬率的需求日益成長
- 擴大全通路和線下通路的結合
- 擴大產品展示和樣品的使用範圍,以提高轉換率。
- 零售商要求店內執行方面必須高度課責。
- 透過即時活化收集第一方和零方數據
- 將ABM和現場行銷整合到B2B收入團隊中
- 市場限制因素
- 預算審查及延長收入示範期
- 訓練有素的現場和活動人員短缺
- CRM和事件技術的片段化正在削弱閉合迴路歸因。
- 巡迴推廣和樣品派發活動中許可、隱私和品類合規性的複雜性。
- 宏觀經濟因素對市場的影響
- 產業價值鏈分析
- 監理情勢
- 技術展望
- 波特五力分析
第5章 市場規模與成長預測
- 按服務類型
- 戰略和方案設計
- 現場工作及臨時人員配備
- 零售商品行銷及店內促銷
- 產品展示和樣品提供
- 活動及巡迴演出管理
- 潛在客戶開發與銷售支持
- 測量與分析
- 其他服務類型
- 按最終用戶行業分類
- 零售與電子商務
- 消費品/美容
- 媒體與娛樂
- 資訊科技/通訊
- BFSI
- 醫療保健和生命科學
- 其他終端使用者產業(教育、旅遊旅館、工業、汽車)
- 按參與類型分類
- 線下課程
- 混合課程
- 基於數位技術的實地考察項目
- 宣傳活動目標
- 客戶獲取
- 潛在客戶開發
- 銷售轉換率
- 產品試用和抽樣
- 品牌認知與參與度
- 為通路和零售合作夥伴提供支持
- 其他宣傳活動目標
- 按地區
- 北美洲
- 美國
- 加拿大
- 墨西哥
- 南美洲
- 巴西
- 阿根廷
- 智利
- 其他南美國家
- 歐洲
- 德國
- 英國
- 法國
- 義大利
- 西班牙
- 其他歐洲國家
- 亞太地區
- 中國
- 日本
- 印度
- 韓國
- 澳洲
- 其他亞太國家
- 中東
- 阿拉伯聯合大公國
- 沙烏地阿拉伯
- 卡達
- 其他中東國家
- 非洲
- 南非
- 埃及
- 奈及利亞
- 其他非洲國家
- 北美洲
第6章 競爭情勢
- 市場集中度
- 策略趨勢
- 市佔率分析
- 公司簡介
- Advantage Solutions Inc.
- Acosta Group
- The Freeman Company
- Informa PLC
- Pico Far East Holdings Limited
- Omnicom Group Inc.
- George P. Johnson Company
- Publicis Groupe SA
- dentsu Group Inc.
- WPP plc
- Stagwell Inc.
- BCD Meetings and Events
- INVNT Group
- Clarion Events Limited
- DMG EVENTS(UK)LIMITED
- Jack Morton Worldwide, Inc.
- The George P. Johnson Company
- Momentum Worldwide
- Elevate Global Limited
- Cvent Holding Corp.
第7章 市場機會與未來展望
According to Mordor Intelligence, the revenue marketing services market size is projected to expand from USD 31.1 billion in 2025 and USD 34.15 billion in 2026 to USD 54.8 billion by 2031, registering a CAGR of 9.90% between 2026 to 2031.
This report is Segmented by Service Type (Strategy and Program Design, Field Execution and Staffing, and More), End-User Industry (Retail and E-Commerce, Consumer Goods and Beauty, and More), Engagement Mode (In-Person Programs, Hybrid Programs, and More), Campaign Objective (Customer Acquisition, Lead Generation, and More), and Geography. The Market Forecasts are Provided in Terms of Value (USD).
Global Revenue Marketing Services Market Trends and Insights
Rising Demand for Measurable Experiential ROI
The revenue marketing services market is seeing stronger demand for measurable event and field outcomes because finance teams no longer treat live activation as spend that sits outside revenue scrutiny. Event teams have become better at linking attendance behavior to CRM and pipeline reporting, and 40% of organizers still reported difficulty proving ROI in 2026, down from 70% in 2025. That improvement matters because it shows that methodology, not just spend levels, is changing buyer confidence in the revenue marketing services market. Smaller and mid-sized brands are also under tighter budget review, which makes unified reporting and defensible attribution more important when contracts come up for renewal. Providers that can show how event engagement connects to pipeline movement or retention are moving into a stronger position in the revenue marketing services market. Providers that still rely on isolated event dashboards or manual recap files are facing higher renewal risk even when execution quality remains solid.
Expansion of Omnichannel and Face-to-Face Channel Mix
The revenue marketing services market is no longer shaped by a simple tradeoff between digital and physical budgets, because many clients now fund both at the same time for different roles in the same program. Physical activations are increasingly expected to generate digital signals, while digital channels are being used to extend follow-up, retargeting, and measurement around live programs. This is changing the operating model of the revenue marketing services market, because field teams are now expected to support QR redemption, consent capture, and real-time follow-up tasks during the activation itself. France Pub reported that the French advertising market contracted in 2025, yet events and experiential outperformed other offline categories, which supports the view that brands are moving spend toward more measurable physical engagement rather than abandoning it. As a result, service providers are being asked to train staff for blended physical and digital workflows instead of traditional event-only execution. This shift is helping the revenue marketing services market grow in areas where face-to-face contact remains essential but where clients still want the reach and data discipline of digital programs.
Budget Scrutiny and Longer Revenue Proof Windows
Budget review is becoming a larger brake on the revenue marketing services market because physical programs often need more time than digital media to show final sales or conversion results. Marketing teams are operating under tighter internal review, and the CMO Survey reported that training budgets fell to 3.8% of marketing spend while headcount growth slowed sharply year over year in 2026. That environment is leading to slower procurement cycles, more pilot requirements, and more mid-program performance reviews across the revenue marketing services market. The problem is structural, because retail sell-through, repeat purchase, and CRM conversion often need 60-90 days to become visible after a live program ends. That timing can clash with approval cycles that now demand faster proof and more finance-ready documentation. Providers that can break work into milestones and report progress in a format that finance teams accept are better placed to defend budgets in the revenue marketing services market.
Other drivers and restraints analyzed in the detailed report include:
- Growing Use of Product Demonstration and Sampling to Lift Conversion
- First-Party and Zero-Party Data Capture Through Live Activations
- Shortage of Trained Field and Event Labor
For complete list of drivers and restraints, kindly check the Table Of Contents.
Segment Analysis
Field Execution and Staffing held 27.74% of the revenue marketing services market share in 2025, which reflects its role as the operating base for almost every downstream service category. The segment remains central because product demos, roadshows, in-store activations, and sales support all depend on trained personnel being deployed consistently across locations. In the revenue marketing services market, that leadership also comes with higher exposure to wage pressure, labor platform disruption, and client expectations for digitally verified proof rather than self-reported activity logs. Advantage Solutions reported events growth of nearly 20% in the first quarter of 2026 and an improved execution rate of 94%, which points to the value of centralized labor management and ongoing technology upgrades at scale. Measurement and Analytics is the fastest-growing service type at a 14.26% CAGR from 2026 to 2031, which shows that proof architecture is moving closer to the center of buying criteria.
Strategy and Program Design still command premium pricing in the revenue marketing services industry, but it remains lower in volume because it is usually purchased with execution rather than on a standalone basis. Retail Merchandising and In-Store Activation continues to benefit from retailer-brand accountability agreements that require tighter compliance at the shelf and stronger store-level reporting. Event and Roadshow Management, Lead Generation and Sales Support, and Product Demonstration and Sampling remain attractive parts of the revenue marketing services market, but these areas are fragmented and increasingly judged on their ability to connect execution with measurement. That is why providers that can bundle labor, workflow systems, analytics, and client reporting are gaining a more durable pricing edge than vendors that sell execution only.
Within the revenue marketing services market size in 2025, Retail and E-commerce accounted for a 30.16% share, which reflects the continued fight for shelf visibility, point-of-sale conversion, and trade partner support. This lead is tied to intense retail competition, where brands still need people in stores and on the ground to influence assortment, compliance, and shopper decision-making. Consumer Goods and Beauty followed closely in importance, because sampling and demonstration remain central to launch support and repeat purchase strategies in categories with high trial sensitivity. IT, Telecom, and BFSI use the revenue marketing services market in a different way, with more emphasis on B2B events, roadshows, lead generation, and pipeline progression. Healthcare and Life Sciences is the fastest-growing end-user category at a 15.44% CAGR from 2026 to 2031, which shows how quickly compliant omnichannel engagement is becoming a priority after years of reduced access to healthcare professionals.
Real Chemistry reported USD 560 million in 2025 revenue and 14% growth over 2024, and it said momentum is expected to strengthen in 2026 through AI-enabled delivery and expanded precision media services. That example matters because specialist healthcare providers can absorb regulatory complexity that generalist firms often struggle to manage in the revenue marketing services market. HIPAA, GxP standards, and category-specific marketing rules raise the compliance burden, but they also create a barrier to entry that can support stronger margins for capable firms in the revenue marketing services industry. Media and Entertainment, Education, Travel and Hospitality, Industrial, and Automotive also remain active users of revenue marketing services, though their activation calendars, measurement frameworks, and buyer priorities differ by category.
Complete Report Scope:
- By Service Type
- Strategy and Program Design
- Field Execution and Staffing
- Retail Merchandising and In-Store Activation
- Product Demonstration and Sampling
- Event and Roadshow Management
- Lead Generation and Sales Support
- Measurement and Analytics
- Other Service Types
- By End-user Industry
- Retail and E-commerce
- Consumer Goods and Beauty
- Media and Entertainment
- IT and Telecom
- BFSI
- Healthcare and Life Sciences
- Other End-user Industries (Education, Travel and Hospitality, Industrial, Automotive)
- By Engagement Mode
- In-Person Programs
- Hybrid Programs
- Digitally Amplified Field Programs
- By Campaign Objective
- Customer Acquisition
- Lead Generation
- Sales Conversion
- Product Trial and Sampling
- Brand Awareness and Engagement
- Channel and Retail Partner Support
- Other Campaign Objectives
- By Geography
- North America
- United States
- Canada
- Mexico
- South America
- Brazil
- Argentina
- Chile
- Rest of South America
- Europe
- Germany
- United Kingdom
- France
- Italy
- Spain
- Rest of Europe
- Asia-Pacific
- China
- Japan
- India
- South Korea
- Australia
- Rest of Asia-Pacific
- Middle East
- United Arab Emirates
- Saudi Arabia
- Qatar
- Rest of Middle East
- Africa
- South Africa
- Egypt
- Nigeria
- Rest of Africa
- North America
Geography Analysis
North America commanded 46.30% of the revenue marketing services market share in 2025, which keeps the region in the leading position globally. The United States accounts for the largest part of regional demand, supported by a mature outsourced field marketing structure, deep retail-brand co-investment models, and heavy B2B event activity. Canada adds similar demand patterns at a smaller scale, while Mexico continues to develop as organized retail expands and multinational consumer brands increase field execution investment. In the revenue marketing services market, North America is also where budget scrutiny is most visible, because marketing teams are operating under tighter headcount and spend controls. Privacy compliance is also becoming more material in the region, which is raising the cost and complexity of data handling for live programs.
Europe remained the second-largest regional block in the revenue marketing services market, supported by established B2B event infrastructure in Germany and the United Kingdom and strong experiential demand from FMCG and beauty brands in France and Italy. The region also benefits from a broad base of omnichannel activation demand, where physical engagement is increasingly expected to generate measurable customer signals rather than brand exposure alone. France Pub reported that the French advertising market declined in 2025, yet events and experiential performed better than other communication categories, which supports the case for budget redistribution toward measurable physical engagement. GDPR and related national privacy rules continue to make Europe the most compliance-intensive region for data capture at activations, which raises operating overhead but also favors providers with stronger governance processes.
Asia-Pacific is the fastest-growing region in the revenue marketing services market, with a 14.18% CAGR from 2026 to 2031. China, India, Japan, South Korea, and Australia each represent different activation models, which means providers cannot treat the region as a single operating environment. India's organized retail expansion and healthcare-related field demand are lifting service needs faster than the regional average, while Japan is seeing more structured investment in premium in-store experience as brands compete for attention in slower-growth categories. Australia's privacy regulator launched a 2026 compliance sweep that focused on how organizations manage personal data, which is directly relevant for field and sampling programs that gather consumer information in person OAIC. South America is seeing stronger growth in Brazil, Mexico's neighboring trade-linked brand networks, Chile, and Colombia, the Middle East is gaining from B2B event infrastructure and experiential retail investment, and Africa remains the smallest regional cluster, led by South Africa, Egypt, and Nigeria for FMCG sampling, telecom field sales, and financial services lead generation.
- Advantage Solutions Inc.
- Acosta Group
- The Freeman Company
- Informa PLC
- Pico Far East Holdings Limited
- Omnicom Group Inc.
- George P. Johnson Company
- Publicis Groupe S.A.
- dentsu Group Inc.
- WPP plc
- Stagwell Inc.
- BCD Meetings and Events
- INVNT Group
- Clarion Events Limited
- DMG EVENTS (UK) LIMITED
- Jack Morton Worldwide, Inc.
- The George P. Johnson Company
- Momentum Worldwide
- Elevate Global Limited
- Cvent Holding Corp.
Additional Benefits:
- The market estimate (ME) sheet in Excel format
- 3 months of analyst support
TABLE OF CONTENTS
1 INTRODUCTION
- 1.1 Study Assumptions and Market Definition
- 1.2 Scope of the Study
2 RESEARCH METHODOLOGY
3 EXECUTIVE SUMMARY
4 MARKET LANDSCAPE
- 4.1 Market Overview
- 4.2 Market Drivers
- 4.2.1 Rising Demand for Measurable Experiential ROI
- 4.2.2 Expansion of Omnichannel and Face-to-Face Channel Mix
- 4.2.3 Growing Use of Product Demonstration and Sampling to Lift Conversion
- 4.2.4 Retailer Demand for High-Accountability In-Store Execution
- 4.2.5 First-Party and Zero-Party Data Capture Through Live Activations
- 4.2.6 ABM and Field Marketing Convergence in B2B Revenue Teams
- 4.3 Market Restraints
- 4.3.1 Budget Scrutiny and Longer Revenue Proof Windows
- 4.3.2 Shortage of Trained Field and Event Labor
- 4.3.3 CRM and Event-Tech Fragmentation Weakening Closed-Loop Attribution
- 4.3.4 Permit, Privacy, and Category Compliance Complexity in Roadshows and Sampling
- 4.4 Impact of Macroeconomic Factors on the Market
- 4.5 Industry Value Chain Analysis
- 4.6 Regulatory Landscape
- 4.7 Technological Outlook
- 4.8 Porter's Five Forces Analysis
- 4.8.1 Threat of New Entrants
- 4.8.2 Bargaining Power of Buyers
- 4.8.3 Bargaining Power of Suppliers
- 4.8.4 Threat of Substitutes
- 4.8.5 Competitive Rivalry
5 MARKET SIZE AND GROWTH FORECASTS (VALUE)
- 5.1 By Service Type
- 5.1.1 Strategy and Program Design
- 5.1.2 Field Execution and Staffing
- 5.1.3 Retail Merchandising and In-Store Activation
- 5.1.4 Product Demonstration and Sampling
- 5.1.5 Event and Roadshow Management
- 5.1.6 Lead Generation and Sales Support
- 5.1.7 Measurement and Analytics
- 5.1.8 Other Service Types
- 5.2 By End-user Industry
- 5.2.1 Retail and E-commerce
- 5.2.2 Consumer Goods and Beauty
- 5.2.3 Media and Entertainment
- 5.2.4 IT and Telecom
- 5.2.5 BFSI
- 5.2.6 Healthcare and Life Sciences
- 5.2.7 Other End-user Industries (Education, Travel and Hospitality, Industrial, Automotive)
- 5.3 By Engagement Mode
- 5.3.1 In-Person Programs
- 5.3.2 Hybrid Programs
- 5.3.3 Digitally Amplified Field Programs
- 5.4 By Campaign Objective
- 5.4.1 Customer Acquisition
- 5.4.2 Lead Generation
- 5.4.3 Sales Conversion
- 5.4.4 Product Trial and Sampling
- 5.4.5 Brand Awareness and Engagement
- 5.4.6 Channel and Retail Partner Support
- 5.4.7 Other Campaign Objectives
- 5.5 By Geography
- 5.5.1 North America
- 5.5.1.1 United States
- 5.5.1.2 Canada
- 5.5.1.3 Mexico
- 5.5.2 South America
- 5.5.2.1 Brazil
- 5.5.2.2 Argentina
- 5.5.2.3 Chile
- 5.5.2.4 Rest of South America
- 5.5.3 Europe
- 5.5.3.1 Germany
- 5.5.3.2 United Kingdom
- 5.5.3.3 France
- 5.5.3.4 Italy
- 5.5.3.5 Spain
- 5.5.3.6 Rest of Europe
- 5.5.4 Asia-Pacific
- 5.5.4.1 China
- 5.5.4.2 Japan
- 5.5.4.3 India
- 5.5.4.4 South Korea
- 5.5.4.5 Australia
- 5.5.4.6 Rest of Asia-Pacific
- 5.5.5 Middle East
- 5.5.5.1 United Arab Emirates
- 5.5.5.2 Saudi Arabia
- 5.5.5.3 Qatar
- 5.5.5.4 Rest of Middle East
- 5.5.6 Africa
- 5.5.6.1 South Africa
- 5.5.6.2 Egypt
- 5.5.6.3 Nigeria
- 5.5.6.4 Rest of Africa
- 5.5.1 North America
6 COMPETITIVE LANDSCAPE
- 6.1 Market Concentration
- 6.2 Strategic Moves
- 6.3 Market Share Analysis
- 6.4 Company Profiles (includes Global Level Overview, Market Level Overview, Core Segments, Financials as available, Strategic Information, Market Rank/Share, Products and Services, Recent Developments)
- 6.4.1 Advantage Solutions Inc.
- 6.4.2 Acosta Group
- 6.4.3 The Freeman Company
- 6.4.4 Informa PLC
- 6.4.5 Pico Far East Holdings Limited
- 6.4.6 Omnicom Group Inc.
- 6.4.7 George P. Johnson Company
- 6.4.8 Publicis Groupe S.A.
- 6.4.9 dentsu Group Inc.
- 6.4.10 WPP plc
- 6.4.11 Stagwell Inc.
- 6.4.12 BCD Meetings and Events
- 6.4.13 INVNT Group
- 6.4.14 Clarion Events Limited
- 6.4.15 DMG EVENTS (UK) LIMITED
- 6.4.16 Jack Morton Worldwide, Inc.
- 6.4.17 The George P. Johnson Company
- 6.4.18 Momentum Worldwide
- 6.4.19 Elevate Global Limited
- 6.4.20 Cvent Holding Corp.
7 MARKET OPPORTUNITIES AND FUTURE OUTLOOK
- 7.1 White-space and Unmet-Need Assessment

 遊戲網紅行銷服務:市場佔有率分析、產業趨勢與統計、成長預測(2026-2031)思想領袖行銷服務:市場佔有率分析、產業趨勢與統計、成長預測(2026-2031 年)整合行銷服務:市場佔有率分析、產業趨勢與統計、成長預測(2026-2031)
 內容行銷市場:依內容類型、格式、通路、買家類型和產業分類-2026-2032年全球市場預測內容行銷軟體市場:按解決方案類型、應用、產業、部署模式和組織規模分類 - 全球預測(2026-2032 年)
 2026年全球內容行銷軟體市場報告2026年全球人工智慧內容行銷市場報告
 內容市場規模、佔有率和成長分析(按內容類型、內容格式、主要讀者、分發管道、最終用戶和地區分類)-2026-2033年產業預測
 內容行銷市場分析及預測(至2035年):按類型、產品類型、服務、技術、應用、部署類型、最終用戶、解決方案和模式分類內容行銷推廣服務市場:按服務類型、內容類型、組織規模和最終用戶分類 - 2026-2032 年全球預測