

 |
市場調查報告書
商品編碼
2066402
生物促效劑:市場佔有率分析、產業趨勢與統計、成長預測(2026-2031)Biostimulants - Market Share Analysis, Industry Trends & Statistics, Growth Forecasts (2026 - 2031) |
||||||
※ 本網頁內容可能與最新版本有所差異。詳細情況請與我們聯繫。
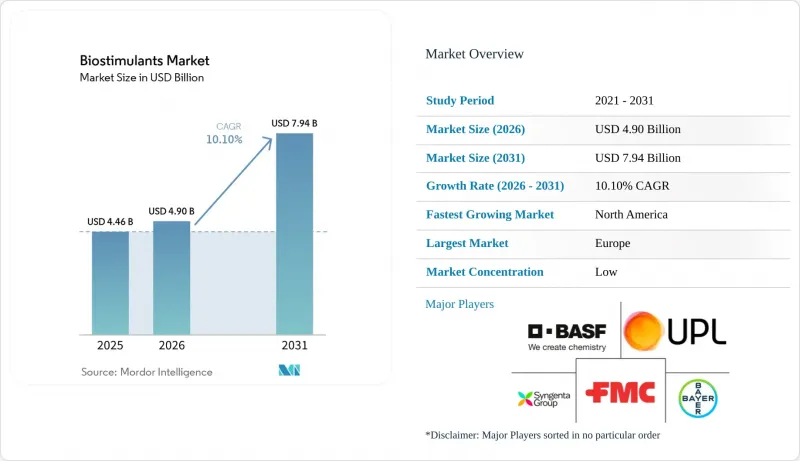
根據 Mordor Intelligence 預測,生物促效劑市場將從 2025 年的 44.6 億美元成長到 2026 年的 49 億美元,到 2031 年達到 79.4 億美元,2026 年至 2031 年的複合年成長率為 10.1%。
本報告按產品形態(胺基酸、富裡酸、腐植酸、蛋白質水解物、海藻萃取物等)、作物類型(經濟作物、園藝作物、大田作物)和地區(北美、南美、歐洲、亞太、中東和非洲)進行細分。市場預測以價值(美元)和數量(公噸)表示。
全球生物促效劑市場趨勢與洞察
永續農業材料的引入
永續作物投入品的採用仍然是生物促效劑需求的主要驅動力,因為它符合當前的農業經濟和農業化學品需求。新冠疫情後化肥價格的波動促使生產者重新評估投入決策。許多農場現在使用生物促效劑並非為了取代傳統的化學肥料方案,而是為了提高養分利用效率。這種轉變意義重大,因為它將生物促效劑納入了主要的作物投入預算,通常會導致在最初的試用週期後繼續使用。西班牙科爾多瓦大學的研究人員在2025年進行的一項研究表明,在半乾旱條件下,氨基酸類生物促效劑與緩釋尿素的聯合使用,與未處理的對照組相比,可使穀物蛋白質含量提高高達4.2%。
有機農業面積和價值鏈對殘留物敏感
有機農業面積和對農藥殘留敏感的價值鏈正在將生物促效劑市場的基本客群擴展到傳統作物系統之外。零售商的採購要求進一步推動了需求,零殘留採購標準的日益普及,促使生產者即使在沒有正式監管義務的情況下也擴大採用生物解決方案。根據美國農業部經濟研究服務中心預測,到2024年,有機食品銷售額將達到654億美元,顯示下游市場需求強勁。這對生物促效劑市場具有重大意義,因為其應用不再局限於小規模有機種植領域。來自食品和出口市場的類似需求,也日益促使大田作物種植者和高價值園藝產品生產商做出回應。
全球範圍內標籤的定義和規定各不相同
法律定義的差異持續限制歐洲以外許多地區的生物促效劑市場。在非洲、東南亞和一些南亞國家,這些產品都受與農藥類似的法規監管。因此,數據要求不斷擴大,註冊時間不斷延長,給許多供應商帶來了挑戰。據歐洲生物促效劑產業委員會 (EBIC) 稱,現行的合規法規,包括正面表列限制和化學品安全要求,構成了重大挑戰,尤其對那些致力於將新型微生物解決方案商業化的中小型企業而言更是如此。這個問題與功效聲明的執法風險密切相關,因為儘管供應商在產品研發方面投入了大量資金,但他們仍可能面臨不同司法管轄區不同的功效聲明標準和產品分類。在建立更廣泛的國際框架之前,預計生物促效劑市場將繼續不均衡成長,監管差異對市場競爭的影響幾乎與對農業生產績效的影響相當。
細分市場分析
預計到2025年,胺基酸仍將維持其最大的市場佔有率,佔銷售額的30.7%。這一主導地位歸功於其與各種作物類別的施肥和灌溉系統、養分效率提升方案以及逆境管理應用的廣泛兼容性。胺基酸製劑廣泛應用於穀物、蔬菜和園藝作物,因為它們可以無縫整合到現有的施肥計劃和作物保護程序中。在商業化農業系統中,種植者優先考慮易用性和作物品質的顯著提升,因此該領域受益於強勁的重複購買行為。此外,穩定的保存期限、易於操作以及與生物投入方案日益融合等優勢,也持續推動全球大規模農業生產區對胺基酸製劑的採用。
腐植酸預計將呈現最高的成長率,2026年至2031年的複合年成長率將達到12.6%。這一成長主要受商業農業日益關注的土壤劣化、養分利用效率以及乾旱導致的作物脅迫等問題所驅動。由於腐植酸製劑能夠提高養分利用效率並在各種田間條件下支持根際活性,因此在玉米、大豆和穀物種植中得到越來越廣泛的應用。富裡酸產品也因其與植物的快速相互作用和螯合特性而備受關注,而海藻萃取物在壓力管理應用中仍發揮著重要作用。產品創新越來越專注於將多功能生物來源混合物整合到主流農業生產系統的肥料和種子處理方案中。
區域分析
預計到2025年,歐洲將佔據最大的市場佔有率,達到38.3%。這一主導地位主要歸功於歐盟的法規,這些法規為植物生物促效劑建立了正式的法律體制,促進了產品標準化和跨境商業化。有機農業在歐洲日益普及,以及對永續農業材料的監管支持力度加大,也是促成這一趨勢的因素。西班牙、法國、德國和義大利等國持續推動市場需求,優先考慮穀物、園藝、橄欖和葡萄酒產業的殘留物控制和出口品質標準。完善的農業諮詢網路和人們對生物來源材料日益成長的認知,進一步推動了生物基材料在全部區域和高價值農業生產系統中的商業性化應用。
預計2026年至2031年間,北美市場將以12.7%的複合年成長率(CAGR)實現最高成長。這一成長主要得益於精密農業、氣候智慧型農業計畫的推廣,以及大規模農業生產中對營養高效產品的日益成長的需求。在美國和加拿大,生物來源材料在玉米、大豆、蔬菜和特殊作物系統的應用持續擴大。強大的分銷網路和先進的農場管理技術也加速了與肥料最佳化和脅迫管理相關的生物促效劑配方的應用。商業農戶越來越重視這些產品的實際效果,而非僅依賴實驗性使用,這推動了全部區域農業部門在作物輪作和園藝生產系統中對這類產品的持續需求。
在亞太地區,該地區正透過擴大永續農業舉措和提高生物來源材料的應用率來鞏固其地位。根據印度政府新聞處消息,到2025年9月,將有146種生物促效劑產品被納入《肥料管制令》(FCO)第六附表,以規範產品品質、功效和商業化標準。印度和中國正積極支持生物來源和永續營養管理項目,以減少對傳統農業投入品的依賴。南美洲仍然是一個重要的地區,這要歸功於其以出口為導向的大豆、咖啡和水果生產系統。同時,在中東和非洲,儘管面臨乾旱脅迫、土壤鹽化和土壤品管等諸多挑戰,生物來源投入品的應用仍在逐步進行中。
其他好處:
- Excel格式的市場預測(ME)表
- 3個月的分析師支持
目錄
第1章:引言
- 研究假設和市場定義
- 調查範圍
- 調查方法
第2章:本報告的內容
第3章:執行摘要和主要發現
第4章:主要產業趨勢
- 有機耕作面積
- 人均有機產品支出
- 法律規範
- 阿根廷
- 澳洲
- 巴西
- 加拿大
- 中國
- 埃及
- 法國
- 德國
- 印度
- 印尼
- 義大利
- 日本
- 墨西哥
- 荷蘭
- 奈及利亞
- 菲律賓
- 俄羅斯
- 南非
- 西班牙
- 泰國
- 土耳其
- 英國
- 美國
- 越南
- 價值鍊和通路分析
- 市場促進因素
- 永續農業材料的引入
- 一條考慮有機耕作面積和農藥殘留的價值鏈。
- 監管部門的批准和產品合法性的提高
- 非生物脅迫與產量穩定性示範案例
- 碳權額和自然信用額貨幣化的途徑
- 種子和肥料計劃的整合
- 市場限制因素
- 全球未標準化的定義和計費規則
- 現場表現會因條件而異
- 更嚴格地執行索賠規定,以及重新分類的風險
- 海藻原料集中度及收成波動
- 技術展望
- 波特五力分析
第5章 市場規模與成長預測
- 按形式
- 胺基酸
- 富裡酸
- 腐植酸
- 蛋白質水解物
- 海藻萃取物
- 其他生物促效劑
- 按作物類型
- 一排作品
- 園藝作物
- 經濟作物
- 按地區
- 北美洲
- 美國
- 加拿大
- 墨西哥
- 其他北美國家
- 南美洲
- 巴西
- 阿根廷
- 其他南美國家
- 歐洲
- 德國
- 法國
- 義大利
- 西班牙
- 英國
- 俄羅斯
- 荷蘭
- 其他歐洲國家
- 亞太地區
- 中國
- 印度
- 日本
- 澳洲
- 印尼
- 泰國
- 越南
- 菲律賓
- 其他亞太國家
- 中東
- 沙烏地阿拉伯
- 伊朗
- 土耳其
- 其他中東國家
- 非洲
- 南非
- 埃及
- 奈及利亞
- 其他非洲國家
- 北美洲
第6章 競爭情勢
- 關鍵策略趨勢
- 策略趨勢
- 企業狀況
- 公司簡介
- Syngenta Crop Protection AG(Syngenta Group)
- UPL Limited
- BASF SE
- Bayer AG
- FMC Corporation
- Rovensa Next SL
- Coromandel International Limited
- Koppert BV
- Haifa Negev Technologies Ltd.(Haifa Group)
- BioAtlantis Ltd.
- Acadian Seaplants Limited
- Seipasa, SA
- Hello Nature International Srl
- Novonesis A/S
- PI Industries Limited
第7章 農業生技公司執行長面臨的關鍵策略挑戰
According to Mordor Intelligence, the biostimulants market size is projected to grow from USD 4.46 billion in 2025 to USD 4.90 billion in 2026 and reach USD 7.94 billion by 2031, registering a CAGR of 10.1% during 2026-2031.
This report is Segmented by Form (Amino Acids, Fulvic Acid, Humic Acid, Protein Hydrolysates, Seaweed Extracts, and More), by Crop Type (Cash Crops, Horticultural Crops, and Row Crops), and by Geography (North America, South America, Europe, Asia-Pacific, Middle East, and Africa). The Market Forecasts are Provided in Terms of Value (USD) and Volume (Metric Tons).
Global Biostimulants Market Trends and Insights
Sustainable Crop-Input Adoption
The adoption of sustainable crop inputs remains a key driver of demand in the biostimulants market, as it aligns with both current farm economics and agronomic requirements. Fertilizer price volatility following the COVID-19 pandemic has influenced growers to reassess input decisions. Many farms are now using biostimulants to enhance nutrient efficiency rather than as replacements for standard fertilizer programs. This shift is significant as it integrates biostimulants into core crop budgets, often resulting in repeat usage after initial trial cycles. A 2025 study by researchers from the University of Cordoba, Spain, demonstrated that amino acid biostimulants combined with slow-release urea increased grain protein content by up to 4.2% compared to untreated controls under semi-arid conditions.
Organic Acreage and Residue-Sensitive Value Chains
Organic acreage and residue-sensitive value chains are expanding the customer base of the biostimulants market beyond traditional crop systems. Retailer sourcing requirements are driving additional demand, as residue-free procurement standards often encourage growers to adopt biological solutions, even in the absence of formal regulatory mandates. According to the Economic Research Service of the United States Department of Agriculture, organic food sales reached USD 65.4 billion in 2024, indicating strong downstream demand. This is significant for the biostimulants market, as its adoption is no longer confined to a small organic segment. Row-crop growers and high-value horticultural producers are increasingly responding to similar buyer pressures from food and export markets.
Fragmented Global Definitions and Claim Rules
Fragmented legal definitions continue to constrain the biostimulants market in many regions outside Europe. In several countries across Africa, Southeast Asia, and South Asia, these products are regulated under pesticide-style statutes. This results in extended data requirements and prolonged registration timelines, which many suppliers find challenging to manage. According to the European Biostimulants Industry Council (EBIC), current compliance rules, including positive-list restrictions and chemical safety requirements, pose significant challenges, particularly for smaller companies aiming to commercialize new microbial solutions. This issue is closely tied to claim-enforcement risks, as suppliers may invest in product development only to encounter varying claim standards or differing product classifications across jurisdictions. Until a broader international framework is established, the biostimulants market is projected to grow unevenly, with regulatory differences influencing competition nearly as much as agronomic performance.
Other drivers and restraints analyzed in the detailed report include:
- Regulatory Recognition and Product-Legitimacy Gains
- Abiotic-Stress and Yield-Stability Proof Points
- Inconsistent Field Performance Across Conditions
For complete list of drivers and restraints, kindly check the Table Of Contents.
Segment Analysis
Amino acids held the largest 30.7% of revenue share in 2025. This dominance is attributed to their broad compatibility with fertigation systems, nutrient-efficiency programs, and stress-management applications across various crop categories. Amino acid formulations are widely used in cereals, vegetables, and horticultural crops due to their seamless integration into existing fertilizer schedules and crop-protection routines. The segment benefits from strong repeat-purchase behavior in commercial farming systems, where growers prioritize operational simplicity and measurable crop-quality improvements. Additionally, their stable shelf life, ease of handling, and increasing incorporation into biological input programs continue to drive adoption in large-scale agricultural production regions worldwide.
Humic acid is set to grow at the fastest 12.6% CAGR from 2026 to 2031. This growth is driven by rising concerns over soil degradation, nutrient-use efficiency, and drought-related crop stress in commercial agriculture. Humic acid formulations are increasingly adopted in corn, soybean, and cereal systems due to their ability to enhance nutrient availability and support root-zone activity under varying field conditions. Fulvic acid products are also gaining traction for their rapid plant interaction and chelation properties, while seaweed extracts remain significant for stress-management applications. Product innovation is increasingly focused on multi-active biological blends integrated into fertilizer and seed-treatment programs within mainstream agricultural production systems.
Geography Analysis
Europe accounted for the largest 38.3% of the market share in 2025. The region maintains leadership because the European Union regulation, which established a formal legal framework for plant biostimulants, has improved product standardization and cross-border commercialization. Europe also benefits from strong organic farming adoption and greater regulatory support for sustainable agricultural inputs. Countries including Spain, France, Germany, and Italy continue driving demand because their cereal, horticultural, olive, and wine industries prioritize residue management and export quality standards. Advanced agronomic advisory networks and stronger biological input awareness further support commercial adoption across both broadacre and high-value agricultural production systems throughout the region.
The North America market size is projected to grow at the fastest 12.7% CAGR from 2026 to 2031. Growth is supported by precision agriculture expansion, climate-smart farming programs, and increasing interest in nutrient-efficiency products across large-scale farming operations. The United States and Canada continue to increase biological input integration into corn, soybean, vegetable, and specialty-crop systems. Strong dealer infrastructure and advanced farm-management practices are also accelerating the adoption of biostimulant formulations linked to fertilizer optimization and stress management. Commercial growers increasingly evaluate these products through measurable agronomic outcomes rather than experimental use, strengthening recurring demand across row-crop and horticultural production systems throughout the regional agricultural sector.
The Asia-Pacific region is strengthening its position through the expansion of sustainable agriculture initiatives and increased adoption of biological inputs. According to the Press Information Bureau, Government of India, 146 biostimulant products had been included under Schedule VI of the Fertilizer Control Order (FCO) by September 2025 to regulate product quality, efficacy, and commercialization standards. India and China are actively supporting biological and sustainable nutrient-management programs to reduce reliance on conventional agricultural inputs. South America remains significant due to its export-oriented production systems for soybeans, coffee, and fruits. Meanwhile, the Middle East and Africa are witnessing the gradual adoption of biological inputs, driven by challenges such as drought stress, salinity exposure, and soil-quality management priorities.
- Syngenta Crop Protection AG (Syngenta Group)
- UPL Limited
- BASF SE
- Bayer AG
- FMC Corporation
- Rovensa Next S.L.
- Coromandel International Limited
- Koppert B.V.
- Haifa Negev Technologies Ltd. (Haifa Group)
- BioAtlantis Ltd.
- Acadian Seaplants Limited
- Seipasa, S.A.
- Hello Nature International S.r.l.
- Novonesis A/S
- PI Industries Limited
Additional Benefits:
- The market estimate (ME) sheet in Excel format
- 3 months of analyst support
TABLE OF CONTENTS
1 INTRODUCTION
- 1.1 Study Assumptions and Market Definition
- 1.2 Scope of the Study
- 1.3 Research Methodology
2 REPORT OFFERS
3 EXECUTIVE SUMMARY AND KEY FINDINGS
4 KEY INDUSTRY TRENDS
- 4.1 Area Under Organic Cultivation
- 4.2 Per Capita Spending on Organic Products
- 4.3 Regulatory Framework
- 4.3.1 Argentina
- 4.3.2 Australia
- 4.3.3 Brazil
- 4.3.4 Canada
- 4.3.5 China
- 4.3.6 Egypt
- 4.3.7 France
- 4.3.8 Germany
- 4.3.9 India
- 4.3.10 Indonesia
- 4.3.11 Italy
- 4.3.12 Japan
- 4.3.13 Mexico
- 4.3.14 Netherlands
- 4.3.15 Nigeria
- 4.3.16 Philippines
- 4.3.17 Russia
- 4.3.18 South Africa
- 4.3.19 Spain
- 4.3.20 Thailand
- 4.3.21 Turkey
- 4.3.22 United Kingdom
- 4.3.23 United States
- 4.3.24 Vietnam
- 4.4 Value Chain and Distribution Channel Analysis
- 4.5 Market Drivers
- 4.5.1 Sustainable crop-input adoption
- 4.5.2 Organic acreage and residue-sensitive value chains
- 4.5.3 Regulatory recognition and product-legitimacy gains
- 4.5.4 Abiotic-stress and yield-stability proof points
- 4.5.5 Carbon and nature-credit monetization pathways
- 4.5.6 Seed and fertilizer-program integration
- 4.6 Market Restraints
- 4.6.1 Fragmented global definitions and claim rules
- 4.6.2 Inconsistent field performance across conditions
- 4.6.3 Tighter claim-enforcement and reclassification risk
- 4.6.4 Seaweed feedstock concentration and harvest volatility
- 4.7 Technological Outlook
- 4.8 Porter's Five Forces Analysis
- 4.8.1 Bargaining Power of Buyers
- 4.8.2 Bargaining Power of Suppliers
- 4.8.3 Threat of New Entrants
- 4.8.4 Threat of Substitutes
- 4.8.5 Intensity of Competitive Rivalry
5 MARKET SIZE AND GROWTH FORECASTS (VALUE AND VOLUME)
- 5.1 By Form
- 5.1.1 Amino Acids
- 5.1.2 Fulvic Acid
- 5.1.3 Humic Acid
- 5.1.4 Protein Hydrolysates
- 5.1.5 Seaweed Extracts
- 5.1.6 Other Biostimulants
- 5.2 By Crop Type
- 5.2.1 Row Crops
- 5.2.2 Horticultural Crops
- 5.2.3 Cash Crops
- 5.3 By Geography
- 5.3.1 North America
- 5.3.1.1 United States
- 5.3.1.2 Canada
- 5.3.1.3 Mexico
- 5.3.1.4 Rest of North America
- 5.3.2 South America
- 5.3.2.1 Brazil
- 5.3.2.2 Argentina
- 5.3.2.3 Rest of South America
- 5.3.3 Europe
- 5.3.3.1 Germany
- 5.3.3.2 France
- 5.3.3.3 Italy
- 5.3.3.4 Spain
- 5.3.3.5 United Kingdom
- 5.3.3.6 Russia
- 5.3.3.7 Netherlands
- 5.3.3.8 Rest of Europe
- 5.3.4 Asia-Pacific
- 5.3.4.1 China
- 5.3.4.2 India
- 5.3.4.3 Japan
- 5.3.4.4 Australia
- 5.3.4.5 Indonesia
- 5.3.4.6 Thailand
- 5.3.4.7 Vietnam
- 5.3.4.8 Philippines
- 5.3.4.9 Rest of Asia-Pacific
- 5.3.5 Middle East
- 5.3.5.1 Saudi Arabia
- 5.3.5.2 Iran
- 5.3.5.3 Turkey
- 5.3.5.4 Rest of Middle East
- 5.3.6 Africa
- 5.3.6.1 South Africa
- 5.3.6.2 Egypt
- 5.3.6.3 Nigeria
- 5.3.6.4 Rest of Africa
- 5.3.1 North America
6 COMPETITIVE LANDSCAPE
- 6.1 Key Strategic Moves
- 6.2 Strategic Moves
- 6.3 Company Landscape
- 6.4 Company Profiles (Includes Global Level Overview, Market Level Overview, Core Segments, Financials as Available, Strategic Information, Market Rank/Share for Key Companies, Products and Services, and Recent Developments)
- 6.4.1 Syngenta Crop Protection AG (Syngenta Group)
- 6.4.2 UPL Limited
- 6.4.3 BASF SE
- 6.4.4 Bayer AG
- 6.4.5 FMC Corporation
- 6.4.6 Rovensa Next S.L.
- 6.4.7 Coromandel International Limited
- 6.4.8 Koppert B.V.
- 6.4.9 Haifa Negev Technologies Ltd. (Haifa Group)
- 6.4.10 BioAtlantis Ltd.
- 6.4.11 Acadian Seaplants Limited
- 6.4.12 Seipasa, S.A.
- 6.4.13 Hello Nature International S.r.l.
- 6.4.14 Novonesis A/S
- 6.4.15 PI Industries Limited
7 KEY STRATEGIC QUESTIONS FOR AGRICULTURAL BIOLOGICALS CEOS
 生物促效劑市場:依形態、原料、應用方法和作物類型分類-2026-2032年全球市場預測
 生物促效劑市場規模、佔有率、趨勢和預測:按產品類型、作物類型、形態、來源、分銷管道、應用、最終用戶和地區分類,2026-2034年
 中國生物促效劑市場:市場佔有率分析、產業趨勢與統計、成長預測(2026-2031)歐洲生物促效劑:市場佔有率分析、產業趨勢與統計、成長預測(2026-2031)
 全球生物促效劑市場規模、佔有率、趨勢和成長分析報告(2026-2034年)
 2026年全球生物促效劑市場報告
 生物促效劑市場規模、佔有率和趨勢分析報告:按活性成分、作物類型、應用、地區和細分市場預測(2026-2033 年)24- 表油菜素內酯市場按形態、作物類型、應用、最終用途和分銷管道分類 - 全球預測(2026-2032 年)PGPR生物促效劑市場按類型、作物類型、配方、應用和最終用戶分類-2026-2032年全球預測微生物植物生長促進劑市場(依微生物類型、作物類型、配方、功能、應用方法和通路)——2026-2032年全球預測