


 |
市場調查報告書
商品編碼
2083367
生物促效劑市場機會、成長促進因素、產業趨勢分析及2026-2035年預測Biostimulants Market Opportunity, Growth Drivers, Industry Trend Analysis, and Forecast 2026 - 2035 |
||||||

全球生物促效劑市場預計到 2025 年將價值 39 億美元,並將以 11.5% 的複合年成長率成長,到 2035 年將達到 117 億美元。
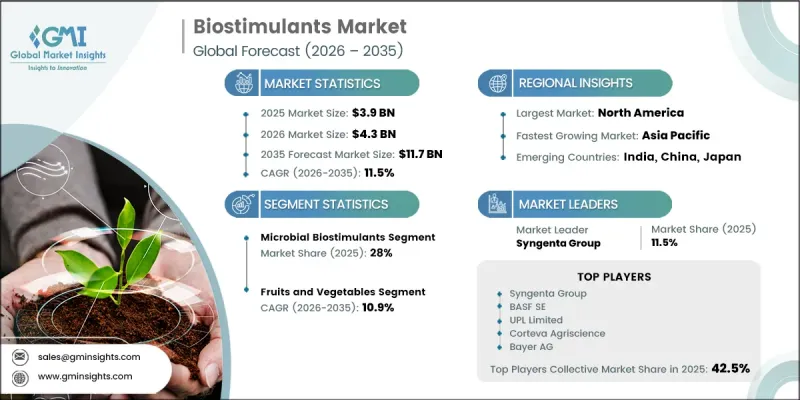
這一成長軌跡使生物促效劑市場成為農業生技藥品行業中成長最快的細分市場之一,其成長率顯著超過了許多傳統農業投入品類別。市場擴張反映了作物營養管理和農場管理策略的更廣泛轉變,生產者越來越重視資源效率、作物耐受性和生物強化,而非傳統的高投入方法。集約化農業地區土壤劣化的日益嚴重,加上不斷完善的法規結構和人們對永續農業實踐認知的提高,進一步增強了市場需求。此外,越來越多的證據表明,在不同的作物系統中應用生物促效劑可帶來可觀的經濟效益,這也推動了其應用。整個農業價值鏈的永續性舉措以及對環保生產方式日益成長的需求,共同創造了有利的市場環境,加速了生物解決方案在全球現代作物管理方案中的應用。
| 市場範圍 | |
|---|---|
| 開始年份 | 2025 |
| 預測期 | 2026-2035 |
| 起始金額 | 39億美元 |
| 預測金額 | 117億美元 |
| 複合年成長率 | 11.5% |
預計到2025年,微生物生物促效劑市佔率將達到28%。此細分市場的成長主要得益於人們對有益微生物在促進植物發育、養分利用、根系功能和提高作物整體產量方面所發揮作用的認知不斷提高。微生物生物促效劑透過增強土壤和根際的生物活性,提高養分利用效率,促進植物健康生長。人們對再生農業、永續作物生產和土壤健康管理的日益關注,也進一步推動了該細分市場的擴張。隨著生產者尋求在提高農業生產力的同時減少環境影響的解決方案,微生物產品在各種農業系統和作物中持續獲得支持。
預計到2025年,蔬果市場將佔據55%的市場佔有率,並在2035年之前以10.9%的複合年成長率成長。此細分市場強勁的市場地位反映了生產者對提高作物品質、產量、外觀、貯藏穩定性和整體市場競爭力的高度重視。由於多種品質特性直接影響蔬果生產的商業性效益,生產者擴大將生物促效劑納入作物管理方案,以最佳化植物在整個生長週期中的表現。生物促效劑能夠增強作物在不斷變化的環境條件下的適應能力,同時提高生產力,這持續推動其在全球集約化園藝生產系統中的應用。隨著對高品質農產品需求的成長,預計果蔬市場仍將是市場成長的主要驅動力。
預計到2025年,北美生物促效劑市佔率將達到17.8%,並在2035年之前以12.2%的複合年成長率成長。美國仍然是該地區需求的主要驅動力,這得益於永續農業實踐的廣泛應用、有機農業活動的擴張以及人們對生物作物改良解決方案日益成長的興趣。先進農業技術的應用使得作物管理決策更加精準,並提高了生物促效劑應用的經濟可行性。此外,整個農業供應鏈中設定的永續性目標正在促進環境友善農業材料的使用,全部區域市場的持續擴張創造了有利條件。
目錄
第1章:調查方法和範圍
第2章執行摘要
第3章 行業洞察
- 產業生態系分析
- 供應商情況
- 利潤率
- 每個階段增加的價值
- 影響價值鏈的因素
- 中斷
- 影響產業的因素
- 成長促進因素
- 對永續農業材料的需求日益成長
- 透過提高效率來提高作物產量
- 擴大在綜合農業系統的應用
- 產業潛在風險與挑戰
- 小規模農戶對產品的認知度較低
- 由於場地條件不同,性能會有差異。
- 市場機遇
- 在全球推廣有機農業實踐
- 微生物和海藻配方方面的創新
- 新興農業市場採用率的擴大
- 成長促進因素
- 成長潛力分析
- 監理情勢
- 北美洲
- 歐洲
- 亞太地區
- 拉丁美洲
- 中東和非洲
- 波特的分析
- PESTLE分析
- 技術與創新展望
- 最新科技趨勢
- 新興技術
- 價格趨勢
- 按地區
- 按活性成分
- 未來市場趨勢
- 專利趨勢
- 貿易統計
- 主要進口國
- 主要出口國
- 永續性和環境方面
- 永續計劃
- 減少廢棄物策略
- 生產中的能源效率
- 具有環保意識的舉措
- 考慮碳足跡
第4章 競爭情勢
- 介紹
- 企業市佔率分析
- 按地區
- 北美洲
- 歐洲
- 亞太地區
- 拉丁美洲
- 中東和非洲
- 按地區
- 企業矩陣分析
- 主要市場公司的競爭分析
- 競爭定位矩陣
- 主要進展
- 併購
- 夥伴關係和聯盟
- 新產品發布
- 業務拓展計劃
第5章 市場估計與預測:依活性成分分類,2022-2035年
- 微生物生物促效劑
- 植物促進根際細菌(PGPR)
- 芽孢桿菌屬
- 假單胞菌
- 固氮螺菌
- 根瘤菌
- 有益真菌
- 叢枝菌根真菌(AMF)
- 木黴
- 其他
- 植物促進根際細菌(PGPR)
- 腐植質
- 腐植酸
- 富裡酸
- 海藻萃取物
- 褐藻
- 結節菌膜
- 埃克羅尼亞·馬克西瑪
- 其他海藻衍生成分
- 蛋白質水解物和胺基酸
- 植物來源蛋白水解物
- 水解動物性蛋白質
- 遊離胺基酸
- 其他
第6章 市場估算與預測:依作物類型分類,2022-2035年
- 農作物和穀物
- 玉米
- 小麥
- 米
- 大豆
- 其他穀物和穀類
- 水果和蔬菜
- 仁果類水果(蘋果、梨)
- 柑橘
- 莓果
- 根莖類
- 綠葉蔬菜
- 其他水果和蔬菜
- 草坪和觀賞植物
- 景觀設計和高爾夫球場
- 觀賞植物和花卉
- 其他
第7章 市場估計與預測:依形狀分類,2022-2035年
- 液體
- 乾粉/顆粒
第8章 市場估計與預測:依應用領域分類,2022-2035年
- 葉面噴布
- 土壤施用
- 種子傳播
- 其他
第9章 市場估計與預測:依地區分類,2022-2035年
- 北美洲
- 美國
- 加拿大
- 歐洲
- 德國
- 英國
- 法國
- 西班牙
- 義大利
- 其他歐洲國家
- 亞太地區
- 中國
- 印度
- 日本
- 澳洲
- 韓國
- 其他亞太國家
- 拉丁美洲
- 巴西
- 墨西哥
- 阿根廷
- 其他拉丁美洲國家
- 中東和非洲
- 沙烏地阿拉伯
- 南非
- UAE
- 其他中東和非洲國家
第10章:公司簡介
- UPL Limited
- BASF SE
- Syngenta Group
- Corteva Agriscience
- FMC Corporation
- Bayer AG
- Sumitomo Chemical Co., Ltd.
- Novonesis Group(formerly Novozymes)
- Koppert BV
- Valagro SpA
- Nufarm Limited
- Acadian Seaplants Limited
- Qingdao Seawin Biotech Group
The Global Biostimulants Market was valued at USD 3.9 billion in 2025 and is estimated to grow at a CAGR of 11.5% to reach USD 11.7 billion by 2035.
The growth trajectory positions the biostimulants market among the most rapidly expanding segments within the agricultural biologicals industry, significantly outperforming the growth rates observed across many conventional agricultural input categories. Market expansion reflects a broader transformation in crop nutrition and farm management strategies, with producers increasingly prioritizing resource efficiency, crop resilience, and biological enhancement over traditional input-intensive approaches. Growing concerns regarding soil degradation in highly cultivated agricultural regions, combined with evolving regulatory frameworks and increasing awareness of sustainable farming practices, continue to strengthen market demand. Furthermore, the expanding body of evidence demonstrating favorable economic returns from biostimulant applications across diverse crop systems is encouraging broader adoption. Sustainability initiatives throughout the agricultural value chain, together with rising demand for environmentally responsible production methods, are creating favorable market conditions and accelerating the integration of biological solutions into modern crop management programs worldwide.
| Market Scope | |
|---|---|
| Start Year | 2025 |
| Forecast Year | 2026-2035 |
| Start Value | $3.9 Billion |
| Forecast Value | $11.7 Billion |
| CAGR | 11.5% |
The microbial biostimulants segment accounted for 28% share in 2025. Market growth within this segment is driven by increasing recognition of the role beneficial microorganisms play in supporting plant development, nutrient utilization, root performance, and overall crop productivity. Microbial biostimulants function by enhancing biological activity within the soil and root environment, helping improve nutrient availability and promoting healthier plant growth. Rising interest in regenerative agriculture, sustainable crop production, and soil health management is further contributing to the expansion of this segment. As growers seek solutions that improve agricultural productivity while reducing environmental impact, microbial-based products continue to gain traction across a wide range of farming systems and crop categories.
The fruits and vegetables segment held a 55% share in 2025 and is projected to grow at a CAGR of 10.9% through 2035. The segment's strong market position reflects the substantial value growers place on improving crop quality, yield performance, appearance, storage stability, and overall marketability. Because multiple quality attributes directly influence commercial returns within fruit and vegetable production, producers are increasingly incorporating biostimulants into crop management programs to optimize plant performance throughout the growing cycle. The ability of biostimulants to support crop resilience under varying environmental conditions while enhancing productivity continues to drive adoption across intensive horticultural production systems globally. As demand for premium-quality produce increases, the fruit and vegetables segment is expected to remain a key contributor to market growth.
North America Biostimulants Market accounted for 17.8% share in 2025 and is anticipated to grow at a CAGR of 12.2% throughout 2035. The United States remains the primary contributor to regional demand, supported by increasing adoption of sustainable agricultural practices, expanding organic farming activities, and growing interest in biological crop enhancement solutions. The integration of advanced farming technologies is also improving the economic viability of biostimulant applications by enabling more precise crop management decisions. In addition, sustainability objectives established across agricultural supply chains are encouraging the use of environmentally responsible crop inputs, creating favorable conditions for continued market expansion across the region.
Leading companies operating in the Global Biostimulants Market include Syngenta Group, Acadian Seaplants Limited, Bayer AG, UPL Limited, Novonesis Group, BASF SE, Nufarm Limited, FMC Corporation, Koppert B.V., Qingdao Seawin Biotech Group, Sumitomo Chemical Co. Ltd., Valagro SpA, and Corteva Agriscience. Companies participating in the Biostimulants Market are implementing a variety of strategic initiatives to strengthen their competitive positions and expand market share. A major area of focus involves increasing investments in research and development to create innovative biological formulations with improved performance, broader crop applicability, and enhanced environmental sustainability. Strategic acquisitions, partnerships, and collaborations are enabling companies to expand product portfolios, accelerate technology development, and strengthen distribution networks. Market participants are also prioritizing geographic expansion into emerging agricultural regions where demand for sustainable farming solutions is increasing. In addition, companies are investing in farmer education programs, field validation studies, and agronomic support services to improve product awareness and adoption.
Table of Contents
Chapter 1 Methodology & Scope
- 1.1 Market scope and definition
- 1.2 Research design
- 1.2.1 Research approach
- 1.2.2 Data collection methods
- 1.3 Data mining sources
- 1.3.1 Global
- 1.3.2 Regional/Country
- 1.4 Base estimates and calculations
- 1.4.1 Base year calculation
- 1.4.2 Key trends for market estimation
- 1.5 Primary research and validation
- 1.5.1 Primary sources
- 1.6 Forecast model
- 1.7 Research assumptions and limitations
Chapter 2 Executive Summary
- 2.1 Industry 360° synopsis
- 2.2 Key market trends
- 2.2.1 Active Ingredient
- 2.2.2 Crop Type
- 2.2.3 Form
- 2.2.4 Application
- 2.2.5 Regional
- 2.3 TAM Analysis, 2026-2035
- 2.4 CXO perspectives: Strategic imperatives
- 2.5 Future outlook and strategic recommendations
Chapter 3 Industry Insights
- 3.1 Industry ecosystem analysis
- 3.1.1 Supplier landscape
- 3.1.2 Profit margin
- 3.1.3 Value addition at each stage
- 3.1.4 Factor affecting the value chain
- 3.1.5 Disruptions
- 3.2 Industry impact forces
- 3.2.1 Growth drivers
- 3.2.1.1 Rising demand for sustainable agricultural inputs
- 3.2.1.2 Improved crop yield through enhanced efficiency
- 3.2.1.3 Growing adoption in integrated farming systems
- 3.2.2 Industry pitfalls and challenges
- 3.2.2.1 Limited product awareness among small-scale farmers
- 3.2.2.2 Inconsistent performance across varying field conditions
- 3.2.3 Market opportunities
- 3.2.3.1 Expansion in organic farming practices globally
- 3.2.3.2 Innovation in microbial and seaweed formulations
- 3.2.3.3 Increasing adoption across emerging agricultural markets
- 3.2.1 Growth drivers
- 3.3 Growth potential analysis
- 3.4 Regulatory landscape
- 3.4.1 North America
- 3.4.2 Europe
- 3.4.3 Asia Pacific
- 3.4.4 Latin America
- 3.4.5 Middle East & Africa
- 3.5 Porter’s analysis
- 3.6 PESTEL analysis
- 3.7 Technology and innovation landscape
- 3.7.1 Current technological trends
- 3.7.2 Emerging technologies
- 3.8 Price trends
- 3.8.1 By region
- 3.8.2 By Active Ingredient
- 3.9 Future market trends
- 3.10 Patent landscape
- 3.11 Trade statistics (HS code)
- 3.11.1 Major importing countries
- 3.11.2 Major exporting countries
- 3.12 Sustainability and environmental aspects
- 3.12.1 Sustainable practices
- 3.12.2 Waste reduction strategies
- 3.12.3 Energy efficiency in production
- 3.12.4 Eco-friendly initiatives
- 3.13 Carbon footprint consideration
Chapter 4 Competitive Landscape, 2025
- 4.1 Introduction
- 4.2 Company market share analysis
- 4.2.1 By region
- 4.2.1.1 North America
- 4.2.1.2 Europe
- 4.2.1.3 Asia Pacific
- 4.2.1.4 LATAM
- 4.2.1.5 MEA
- 4.2.1 By region
- 4.3 Company matrix analysis
- 4.4 Competitive analysis of major market players
- 4.5 Competitive positioning matrix
- 4.6 Key developments
- 4.6.1 Mergers & acquisitions
- 4.6.2 Partnerships & collaborations
- 4.6.3 New product launches
- 4.6.4 Expansion plans
Chapter 5 Market Estimates and Forecast, By Active Ingredient, 2022-2035 (USD Million) (Kilo Tons)
- 5.1 Key trends
- 5.2 Microbial biostimulants
- 5.2.1 Plant growth-promoting rhizobacteria (PGPR)
- 5.2.1.1 Bacillus
- 5.2.1.2 Pseudomonas
- 5.2.1.3 Azospirillum
- 5.2.1.4 Rhizobium
- 5.2.2 Beneficial fungi
- 5.2.2.1 Arbuscular mycorrhizal fungi (AMF)
- 5.2.2.2 Trichoderma
- 5.2.2.3 Others
- 5.2.1 Plant growth-promoting rhizobacteria (PGPR)
- 5.3 Humic substances
- 5.3.1 Humic acid
- 5.3.2 Fulvic acid
- 5.4 Seaweed extracts
- 5.4.1 Brown algae
- 5.4.2 Ascophyllum nodosum
- 5.4.3 Ecklonia maxima
- 5.4.4 Other seaweed sources
- 5.5 Protein hydrolysates & amino acids
- 5.5.1 Plant-based protein hydrolysates
- 5.5.2 Animal-based protein hydrolysates
- 5.5.3 Free amino acids
- 5.6 Others
Chapter 6 Market Estimates and Forecast, By Crop Type, 2022-2035 (USD Million) (Kilo Tons)
- 6.1 Key trends
- 6.2 Row crops & cereals
- 6.2.1 Corn
- 6.2.2 Wheat
- 6.2.3 Rice
- 6.2.4 Soybean
- 6.2.5 Other cereals & grains
- 6.3 Fruits & vegetables
- 6.3.1 Pome fruits (Apples, Pears)
- 6.3.2 Citrus fruits
- 6.3.3 Berries
- 6.3.4 Root & tuber vegetables
- 6.3.5 Leafy vegetables
- 6.3.6 Other fruits & vegetables
- 6.4 Turf & ornamentals
- 6.4.1 Landscaping & golf courses
- 6.4.2 Ornamental plants & flowers
- 6.5 Others
Chapter 7 Market Estimates and Forecast, By Form, 2022-2035 (USD Million) (Kilo Tons)
- 7.1 Key trends
- 7.2 Liquid
- 7.3 Dry/Granules
Chapter 8 Market Estimates and Forecast, By Application, 2022-2035 (USD Million) (Kilo Tons)
- 8.1 Key trends
- 8.2 Foliar application
- 8.3 Soil application
- 8.4 Seed application
- 8.5 Others
Chapter 9 Market Estimates and Forecast, By Region, 2022-2035 (USD Million) (Kilo Tons)
- 9.1 Key trends
- 9.2 North America
- 9.2.1 U.S.
- 9.2.2 Canada
- 9.3 Europe
- 9.3.1 Germany
- 9.3.2 UK
- 9.3.3 France
- 9.3.4 Spain
- 9.3.5 Italy
- 9.3.6 Rest of Europe
- 9.4 Asia Pacific
- 9.4.1 China
- 9.4.2 India
- 9.4.3 Japan
- 9.4.4 Australia
- 9.4.5 South Korea
- 9.4.6 Rest of Asia Pacific
- 9.5 Latin America
- 9.5.1 Brazil
- 9.5.2 Mexico
- 9.5.3 Argentina
- 9.5.4 Rest of Latin America
- 9.6 Middle East and Africa
- 9.6.1 Saudi Arabia
- 9.6.2 South Africa
- 9.6.3 UAE
- 9.6.4 Rest of Middle East and Africa
Chapter 10 Company Profiles
- 10.1 UPL Limited
- 10.2 BASF SE
- 10.3 Syngenta Group
- 10.4 Corteva Agriscience
- 10.5 FMC Corporation
- 10.6 Bayer AG
- 10.7 Sumitomo Chemical Co., Ltd.
- 10.8 Novonesis Group (formerly Novozymes)
- 10.9 Koppert B.V.
- 10.10 Valagro SpA
- 10.11 Nufarm Limited
- 10.12 Acadian Seaplants Limited
- 10.13 Qingdao Seawin Biotech Group

 生物促效劑市場:依形態、原料、應用方法和作物類型分類-2026-2032年全球市場預測
 全球生物促效劑市場 2026–2030
 全球生物促效劑市場:依活性成分、劑型、應用方法、作物類型和地區分類-預測至2031年
 生物促效劑市場預測至2034年-按作物類型、活性成分、劑型、通路、應用方法和地區分類的全球分析
 生物促效劑:市場佔有率分析、產業趨勢與統計、成長預測(2026-2031)
 生物促效劑市場:按應用、作物類型、活性成分和地區分類
 生物促效劑市場規模、佔有率、趨勢和預測:按產品類型、作物類型、形態、來源、分銷管道、應用、最終用戶和地區分類,2026-2034年中國生物促效劑市場:市場佔有率分析、產業趨勢與統計、成長預測(2026-2031)歐洲生物促效劑:市場佔有率分析、產業趨勢與統計、成長預測(2026-2031)
 全球生物促效劑市場規模、佔有率、趨勢和成長分析報告(2026-2034年)