

 |
市場調查報告書
商品編碼
2066400
資料中心建置:市場佔有率分析、產業趨勢與統計、成長預測(2026-2031)Data Center Construction - Market Share Analysis, Industry Trends & Statistics, Growth Forecasts (2026 - 2031) |
||||||
※ 本網頁內容可能與最新版本有所差異。詳細情況請與我們聯繫。
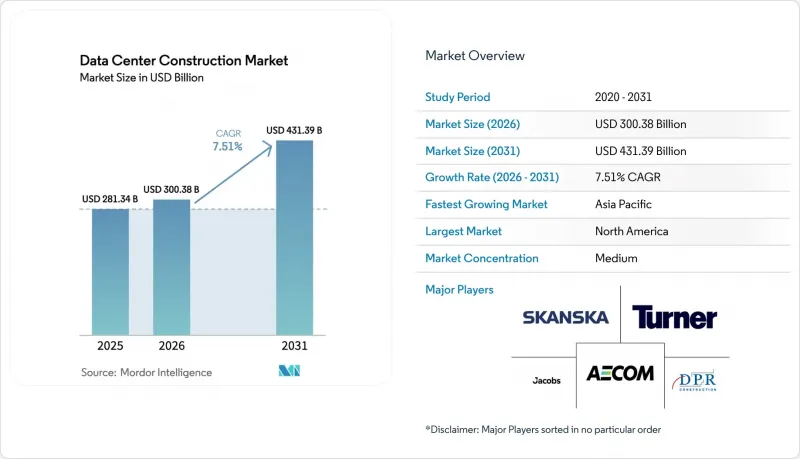
根據 Mordor Intelligence 預測,資料中心建設市場規模將從 2025 年的 2,813.4 億美元成長到 2026 年的 3,003.8 億美元,然後在 2031 年達到 4,313.9 億美元,2026 年至 2031 年的複合成長率為 7.51%。
本報告按資料中心層級(一級、二級、三級、四級)、資料中心規模(小規模、中型、大型、超大規模)、資料中心類型(託管、超大規模資料中心業者/雲端服務供應商、企業級和邊緣計算)、基礎設施(電氣、機械、一般建築、服務)以及地區(北美、南美、歐洲及其他地區)進行細分。市場預測以美元計價。
全球資料中心建置市場趨勢及洞察
引入現場小型模組化核子反應爐,以避免電網的限制。
小型模組化核子反應爐正日益受到開發商的關注,因為它是唯一能夠以具有競爭力的進度提供吉瓦級基本負載電力且不產生碳排放的能源方案。谷歌與凱羅斯電力公司於2024年簽署的500兆瓦合約將確保在2030年前實現電力供應,從而避免長達七年的併網等待期。 2025年,西屋電氣和Data4公司正推進在法國園區內共建AP300機組的計劃,以減少輸電損耗,並使運營商免受波動劇烈的夜間電力市場的影響。聯邦政府的支持力道也不斷增加。美國能源局已撥款9億美元用於簡化許可程序,縮短通常長達10年的核准流程。目前的主要限制因素是燃料,因為高等級低濃縮鈾(HALU)的年產量僅夠商業核子反應爐。因此,只有擁有雄厚財力和內部核能團隊的超大規模資料中心業者資料中心營運商才能同時採購燃料和核子反應爐,從而進一步鞏固其在資料中心建立市場的主導地位。
雲端應用、人工智慧和巨量資料工作負載不斷擴大
生成式人工智慧和分析叢集現在每個機架需要 40kW 到 100kW 的電力,是傳統熱負載的四倍。 OpenAI 宣布將於 2025 年在密西根州建造一座 500MW 的資料中心,該專案結合了客製化變電站和電池緩衝系統來應對電網波動。微軟 800 億美元的資本計畫中有 60% 用於資料中心建設,凸顯了擁有人工智慧基礎設施是一項策略重點。大規模流量的不可預測性正促使服務提供者從 2MW 的邊緣資料中心轉向 50MW 到 200MW 的超大規模資料中心,這些資料中心的備用容量可以吸收推理處理量的激增,而不會加劇延遲。然而,人才短缺是一個令人擔憂的問題。到 2025 年,三分之二的營運商將難以招募到能夠試運行晶片直接冷卻和浸沒式冷卻迴路的技術人員。能夠及早找到冷卻系統整合商的承包商通常可以比競爭對手提前一年進入市場,這在資料中心建立市場中具有決定性優勢。
不斷上漲的房地產、安裝和維護成本
2023年至2025年間,變壓器交貨時間加倍,銅價飆升,專案總成本增加了15%至25%。維吉尼亞北部的地價上漲至100萬至200萬美元,迫使開發商將目光轉向俄亥俄州和卡羅來納州。在這些地區,光纖鋪設的延誤抵消了地價下降的好處。目前,具備480V母線槽安裝資質的電工年收入在12萬至15萬美元之間。人工智慧機架所需設備的升級使每千瓦的成本增加了200至400美元,推高了資本預算。受通膨前租賃協議約束的託管設施所有者,面臨利潤率被壓縮到低於償還建設債務所需的25%的困境。
細分市場分析
到2025年,三級設施將佔所有部署的56.64%。隨著金融服務和醫療保健行業的客戶對高可靠性正常運作的需求日益成長,四級設施的建設正以8.12%的複合年成長率快速擴張。 2025年的研究估計,意外停機的成本將達到每分鐘9,000美元,足以證明四級設施的高價合理。由於需要雙電源,合適的位置僅限於北維吉尼亞、法蘭克福和新加坡等樞紐地區。維修工程通常會在最初僅用於電氣工程的預算基礎上,額外增加5,000萬至1億美元的預算。小規模的供應商仍在銷售三級基礎設施,並透過合約漏洞掩蓋其可靠性不足的本質。
對四級設施日益成長的需求正在改變供應鏈動態。開關設備和冷卻器供應商優先保障容錯項目的現貨供應,從而將前置作業時間縮短了最多三個月。設計人員擴大選擇模組化電氣室以加快試運行,而業主則在考慮維修甚至徹底放棄二級設施。
至2025年,超大規模園區將佔總占地面積的58.49%,並繼續以8.67%的複合年成長率成長。微軟已累計800億美元的資本支出,其中大部分用於50兆瓦至200兆瓦的建設項目。對於30兆瓦至50兆瓦的中型項目,目前越來越傾向於以「外殼」(結構)的形式交付設施,並以10兆瓦為增量逐步增加電力供應,以便根據租賃協議的進展調整資金投入。
在城市中心附近,低於 5 兆瓦的邊緣站點蓬勃發展,因為低於 10 毫秒的延遲對於擴增實境/虛擬實境 (AR/VR) 和交易工作負載至關重要。超大規模採購需求推高了變壓器和浸沒式水箱的全球價格,經常導致區域項目供應緊張。面對不斷增加的資本支出,企業擴大選擇將工作負載遷移到雲端,而不是升級其本地基礎設施。
區域分析
到2025年,北美維吉尼亞、德克薩斯州和俄亥俄州將新增5吉瓦的發電容量。微軟、Meta和Google承諾在2027年將在美國總合總合1,500億美元用於電力建設。加拿大魁北克省和不列顛哥倫比亞省水力資源豐富,正吸引尋求低碳電力的超大規模資料中心業者企業。墨西哥蒙特雷和克雷塔羅的叢集正透過跨境光纖線路不斷擴張,但電網可靠性仍然令人擔憂。加州的「第24號法規」規定PUE值上限為1.2,實際上禁止了風冷式設計。
歐洲的規劃主要集中在法蘭克福、阿姆斯特丹和倫敦,這些地區的土地價格高達每平方公尺6000美元。德國的《可再生能源法》鼓勵開發商在現場安裝太陽能發電和電池儲能系統。英國脫歐後,對資料主權的日益重視推動了倫敦和曼徹斯特對Tier 4級資料中心的需求。法國和西班牙正透過稅收優惠吸引超大規模項目,但其南部電網正面臨供給能力短缺。將於2025年生效的《企業永續性報告指令》將強制要求揭露範圍3碳排放。
亞太地區正經歷最快的成長。儘管人工智慧晶片出口受到限制,中國國有電力公司仍在支援一個2吉瓦的園區建設。隨著外國超大規模企業為滿足資料居住法規而進行在地化部署,印度的資料中心正以兩位數的速度擴張。在新加坡,土地稀缺使得機架密度達到30千瓦或更高,水冷成為標準配備。韓國、澳洲和紐西蘭正在吸引遊戲和串流媒體領域的邊緣節點。日本老化的電網導致併網延遲數年,需求正在轉移到海外。
中東和非洲正在崛起為新的樞紐。沙烏地阿拉伯的NEOM正在建造1吉瓦的資料中心,作為其5000億美元智慧城市計畫的一部分。杜拜和阿布達比提供免稅區,並為洲際託管提供快速核准服務。由於連接歐洲和亞洲的海底光纜,土耳其和以色列正在成為低延遲的傳輸節點。南非、奈及利亞和埃及正在擴展其邊緣基礎設施,以配合5G部署和雲端遊戲的發展。
其他好處:
- Excel格式的市場預測(ME)表
- 3個月的分析師支持
目錄
第1章:引言
- 研究假設和市場定義
- 調查範圍
第2章:調查方法
第3章執行摘要
第4章 市場狀況
- 市場概覽
- 市場促進因素
- 雲端應用、人工智慧和巨量資料工作負載正在不斷擴展。
- 加速採用超大規模設施
- 在人口密集區域周邊地區推廣邊緣運算的應用
- 強制使用可再生能源將影響設施設計。
- 引入現場小型模組化反應器(SMR)以規避電網的限制
- 利用「配套完善的土地」建設投機性園區的出現,縮短了簽訂預租協議所需的時間。
- 市場限制因素
- 不斷上漲的房地產、安裝和維護成本
- 更嚴格的能源消耗和碳排放法規
- 先進液冷技術領域熟練勞動力短缺
- 公共產業公司的「照付不議」擔保限制了資本,扼殺了中型開發商的發展。
- 產業供應鏈分析
- 監理情勢
- 技術展望
- 波特五力分析
- 資料中心的關鍵統計數據
- 按地區分類的資料中心營運商列表(單位:兆瓦)
- 各地區即將建置的主要資料中心項目清單(2025-2030 年)
- 資料中心建置中的資本支出與營運支出
- 2023 年及 2024 年各地區資料中心電力容量吸收量(單位:兆瓦)。
- 在各區域的資料中心建設中引入人工智慧(AI)
- 監理與合規框架
- 宏觀經濟因素對市場的影響
第5章 市場規模與成長預測
- 層級類型
- 一級和二級
- 三級
- 第四級
- 按資料中心規模
- 小規模
- 中號
- 大規模
- 超大規模
- 依資料中心類型
- 託管資料中心
- 超大規模資料中心業者雲端服務供應商/雲端服務供應商(CSP)
- 企業和邊緣資料中心
- 透過基礎設施
- 電力基礎設施
- 配電解決方案
- 備用電源解決方案
- 機械基礎設施
- 冷卻系統
- 機架和機櫃
- 伺服器和儲存
- 其他機械基礎設施
- 一般建築
- 服務 - 設計與諮詢、整合、支援與維護
- 電力基礎設施
- 按地區
- 北美洲
- 美國
- 加拿大
- 墨西哥
- 南美洲
- 巴西
- 阿根廷
- 其他南美國家
- 歐洲
- 德國
- 英國
- 法國
- 義大利
- 西班牙
- 其他歐洲國家
- 亞太地區
- 中國
- 日本
- 印度
- 韓國
- 澳洲和紐西蘭
- 其他亞太國家
- 中東和非洲
- 中東
- 海灣合作理事會成員國
- 土耳其
- 以色列
- 其他中東國家
- 非洲
- 南非
- 埃及
- 奈及利亞
- 其他非洲國家
- 中東
- 北美洲
第6章 競爭情勢
- 市場集中度
- 策略趨勢
- 市佔率分析
- Data Center Infrastructure Investment Based on Megawatt(MW)Capacity, 2024 vs 2030
- Data Center Construction Landscape(Key Vendors Listings)
- 公司簡介
- AECOM
- Turner Construction Co.
- DPR Construction
- Jacobs Solutions Inc.
- Skanska AB
- Balfour Beatty plc
- Whiting-Turner Contracting Co.
- Hensel Phelps
- Fortis Construction Inc.
- Goodman Group
- PT Jaya Obayashi
- Hibiya Engineering Ltd.
- Fluor Corporation
- Keppel Data Centres Holding
- NTT Global Data Centers
- Equinix Inc.
- Digital Realty Trust Inc.
- QTS Realty Trust LLC
- China State Construction Engineering Corp.
- Larsen and Toubro Ltd.
- Bouygues Construction SA
- Vinci Energies
- Samsung C and T Corporation
- Collen Construction Ltd.
- Corgan
- Mortenson Construction
- List of Data Center Construction Companies
第7章 市場機會與未來展望
According to Mordor Intelligence, the data center construction market size is expected to grow from USD 281.34 billion in 2025 to USD 300.38 billion in 2026 and is forecast to reach USD 431.39 billion by 2031 at 7.51% CAGR over 2026-2031.
This report is Segmented by Tier Type (Tier 1 and 2, Tier 3, and Tier 4), Data Center Size (Small, Medium, Large, and Hyperscale), Data Center Type (Colocation, Hyperscalers/CSPs, and Enterprise and Edge), Infrastructure (Electrical, Mechanical, General Construction, and Services), and Geography (North America, South America, Europe, and More). Market Forecasts are Provided in Terms of Value (USD).
Global Data Center Construction Market Trends and Insights
Deployment of On-Site Small Modular Reactors to Bypass Grid Constraints
Developers increasingly view small modular reactors as the only carbon-free option capable of delivering gigawatt-scale baseload within competitive timelines. Google's 500 MW Kairos Power deal signed in 2024 enables delivery before 2030 and circumvents seven-year interconnection queues. In 2025, Westinghouse and Data4 advanced a plan to co-locate AP300 units at French campuses, cutting transmission losses and insulating operators from volatile day-ahead power markets. Federal support is widening; the U.S. Department of Energy earmarked USD 900 million toward streamlined licensing, trimming the typical decade-long approval slog. The constraint is fuel because annual high-assay low-enriched uranium capacity supports fewer than ten commercial reactors. Consequently, only hyperscalers with deep pockets and in-house nuclear teams can underwrite parallel fuel and reactor procurement, reinforcing their edge in the data center construction market.
Growing Cloud Applications, AI and Big Data Workloads
Generative-AI and analytics clusters now demand 40 kW-100 kW per rack, a jump that quadruples traditional thermal loads. OpenAI's 500 MW Michigan build, announced in 2025, pairs custom substations with battery buffers to ride out grid fluctuations. Microsoft's USD 80 billion capital plan channels 60% toward data-center builds, underscoring the strategic priority of owning AI infrastructure. Traffic unpredictability at scale is steering providers away from 2 MW edge pods toward 50 MW-200 MW hyperscale campuses, where spare headroom absorbs inference spikes without latency penalties. Yet talent scarcity looms; two-thirds of operators struggled in 2025 to hire technicians capable of commissioning direct-to-chip and immersion loops. Contractors that secure cooling-system integrators early often beat rivals to market by up to a year, a decisive advantage in the data center construction market.
Escalating Real-Estate, Installation and Maintenance Cost
Transformer lead times doubled and copper prices surged between 2023 and 2025, pushing total project costs up 15%-25%. Northern Virginia acreage climbed to USD 1 million-USD 2 million, redirecting developers to Ohio and the Carolinas where fiber delays offset cheaper land. Electricians qualified for 480-V busways now earn USD 120 000-USD 150 000. Mechanical upgrades required for AI racks add USD 200-USD 400 per kW, inflating capital budgets. Colocation landlords locked into pre-inflation leases face margin compression below the 25% threshold needed to service construction debt.
Other drivers and restraints analyzed in the detailed report include:
- Accelerating Adoption of Hyperscale Facilities
- Emergence of Powered-Land Speculative Campuses Shortening Pre-Lease Timelines
- Utility Take-or-Pay Deposits Locking Up Capital and Deterring Mid-Tier Developers
For complete list of drivers and restraints, kindly check the Table Of Contents.
Segment Analysis
Tier 3 assets commanded 56.64% of installations in 2025. Tier 4 builds are scaling at an 8.12% CAGR as financial-services and healthcare buyers demand fault-tolerant uptime. A 2025 study pegged unplanned-outage costs at USD 9 000 per minute, justifying Tier 4 premiums. Dual utility feeds limit suitable sites to hubs such as Northern Virginia, Frankfurt, and Singapore. Retrofit projects often add USD 50 million to USD 100 million to budgets originally scoped for electrical work alone. Smaller providers continue marketing Tier 3 infrastructure with contractual workarounds that mask the absence of true fault tolerance.
Heightened Tier 4 interest is shifting supply-chain dynamics. Switchgear and chiller vendors prioritize quick-ship inventories for fault-tolerant projects, accelerating lead times by up to three months. Designers increasingly specify modular electrical rooms to speed commissioning, while owners weigh whether to convert Tier 2 sites or exit them entirely.
Hyperscale campuses held 58.49% of floor space in 2025 and are pushing forward at an 8.67% CAGR. Microsoft allocated USD 80 billion for capital expenditures, with the majority aimed at 50 MW-200 MW builds. Medium builds of 30 MW-50 MW are increasingly delivered as shells energized in 10 MW increments to align capital with lease uptake.
Edge sites under 5 MW prosper near city cores where latency under 10 milliseconds is mandatory for AR/VR and trading workloads. Hyperscale procurement drives global pricing for transformers and immersion tanks, frequently squeezing availability for regional projects. Enterprises, facing higher capex, often opt to migrate workloads to the cloud instead of upgrading on-premise footprints.
Geography Analysis
North America added 5 GW of capacity in 2025 across Virginia, Texas, and Ohio. Microsoft, Meta, and Google together committed USD 150 billion toward U.S. builds through 2027. Canada's hydro-rich Quebec and British Columbia attract hyperscalers seeking low-carbon power. Mexico's Monterrey and Queretaro clusters grow on cross-border fiber, though grid reliability remains a concern. California's Title 24 now caps PUE at 1.2, effectively banning air-cooled designs.
Europe's pipeline centers on Frankfurt, Amsterdam, and London where land hits USD 6 000 per m2. Germany's Renewable Energy Sources Act pushes developers toward on-site solar and batteries. Brexit-driven data sovereignty boosts Tier 4 demand in London and Manchester. France and Spain entice hyperscale projects with tax incentives, though southern grids face capacity shortfalls. The Corporate Sustainability Reporting Directive, effective 2025, forces Scope 3 carbon disclosures.
Asia-Pacific posts the fastest growth. Chinese state-owned utilities back 2 GW campuses despite export-control limits on AI chips. India expands at double-digit rates as foreign hyperscalers localize to meet data-residency rules. Singapore's land scarcity drives 30 kW-plus rack densities with liquid cooling standard. South Korea, Australia, and New Zealand attract edge nodes for gaming and streaming. Japan's aging grid imposes multiyear interconnection delays, nudging demand offshore.
The Middle East and Africa emerge as new hubs. Saudi Arabia's NEOM allocates 1 GW data-center capacity within a USD 500 billion smart-city plan. Dubai and Abu Dhabi offer tax-free zones and expedited permits aimed at intercontinental colocation. Submarine cables linking Europe and Asia elevate Turkey and Israel as low-latency transit nodes. South Africa, Nigeria, and Egypt see edge build-outs tied to 5G rollouts and cloud gaming.
- AECOM
- Turner Construction Co.
- DPR Construction
- Jacobs Solutions Inc.
- Skanska AB
- Balfour Beatty plc
- Whiting-Turner Contracting Co.
- Hensel Phelps
- Fortis Construction Inc.
- Goodman Group
- PT Jaya Obayashi
- Hibiya Engineering Ltd.
- Fluor Corporation
- Keppel Data Centres Holding
- NTT Global Data Centers
- Equinix Inc.
- Digital Realty Trust Inc.
- QTS Realty Trust LLC
- China State Construction Engineering Corp.
- Larsen and Toubro Ltd.
- Bouygues Construction SA
- Vinci Energies
- Samsung C and T Corporation
- Collen Construction Ltd.
- Corgan
- Mortenson Construction
Additional Benefits:
- The market estimate (ME) sheet in Excel format
- 3 months of analyst support
TABLE OF CONTENTS
1 INTRODUCTION
- 1.1 Study Assumptions and Market Definition
- 1.2 Scope of the Study
2 RESEARCH METHODOLOGY
3 EXECUTIVE SUMMARY
4 MARKET LANDSCAPE
- 4.1 Market Overview
- 4.2 Market Drivers
- 4.2.1 Growing Cloud Applications, AI and Big Data Workloads
- 4.2.2 Accelerating Adoption of Hyperscale Facilities
- 4.2.3 Rising Edge-Computing Build-Outs Near Population Hubs
- 4.2.4 Renewable-Energy Mandates Shaping Facility Design
- 4.2.5 Deployment of On-Site Small Modular Reactors (SMRs) to Bypass Grid Constraints
- 4.2.6 Emergence of "Powered-Land" Speculative Campuses Shortening Pre-Lease Timelines
- 4.3 Market Restraints
- 4.3.1 Escalating Real-Estate, Installation and Maintenance Cost
- 4.3.2 Stricter Energy-Consumption and Carbon-Compliance Limits
- 4.3.3 Shortage of Skilled Labor for Advanced Liquid Cooling
- 4.3.4 Utility "Take-or-Pay" Deposits Locking Up Capital and Deterring Mid-Tier Developers
- 4.4 Industry Supply-Chain Analysis
- 4.5 Regulatory Landscape
- 4.6 Technological Outlook
- 4.7 Porter's Five Forces Analysis
- 4.7.1 Bargaining Power of Suppliers
- 4.7.2 Bargaining Power of Consumers
- 4.7.3 Threat of New Entrants
- 4.7.4 Threat of Substitutes
- 4.7.5 Intensity of Competitive Rivalry
- 4.8 Key Data Center Statistics
- 4.8.1 Exhaustive Data Center Operators on Regional Level (in MW)
- 4.8.2 List of Major Upcoming Data Center Projects Across Various Regions(2025-2030)
- 4.8.3 CAPEX and OPEX For Data Center Construction
- 4.8.4 Data Center Power Capacity Absorption In MW, Regions, 2023 and 2024
- 4.9 Artificial Intelligence (AI) Inclusion in Data Center Construction Across Various Regions
- 4.10 Regulatory and Compliance Framework
- 4.11 Impact of Macroeconomic Factors on the Market
5 MARKET SIZE AND GROWTH FORECASTS (VALUE)
- 5.1 By Tier Type
- 5.1.1 Tier 1 and 2
- 5.1.2 Tier 3
- 5.1.3 Tier 4
- 5.2 By Data Center Size
- 5.2.1 Small
- 5.2.2 Medium
- 5.2.3 Large
- 5.2.4 Hyperscale
- 5.3 By Data Center Type
- 5.3.1 Colocation Data Center
- 5.3.2 Hyperscalers/Cloud Service Provider (CSPs)
- 5.3.3 Enterprise and Edge Data Center
- 5.4 By Infrastructure
- 5.4.1 Electrical Infrastructure
- 5.4.1.1 Power Distribution Solution
- 5.4.1.2 Power Backup Solutions
- 5.4.2 Mechanical Infrastructure
- 5.4.2.1 Cooling Systems
- 5.4.2.2 Racks and Cabinets
- 5.4.2.3 Servers and Storage
- 5.4.2.4 Other Mechanical Infrastructure
- 5.4.3 General Construction
- 5.4.4 Services - Design and Consulting, Integration, Support and Maintenance
- 5.4.1 Electrical Infrastructure
- 5.5 By Geography
- 5.5.1 North America
- 5.5.1.1 United States
- 5.5.1.2 Canada
- 5.5.1.3 Mexico
- 5.5.2 South America
- 5.5.2.1 Brazil
- 5.5.2.2 Argentina
- 5.5.2.3 Rest of South America
- 5.5.3 Europe
- 5.5.3.1 Germany
- 5.5.3.2 United Kingdom
- 5.5.3.3 France
- 5.5.3.4 Italy
- 5.5.3.5 Spain
- 5.5.3.6 Rest of Europe
- 5.5.4 Asia-Pacific
- 5.5.4.1 China
- 5.5.4.2 Japan
- 5.5.4.3 India
- 5.5.4.4 South Korea
- 5.5.4.5 Australia and New Zealand
- 5.5.4.6 Rest of Asia-Pacific
- 5.5.5 Middle East and Africa
- 5.5.5.1 Middle East
- 5.5.5.1.1 Gulf Cooperation Countries
- 5.5.5.1.2 Turkey
- 5.5.5.1.3 Israel
- 5.5.5.1.4 Rest of Middle East
- 5.5.5.2 Africa
- 5.5.5.2.1 South Africa
- 5.5.5.2.2 Egypt
- 5.5.5.2.3 Nigeria
- 5.5.5.2.4 Rest of Africa
- 5.5.5.1 Middle East
- 5.5.1 North America
6 COMPETITIVE LANDSCAPE
- 6.1 Market Concentration
- 6.2 Strategic Moves
- 6.3 Market Share Analysis
- 6.4 Data Center Infrastructure Investment Based on Megawatt (MW) Capacity, 2024 vs 2030
- 6.5 Data Center Construction Landscape (Key Vendors Listings)
- 6.6 Company Profiles (includes Global Level Overview, Market Level Overview, Core Segments, Financials as Available, Strategic Information, Market Rank/Share for Key Companies, Products and Services, Recent Developments)
- 6.6.1 AECOM
- 6.6.2 Turner Construction Co.
- 6.6.3 DPR Construction
- 6.6.4 Jacobs Solutions Inc.
- 6.6.5 Skanska AB
- 6.6.6 Balfour Beatty plc
- 6.6.7 Whiting-Turner Contracting Co.
- 6.6.8 Hensel Phelps
- 6.6.9 Fortis Construction Inc.
- 6.6.10 Goodman Group
- 6.6.11 PT Jaya Obayashi
- 6.6.12 Hibiya Engineering Ltd.
- 6.6.13 Fluor Corporation
- 6.6.14 Keppel Data Centres Holding
- 6.6.15 NTT Global Data Centers
- 6.6.16 Equinix Inc.
- 6.6.17 Digital Realty Trust Inc.
- 6.6.18 QTS Realty Trust LLC
- 6.6.19 China State Construction Engineering Corp.
- 6.6.20 Larsen and Toubro Ltd.
- 6.6.21 Bouygues Construction SA
- 6.6.22 Vinci Energies
- 6.6.23 Samsung C and T Corporation
- 6.6.24 Collen Construction Ltd.
- 6.6.25 Corgan
- 6.6.26 Mortenson Construction
- 6.7 List of Data Center Construction Companies
7 MARKET OPPORTUNITIES AND FUTURE OUTLOOK
- 7.1 White-Space and Unmet-Need Assessment
 資料中心建置市場:依資料中心類型、建設形式、等級、組件、建設服務類型及最終用戶產業分類-2026-2032年全球市場預測
 2026年全球資料中心建置市場報告
 全球資料中心建設市場規模、佔有率、趨勢和成長分析報告(2026-2034)
 資料中心建置市場:依層級、建設類型、企業規模、應用與地區分類
 資料中心建置市場分析及預測(至2035年):類型、產品、服務、技術、組件、應用、材料類型、部署模式、最終用戶、設備
 北美資料中心建置:市場佔有率分析、產業趨勢與統計及成長預測(2026-2031 年)
 資料中心建置市場規模、佔有率和趨勢分析報告:按基礎設施、層級、最終用途、地區和細分市場預測(2026-2033 年)
 2026-2030年全球資料中心建置市場新加坡資料中心建置:市場佔有率分析、產業趨勢與統計、成長預測(2026-2031)
 資料中心建置市場報告:按建設類型、資料中心類型、等級標準、產業垂直領域和地區分類(2026-2034 年)