


 |
市場調查報告書
商品編碼
2044274
北美資料中心建置:市場佔有率分析、產業趨勢與統計及成長預測(2026-2031 年)North America Data Center Construction - Market Share Analysis, Industry Trends & Statistics, Growth Forecasts (2026 - 2031) |
||||||
※ 本網頁內容可能與最新版本有所差異。詳細情況請與我們聯繫。
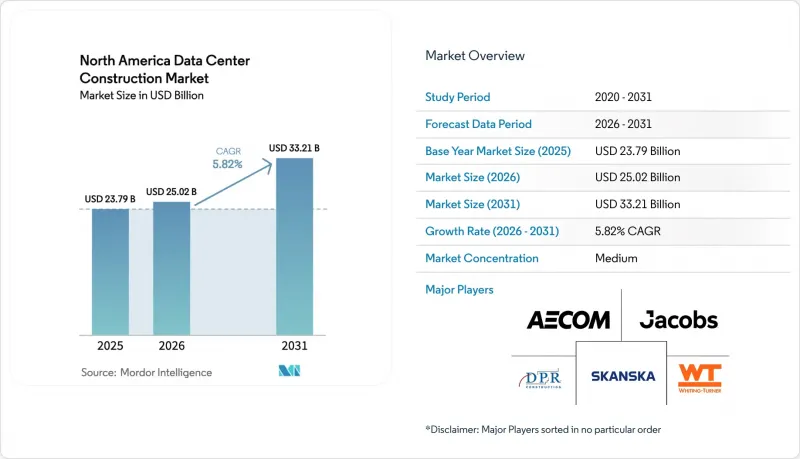
預計到 2025 年,北美資料中心建設市場規模將達到 237.9 億美元,到 2026 年將達到 250.2 億美元,到 2031 年將達到 332.1 億美元,2026 年至 2031 年的複合年成長率為 5.82%。
雲端運算和生成式人工智慧日益成長的工作負載正推動對超大規模園區的投資,這些園區能夠處理100kW或更高的機架密度。同時,接近性風能和太陽能資源可以降低生命週期電力成本,並符合淨零排放承諾。目前變壓器兩年的前置作業時間促使企業提前製定籌資策略,而建築商則轉向預製電氣和冷卻模組,以彌補技術純熟勞工的短缺。競爭優勢的關鍵在於能否在併網等待名單出現之前獲得電網接入,尤其是在維吉尼亞、德克薩斯州和亞利桑那州,這些地區的等待時間已經超過18個月。永續性監管要求正在進一步改變位置方式,原燃煤發電廠正成為首選,因為它們可以與現有的輸電線路和現成的可再生能源購電協議(PPA)相結合。
北美資料中心建置市場趨勢與洞察
雲端運算、人工智慧和巨量資料。
配備超過 16,000 個 Nvidia H100 GPU 的訓練叢集,每個機架的功耗高達 20-100kW,遠超傳統企業資料中心 5-10kW 的功耗。微軟耗資 1000 億美元的「星門」(Stargate)專案凸顯了資料中心向專用園區的轉變,這些園區配備現場變電站和液冷系統,可在晶片級去除伺服器 80% 的熱量。雖然託管機房業主正在維修以提高密度,但許多 Tier 3 型機房(未完工的資料中心設施)無法承受額外的樓層負荷,這加速了電力資源豐富地區的新建設。以人工智慧為中心的成長也在改變設計標準,優先考慮冗餘的中壓電源和 800V 直流骨幹網路。因此,建設成本正在結構性地增加,預計未來幾年北美資料中心建設市場將繼續擴張。
擴大超大規模資料中心的部署
指南針 Data Centers、Center Square 和 Powerhouse 已宣布計劃在 2026 年建成超過 4.8 吉瓦的資料中心。這些數吉瓦級園區將確保從土地購買到試運行的整個過程實現能源自給自足。為了避免美國能源局指出的供應鏈瓶頸問題,這些業者提前兩年訂購了大型變壓器。將場地準備、機電工程和設備安裝整合到單一合約中的專案提供模式,可將工期縮短至多 12 個月。此外,超大規模資料超大規模資料中心業者營運商的進駐也吸引了光纖營運商和可再生能源開發商來到同一地區,從而刺激了區域生態系統的發展,增強了長期需求。這種資本密集的特點是北美資料中心建設市場的主要驅動力。
不斷上漲的電力和房地產成本
預計到2025年,勞登縣的優質土地價格將超過每英畝100萬美元,而ERCOT的批發電力價格年增34%,平均達到每千瓦時8.2美分。 PJM的併網等待名單目前已超過200吉瓦,開發商需要等待長達36個月才能接上電網。不斷上漲的持有成本正在擠壓受2024年之前簽訂的固定價格租賃協議約束的託管企業的利潤空間。許多建築商正在轉向二次性市場,但這些地區的光纖密度通常較低,抵消了土地和電力成本的節省。這些短期限制正在減緩北美資料中心建立市場原本強勁的成長前景。
細分市場分析
隨著金融服務和雲端運算巨頭對99.995%可用性的需求日益成長,預計Tier 4資料中心在預測期內將以6.42%的複合年成長率成長。同時,Tier 3資料中心在2025年仍將保持主導,憑藉其在電子商務和SaaS租戶的運作和預算之間的平衡,佔據北美資料中心建設市場41.64%的佔有率。鋰離子UPS模組可將面積減少40%,使Tier 3業者能夠增加每平方英尺的機架數量。另一方面,Tier 4專案採用旋轉式UPS和雙電源,這增加了土地需求,並縮小了與Tier 3的成本差距。向更高層級的過渡意味著技術複雜性的增加,從而提高了專案的平均價值,並擴大了承包商可以進入的北美資料中心建設市場規模。
在整個預測期內,銀行業和醫療保健行業的法令遵循將推動四級資料中心(Tier 4)的成長超過整體市場複合年成長率(CAGR),而面向邊緣的一級和二級資料中心(Tier 1-2)將繼續為對延遲敏感的服務提供重要支援。持續的配置變更迫使發電機、自動傳輸開關(ATS)和開關設備供應商擴展其產品線,以支援多種冗餘方案。因此,北美資料中心建設產業可望實現服務多元化,從容錯型新建設到模組化二級邊緣資料中心。
到2025年,10至50兆瓦的大型資料中心將佔據54.43%的市場佔有率,而100兆瓦以上的資料中心正以6.76%的複合年成長率快速擴張。一個超大規模資料中心園區佔地200面積,將改變縣級分區規劃,並需要一個獨立的變電站來確保三年的變壓器供應。北美資料中心建設市場規模龐大,目標直指這些大型企劃,遠遠超出傳統企業預算,並吸引了全球EPC(工程、採購和施工)聯合體。然而,建造規模小規模(5兆瓦以下)的資料中心,用於5G邊緣運算和災害復原等功能,仍然至關重要,尤其是在都市區房地產條件限制擴張的地區。
隨著超大規模資料中心營運的成長,營運商正在探索柴油替代方案,這促使人們對熔鹽和氫基備用電源系統產生了濃厚的興趣。同時,模組化供應商正在將可堆疊至10MW的2MW模組標準化,使參與企業無需購買大片土地即可參與競爭。這種兩極化的需求模式確保了北美資料中心建設市場的商業機會均衡發展。
其他好處:
- Excel格式的市場預測(ME)表
- 3個月的分析師支持
目錄
第1章:引言
- 研究假設和市場定義
- 調查範圍
第2章:調查方法
第3章執行摘要
第4章 市場狀況
- 市場概覽
- 宏觀經濟因素對市場的影響
- 市場促進因素
- 雲端應用擴充、人工智慧和巨量資料技術的應用
- 擴大超大規模資料中心的部署
- 5G樞紐周圍對邊緣運算的需求
- 企業永續發展及淨零排放義務
- 已退役燃煤發電廠廠址的剩餘輸電容量
- 美國沿岸地區港口附近人工智慧專用GPU供應鏈的整合
- 市場限制因素
- 不斷上漲的電力和房地產成本
- 熟練的電氣和機械工程師短缺
- 大型電力變壓器的前置作業時間長達數年
- 乾旱地區民眾反對高耗水冷卻系統
- 產業供應鏈分析
- 監理情勢
- 技術展望
- 波特五力分析
- 供應商的議價能力
- 消費者議價能力
- 新進入者的威脅
- 替代品的威脅
- 競爭公司之間的競爭
- 主要資料中心統計數據
- 北美資料中心營運商列表(按兆瓦計)
- 北美即將開展的主要資料中心項目列表
- 北美資料中心建置中的資本支出和營運支出
- 2023年及2024年北美資料中心電力容量吸收量(單位:兆瓦)
- 將人工智慧(AI)引入北美資料中心建設
- 監理與合規框架
- 宏觀經濟因素對市場的影響
第5章 市場規模與成長預測
- 層級類型
- 一級和二級
- Tier 3
- Tier 4
- 按資料中心規模
- 小的
- 中等的
- 大規模
- 超大規模
- 依資料中心類型
- 託管資料中心
- 超大規模資料中心業者雲端服務供應商/雲端服務供應商(CSP)
- 企業和邊緣資料中心
- 透過基礎設施
- 電力基礎設施
- 配電解決方案
- 備用電源解決方案
- 機械基礎設施
- 冷卻系統
- 機架和機櫃
- 伺服器和儲存
- 其他機械基礎設施
- 一般建築
- 服務 - 設計與諮詢、整合、支援與維護
- 電力基礎設施
- 國家
- 美國
- 加拿大
- 墨西哥
第6章 競爭情勢
- 市場集中度
- 策略趨勢
- 市佔率分析
- Data Center Infrastructure Investment Based on Megawatt(MW)Capacity, 2024 vs 2030
- Data Center Construction Landscape(Key Vendors Listings)
- 公司簡介
- AECOM
- Whiting-Turner Contracting Company
- Turner Construction Company
- Jacobs Solutions Inc.
- DPR Construction Inc.
- Skanska USA
- Balfour Beatty US
- Hensel Phelps
- McCarthy Building Companies Inc.
- Gilbane Building Company
- Brasfield and Gorrie LLC
- Holder Construction
- Mortenson Construction
- Fluor Corporation
- Clark Construction Group
- Walsh Construction
- JE Dunn Construction
- Webcor Builders
- Kiewit Corporation
- Layton Construction
- Compass Datacenters
- STACK Infrastructure
- Digital Realty
- Equinix Inc.
- CyrusOne Inc.
- List of Data Center Construction Companies
第7章 市場機會與未來展望
The North America data center construction market size is projected to be USD 23.79 billion in 2025, USD 25.02 billion in 2026, and reach USD 33.21 billion by 2031, growing at a CAGR of 5.82% from 2026 to 2031.
Rising cloud and generative-AI workloads are steering capital toward hyperscale-ready campuses that can support 100+ kW rack densities, while proximity to wind and solar resources lowers lifecycle power costs and aligns with net-zero pledges. Transformer lead times that now stretch to two years are prompting early procurement strategies, and contractors are turning to prefabricated electrical and cooling modules to offset skilled-labor shortages. Competitive advantage hinges on locking in grid access ahead of interconnection queues, especially in Virginia, Texas, and Arizona, where wait times already exceed 18 months. Sustainability mandates are further reshaping site selection, with decommissioned coal sites gaining favor because they pair existing transmission lines with ready-to-sign renewable power purchase agreements.
North America Data Center Construction Market Trends and Insights
Growing Cloud Applications, AI and Big Data Adoption
Training clusters that embed 16,000-plus Nvidia H100 GPUs now draw 20-100 kW per rack, vastly outstripping the 5-10 kW seen in legacy enterprise rooms. Microsoft's USD 100 billion Stargate project underscores a swing toward purpose-built campuses with on-site substations and liquid cooling that removes 80% of server heat at the chip. Colocation landlords are retrofitting for higher densities, yet many Tier 3 shells cannot accommodate the additional floor loading, spurring greenfield builds in power-rich regions. AI-centric growth also shifts design norms, prioritizing redundant medium-voltage feeds and 800-V DC backbones. The net result is a structural uplift in construction spending that keeps the North America data center construction market on a multi-year expansion path.
Rising Hyperscale Data Center Roll-Outs
Compass Datacenters, Centersquare, and PowerHouse collectively unveiled more than 4.8 GW of planned capacity in 2026, banking on multi-gigawatt campuses that ensure self-sufficiency from land purchase through commissioning. These operators are pre-ordering large transformers two years ahead to dodge supply chain bottlenecks flagged by the U.S. Department of Energy. Integrated project delivery combining site prep, MEP build, and equipment installation under one contract is trimming schedules by up to 12 months. Hyperscaler presence also pulls fiber and renewable developers into the same zip codes, catalyzing local ecosystems that reinforce long-term demand. Such capital intensity is a key driver of the North America data center construction market.
Escalating Power and Real-Estate Costs
Prime land in Loudoun County surpassed USD 1 million per acre in 2025 while wholesale power prices in ERCOT averaged 8.2 ¢/kWh, up 34% year-over-year. Lengthy PJM interconnection queues now top 200 GW, forcing developers to wait as long as 36 months before tapping the grid. Higher carrying costs erode colocation margins locked into fixed-price leases inked before 2024. Many builders are shifting toward secondary markets, but these areas often lack dense fiber routes, offsetting the savings in land and electricity. The near-term squeeze tempers the otherwise solid growth profile of the North America data center construction market.
Other drivers and restraints analyzed in the detailed report include:
- Edge-Computing Demand Near 5G Hubs
- Corporate Sustainability and Net-Zero Mandates
- Skilled Electrical and Mechanical Labor Shortage
For complete list of drivers and restraints, kindly check the Table Of Contents.
Segment Analysis
Tier 4 is expected to grow at a CAGR of 6.42% during the forecast period, as financial services and cloud giants demanded 99.995% availability. Tier 3 still led in 2025 with 41.64% of the North America data center construction market share, balancing uptime and budget for e-commerce and SaaS tenants. Lithium-ion UPS modules now cut footprint 40%, letting Tier 3 operators squeeze more revenue racks per square foot. Tier 4 projects, meanwhile, adopt rotary UPS and dual utility feeds, which increase land requirements but narrow the cost premium over Tier 3. The move toward higher tiers injects engineering complexity that raises average project value, expanding the North America data center construction market pool available to contractors.
Across the forecast horizon, banking and healthcare compliance rules will keep Tier 4 growth above the headline CAGR, while edge-oriented Tier 1-2 sites persist for latency-sensitive services. The ongoing mix shift encourages vendors of generators, ATS, and switchgear to broaden product lines for multiple redundancy schemes. Consequently, the North America data center construction industry is poised to diversify its service stack, from fault-tolerant new builds to modular Tier 2 edge pods.
Large facilities between 10 and 50 MW secured 54.43% share in 2025; however, sites exceeding 100 MW are scaling at a 6.76% CAGR. A single hyperscale campus can absorb 200 acres, altering county zoning patterns and requiring separate substations that lock up three years of transformer supply. The North America data center construction market size for these mega-projects dwarfs traditional enterprise budgets, attracting global EPC consortia. Yet small (sub-5 MW) builds remain vital for 5G edge and disaster-recovery roles, especially where urban real estate limits expansion.
Hyperscale growth is spurring molten-salt and hydrogen-ready backup systems as operators hunt for diesel alternatives. Simultaneously, modular suppliers are standardizing 2-MW blocks that stack to 10 MW, allowing medium-size entrants to compete without buying vast tracts of land. This bimodal demand pattern ensures balanced opportunity across the North America data center construction market.
The North America Data Center Construction Market Report is Segmented by Tier Type (Tier 1, Tier 2, Tier 3, and Tier 4), Data Center Type (Colocation, Hyperscalers/Cloud Service Providers, and Enterprise and Edge Data Center), Infrastructure (Electrical Infrastructure, General Construction, and More), Data Center Size (Small, Medium, Large, and Hyperscale), and Country. The Market Forecasts are Provided in Terms of Value (USD).
List of Companies Covered in this Report:
- AECOM
- Whiting-Turner Contracting Company
- Turner Construction Company
- Jacobs Solutions Inc.
- DPR Construction Inc.
- Skanska USA
- Balfour Beatty US
- Hensel Phelps
- McCarthy Building Companies Inc.
- Gilbane Building Company
- Brasfield and Gorrie LLC
- Holder Construction
- Mortenson Construction
- Fluor Corporation
- Clark Construction Group
- Walsh Construction
- JE Dunn Construction
- Webcor Builders
- Kiewit Corporation
- Layton Construction
- Compass Datacenters
- STACK Infrastructure
- Digital Realty
- Equinix Inc.
- CyrusOne Inc.
Additional Benefits:
- The market estimate (ME) sheet in Excel format
- 3 months of analyst support
TABLE OF CONTENTS
1 INTRODUCTION
- 1.1 Study Assumptions and Market Definition
- 1.2 Scope of the Study
2 RESEARCH METHODOLOGY
3 EXECUTIVE SUMMARY
4 MARKET LANDSCAPE
- 4.1 Market Overview
- 4.2 Impact of Macroeconomic Factors on the Market
- 4.3 Market Drivers
- 4.3.1 Growing Cloud Applications, AI and Big Data Adoption
- 4.3.2 Rising Hyperscale Data Center Roll-Outs
- 4.3.3 Edge-Computing Demand Near 5G Hubs
- 4.3.4 Corporate Sustainability and Net-Zero Mandates
- 4.3.5 Surplus Grid Capacity in Decommissioned Coal Plant Sites
- 4.3.6 AI-Specific GPU Supply-Chain Clustering Near US Gulf Ports
- 4.4 Market Restraints
- 4.4.1 Escalating Power and Real-Estate Costs
- 4.4.2 Skilled Electrical and Mechanical Labor Shortage
- 4.4.3 Multi-Year Lead Times for Large Power Transformers
- 4.4.4 Community Opposition to High-Water-Use Cooling Systems in Arid States
- 4.5 Industry Supply-Chain Analysis
- 4.6 Regulatory Landscape
- 4.7 Technological Outlook
- 4.8 Porter's Five Forces Analysis
- 4.8.1 Bargaining Power of Suppliers
- 4.8.2 Bargaining Power of Consumers
- 4.8.3 Threat of New Entrants
- 4.8.4 Threat of Substitutes
- 4.8.5 Intensity of Competitive Rivalry
- 4.9 Key Data Center Statistics
- 4.9.1 Exhaustive Data Center Operators in North America (in MW)
- 4.9.2 List of Major Upcoming Data Center Projects in North America
- 4.9.3 CAPEX and OPEX For North America Data Center Construction
- 4.9.4 Data Center Power Capacity Absorption In MW, North America, 2023 and 2024
- 4.10 Artificial Intelligence (AI) Inclusion in Data Center Construction in North America
- 4.11 Regulatory and Compliance Framework
- 4.12 Impact of Macroeconomic Factors on the Market
5 MARKET SIZE AND GROWTH FORECASTS (VALUE)
- 5.1 By Tier Type
- 5.1.1 Tier 1 and 2
- 5.1.2 Tier 3
- 5.1.3 Tier 4
- 5.2 By Data Center Size
- 5.2.1 Small
- 5.2.2 Medium
- 5.2.3 Large
- 5.2.4 Hyperscale
- 5.3 By Data Center Type
- 5.3.1 Colocation Data Center
- 5.3.2 Hyperscalers/Cloud Service Provider (CSPs)
- 5.3.3 Enterprise and Edge Data Center
- 5.4 By Infrastructure
- 5.4.1 Electrical Infrastructure
- 5.4.1.1 Power Distribution Solution
- 5.4.1.2 Power Backup Solutions
- 5.4.2 Mechanical Infrastructure
- 5.4.2.1 Cooling Systems
- 5.4.2.2 Racks and Cabinets
- 5.4.2.3 Servers and Storage
- 5.4.2.4 Other Mechanical Infrastructure
- 5.4.3 General Construction
- 5.4.4 Services - Design and Consulting, Integration, Support and Maintenance
- 5.4.1 Electrical Infrastructure
- 5.5 By Country
- 5.5.1 United States
- 5.5.2 Canada
- 5.5.3 Mexico
6 COMPETITIVE LANDSCAPE
- 6.1 Market Concentration
- 6.2 Strategic Moves
- 6.3 Market Share Analysis
- 6.4 Data Center Infrastructure Investment Based on Megawatt (MW) Capacity, 2024 vs 2030
- 6.5 Data Center Construction Landscape (Key Vendors Listings)
- 6.6 Company Profiles (Includes Global Level Overview, Market Level Overview, Core Segments, Financials as Available, Strategic Information, Market Rank/Share for Key Companies, Products and Services, Recent Developments)
- 6.6.1 AECOM
- 6.6.2 Whiting-Turner Contracting Company
- 6.6.3 Turner Construction Company
- 6.6.4 Jacobs Solutions Inc.
- 6.6.5 DPR Construction Inc.
- 6.6.6 Skanska USA
- 6.6.7 Balfour Beatty US
- 6.6.8 Hensel Phelps
- 6.6.9 McCarthy Building Companies Inc.
- 6.6.10 Gilbane Building Company
- 6.6.11 Brasfield and Gorrie LLC
- 6.6.12 Holder Construction
- 6.6.13 Mortenson Construction
- 6.6.14 Fluor Corporation
- 6.6.15 Clark Construction Group
- 6.6.16 Walsh Construction
- 6.6.17 JE Dunn Construction
- 6.6.18 Webcor Builders
- 6.6.19 Kiewit Corporation
- 6.6.20 Layton Construction
- 6.6.21 Compass Datacenters
- 6.6.22 STACK Infrastructure
- 6.6.23 Digital Realty
- 6.6.24 Equinix Inc.
- 6.6.25 CyrusOne Inc.
- 6.7 List of Data Center Construction Companies
7 MARKET OPPORTUNITIES AND FUTURE OUTLOOK
- 7.1 White-Space and Unmet-Need Assessment
 資料中心建置市場:2026-2032年全球市場預測(按資料中心類型、基礎設施組件、建置類型、等級、電力容量區域和最終用戶分類)
 印尼資料中心建置:市場佔有率分析、產業趨勢與統計及成長預測(2026-2031)資料中心建置:市場佔有率分析、產業趨勢與統計、成長預測(2026-2031)
 2026年全球資料中心建置市場報告
 全球資料中心建設市場規模、佔有率、趨勢和成長分析報告(2026-2034)
 資料中心建置市場:依層級、建設類型、企業規模、應用與地區分類
 資料中心建置市場規模、佔有率和趨勢分析報告:按基礎設施、層級、最終用途、地區和細分市場預測(2026-2033 年)
 2026-2030年全球資料中心建置市場新加坡資料中心建置:市場佔有率分析、產業趨勢與統計、成長預測(2026-2031)
 資料中心建置市場報告:按建設類型、資料中心類型、等級標準、產業垂直領域和地區分類(2026-2034 年)