


 |
市場調查報告書
商品編碼
2065773
Kubernetes:市場佔有率分析、產業趨勢與統計、成長預測(2026-2031)Kubernetes - Market Share Analysis, Industry Trends & Statistics, Growth Forecasts (2026 - 2031) |
||||||
※ 本網頁內容可能與最新版本有所差異。詳細情況請與我們聯繫。
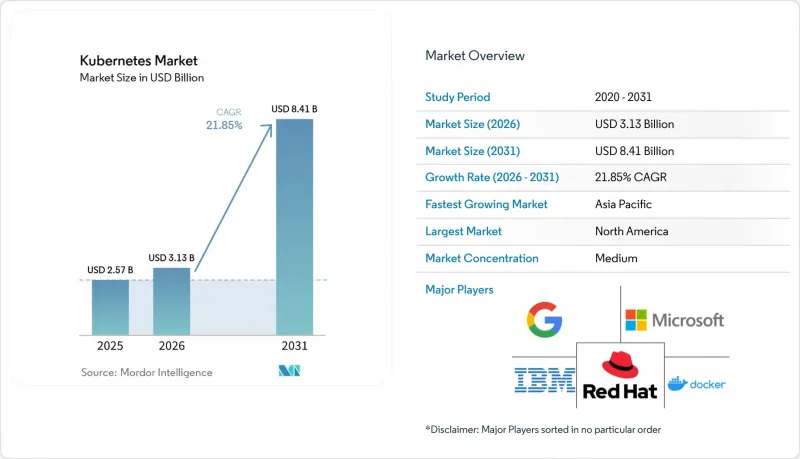
根據 Mordor Intelligence 預測,Kubernetes 市場規模將從 2025 年的 25.7 億美元成長到 2026 年的 31.3 億美元,然後在 2031 年達到 84.1 億美元,2026 年至 2031 年的複合年成長率為 21.85%。
本報告按組件(解決方案和服務)、部署模式(自託管 Kubernetes 和託管 Kubernetes)、組織規模(中小企業和大型企業)、最終用戶行業(銀行、金融和保險 (BFSI)、醫療保健及其他)以及地區進行細分。市場預測以美元 (USD) 為單位。
全球 Kubernetes 市場趨勢與洞察
微服務的興起
企業正在拆解單體系統,轉向規模小規模、可獨立部署的服務,這些服務需要高階編配,而 Kubernetes 正好能勝任這個角色。 80% 的企業計劃在未來五年內,將大部分新應用程式建置在雲端原生架構之上。諸如 Sidecar、Ambassador 和 Adaptor 等專用設計模式正逐漸成為主流,從而提升模組化和可維護性。隨著這種設計轉變的推進,Kubernetes 市場正成為縮短發布週期、提升業務敏捷性的策略基礎,並正在改變各行業的平台工程優先級。
擴大人工智慧和機器學習工作負載的應用
運算密集型人工智慧舉措受益於 Kubernetes 的許多特性,例如自動節點擴展、GPU 調度和服務容錯。超過一半的受訪公司已在 Kubernetes叢集上運行人工智慧/機器學習工作負載。 Kubeflow 等產業專用的工具正在簡化模型訓練流程,而Google、位元組跳動和紅帽的聯合專案則針對大規模語言模型推理最佳化了負載平衡和模型伺服器效能。因此,人工智慧基礎設施的範圍正在不斷擴大,Kubernetes 市場也在蓬勃發展。
熟練人員短缺
專業人才依然稀缺,37% 的 IT 領導者表示 DevOps 和 DevSecOps 領域整體技能缺口。陡峭的學習曲線促使企業建立專門的平台工程團隊,並增加對自動化的投資。此外,企業正在對先前依賴傳統虛擬化技術的工作負載進行現代化改造,同時依靠託管服務供應商來彌補專業知識缺口。
細分市場分析
預計到 2025 年,Kubernetes 解決方案仍將佔據最大佔有率,達到 55.40%,其中包括核心發行版和管理附加元件。同時,隨著企業尋求遷移藍圖、效能調優和持續合規性的建議,服務領域正以 23.3% 的複合年成長率快速成長。越來越多的諮詢項目專注於醫療保健、金融和電信等垂直行業的用例,這些行業的管治要求嚴格,停機時間不可接受。隨著認證計劃和特定領域框架吸引新的整合商,預計到 2031 年,Kubernetes 服務市場規模將成長一倍以上。
這一激增也反映出 Kubernetes 的功能集與維運專業知識之間日益成長的複雜性。據 Cloud4C 稱,59% 的用戶表示合規性是他們面臨的最大挑戰,這推動了對專業審計和糾正服務的需求。託管式 Kubernetes 訂閱透過將 SLA 履行和升級鏈外包給供應商,進一步加速了其普及,這一趨勢尤其能引起資源受限、尋求可預測成本框架的團隊的共鳴。
以超大規模資料中心業者服務商提供的託管 Kubernetes 服務為主導的託管服務佔據主導地位,佔當前支出的 62.30%。目前成長主要集中在支援多重雲端的託管服務上,預計將以 22.4% 的複合年成長率成長。為了平衡延遲、主權和成本,企業正在將工作負載分佈在 AWS、Azure、Google Cloud 和本地資產上,並利用 Kubernetes 作為策略和部署中立的層。隨著企業擺脫單一供應商的束縛並追求資源利用率最佳化,面向多重雲端部署的 Kubernetes 市場競爭將進一步加劇。
對於具有特殊安全需求或需要與大型主機整合的企業而言,自託管叢集仍然至關重要。混合模式為團隊提供了一個過渡方案,使他們能夠在內部容器化關鍵應用程式,同時將尖峰負載擴展到公共雲端。工具供應商正在部署單面板儀表板、GitOps 管線和策略引擎,這些工具可以消除雲端之間的差異,從而降低運維開銷並擴大 Kubernetes 市場。
區域分析
到 2025 年,北美將佔全球整體收入的 36.40%,其中美國是核心,擁有全球超過一半的 Kubernetes 用戶。超大規模雲端部署、早期採用者以及活躍的開發團體支撐著該地區的領先地位。人工智慧驅動的工作負載,尤其是在金融和零售業,正在加速 Kubernetes 的普及,而行業特定法規(如 HIPAA、FISMA 等)的多樣性則推動了對安全自動化和策略閘道器的投資。該地區的市場參與企業擴大採用多重雲端藍圖,Kubernetes 正在成為支援工作負載可攜性的通用基礎架構。
亞太地區是成長最快的地區,預計2026年至2031年複合年成長率將達22.6%。推動這一成長的因素包括中國、印度和日本的數位化進程加快、5G網路的部署以及雲端資料中心的擴張。 CAST AI進軍印度市場正是該地區供應商強勁發展動能的典型例子。阿里雲等國內主要企業正透過推廣符合本地合規要求的客製化Kubernetes堆疊來維持這一成長動能。製造業(智慧工廠、供應鏈遙測等)的應用案例也進一步推動了Kubernetes市場的擴張。
歐洲佔據了顯著的市場佔有率,這得益於其為應對 GDPR 而增加的安全投入以及強大的開放原始碼文化。德國、英國和法國的企業正著力採用混合架構,以平衡系統主權和敏捷性。 Kubernetes 在銀行業和電信業的應用正在推動關鍵任務系統的現代化。包括雲端原生運算基金會 (CNCF) 的聚會和程式碼活動在內的社群協作,正在培育強大的貢獻者群體,並增強企業信心。中東、非洲和南美洲等新興中心也正在穩步推進 Kubernetes 的應用,儘管規模較小,但隨著區域最佳化的雲端可用區投入運作,Kubernetes 的全球市場佔有率正在進一步擴大。
其他好處:
- Excel格式的市場預測(ME)表
- 3個月的分析師支持
目錄
第1章:引言
- 研究假設和市場定義
- 調查範圍
第2章:調查方法
第3章執行摘要
第4章 市場狀況
- 市場概覽
- 市場促進因素
- 微服務的出現
- 擴大人工智慧和機器學習工作負載的應用
- 對託管 Kubernetes 服務的需求不斷成長
- 擴展混合雲和多重雲端策略
- 使用輕量級 K8s 發行版部署邊緣運算
- 透過 Kubernetes 原生 FinOps 自動化降低整體擁有成本
- 市場限制因素
- 熟練人員短缺
- 安全和合規的複雜性
- 自動伸縮控制平面成本增加
- 超大規模資料中心業者的壟斷地位阻礙了開源軟體的商業化。
- 主要監理情勢
- 北美洲
- HIPAA
- FISMA
- CIS Kubernetes 基準測試
- PIPEDA
- 歐洲
- GDPR
- 亞太地區
- 中國的網路安全法
- 印度的DPDP法
- CERT-In 指南
- IRAP(澳洲)
- 南美洲
- 巴西 LGPD
- 墨西哥聯邦個人資料保護法
- 中東和非洲
- 阿拉伯聯合大公國DP法
- 杜拜ESC指南
- 沙烏地阿拉伯的CCRF
- 北美洲
- 產業生態系分析
- 宏觀經濟因素的影響
- 關鍵用例評估
- 應用程式的大規模部署
- 高效能運算
- 人工智慧和機器學習工作負載
- 混合雲端和多重雲端部署
- 其他新用例
- 參與企業市場的案例研究
- 華為 - 內部 IT編配
- PayPal-專注於速度的容器管理
- 其他案例研究
- 價值供應鏈分析
- 技術展望
- 波特五力模型
第5章 市場規模與成長預測
- 按組件
- 解決方案
- 服務
- 託管服務
- 諮詢和支援服務
- 按部署模式
- 自託管 Kubernetes
- 現場
- 混合
- 託管 Kubernetes
- 基於雲端的管理
- 多重雲端管理
- 自託管 Kubernetes
- 按組織規模
- 中小企業
- 大公司
- 按最終用戶行業分類
- 銀行、金融服務和保險(BFSI)
- 衛生保健
- 媒體與娛樂
- 資訊科技(IT)和通訊
- 製造業
- 零售
- 政府/公共部門
- 其他行業
- 按地區
- 北美洲
- 美國
- 加拿大
- 墨西哥
- 歐洲
- 德國
- 英國
- 法國
- 義大利
- 西班牙
- 俄羅斯
- 其他歐洲國家
- 亞太地區
- 中國
- 日本
- 印度
- 韓國
- 澳洲和紐西蘭
- 東南亞
- 其他亞太國家
- 南美洲
- 巴西
- 阿根廷
- 其他南美國家
- 中東和非洲
- 中東
- 沙烏地阿拉伯
- 阿拉伯聯合大公國
- 土耳其
- 其他中東國家
- 非洲
- 南非
- 其他非洲國家
- 中東
- 北美洲
第6章 競爭情勢
- 市場集中度
- 策略趨勢
- 市佔率分析
- 公司簡介
- Google LLC
- Microsoft Corporation
- Amazon Web Services, Inc.
- Red Hat, Inc.(IBM)
- IBM Corporation
- VMware, Inc.
- Oracle Corporation
- SUSE(Rancher Labs)
- Cisco Systems, Inc.
- Alibaba Cloud
- Tencent Cloud
- Huawei Technologies Co., Ltd.
- DigitalOcean, LLC
- Mirantis, Inc.
- Platform9 Systems, Inc.
- Fairwinds
- Nutanix, Inc.
- Docker, Inc.
- Canonical Ltd.
- Ionos SE
- KubeSphere(QingCloud)
- Spectro Cloud
- Weaveworks
- HashiCorp
- Portainer.io
第7章 市場機會與未來展望
According to Mordor Intelligence, the kubernetes market size is expected to grow from USD 2.57 billion in 2025 to USD 3.13 billion in 2026 and is forecast to reach USD 8.41 billion by 2031 at 21.85% CAGR over 2026-2031.
This report is Segmented by Component (Solutions and Services), Deployment Model (Self-Hosted Kubernetes and Managed Kubernetes), Organization Size (Small and Medium-Sized Enterprises (SMEs) and Large Enterprises), End User Vertical (Banking, Financial Services, and Insurance (BFSI), Healthcare, and More), and Geography. The Market Forecasts are Provided in Terms of Value (USD).
Global Kubernetes Market Trends and Insights
Advent of Microservices
Organizations are dismantling monoliths in favor of smaller, independently deployable services that demand sophisticated orchestration, and Kubernetes excels at that role. Eighty percent of enterprises plan to build most new applications on cloud-native stacks within five years. Purpose-built design patterns such as sidecar, ambassador, and adapter are mainstream, improving modularity and maintainability. As this design shift continues, the Kubernetes market becomes a strategic backbone for faster release cycles and business agility, transforming platform-engineering priorities across industries.
Increased Adoption of AI and ML Workloads
Compute-intensive AI initiatives benefit from Kubernetes functions such as node autoscaling, GPU scheduling, and service resilience. More than half of surveyed enterprises already run AI/ML workloads in Kubernetes clusters. Sector-specific tools like Kubeflow streamline model training, while a Google, ByteDance, Red Hat collaboration has optimized load balancing and model-server performance for large-language-model inference. The result is a wider addressable base for AI-ready infrastructure and an expanding Kubernetes market.
Lack of Skilled Talent Pool
Specialized know-how remains scarce as 37% of IT leaders report a skills gap across DevOps and DevSecOps. The steep learning curve fuels the rise of dedicated platform-engineering teams and encourages investment in automation. Enterprises also lean on managed service providers to bridge expertise gaps while modernizing workloads previously tied to legacy virtualization stacks.
Other drivers and restraints analyzed in the detailed report include:
- Growing Demand for Managed Kubernetes Services
- Expansion of Hybrid and Multi-Cloud Strategies
- Security and Compliance Complexities
For complete list of drivers and restraints, kindly check the Table Of Contents.
Segment Analysis
Solutions still form the largest slice at 55.40% of the Kubernetes market in 2025, covering core distributions and management add-ons. The Services arm, however, is advancing at a 23.3% CAGR as enterprises seek migration blueprints, performance tuning, and continuous compliance advice. A rising number of consulting engagements focus on vertical use-cases-healthcare, finance, telecommunications - where governance requirements are strict and downtime is intolerable. The Kubernetes market for services is expected to more than double by 2031 as certification programs and domain-specific frameworks attract new integrators.
The surge also reflects widening complexity between Kubernetes feature sets and operator know-how. Cloud4C notes that 59% of adopters deem compliance their chief pain point, creating a pull for specialized audit and remediation services. Managed Kubernetes subscriptions further accelerate consumption by shifting SLA enforcement and upgrade chains to vendors, a pattern especially resonant with resource-constrained teams wanting predictable cost envelopes.
Managed offerings dominate with 62.30% of current spend, underpinned by the hyperscalers' managed Kubernetes services. Growth now clusters around multi-cloud managed variants, projected to climb at 22.4% CAGR. Organizations balancing latency, sovereignty, and spending spread workloads across AWS, Azure, Google Cloud, and on-premises assets, turning Kubernetes into the neutrality layer for policy and placement. Kubernetes market for multi-cloud deployments is reinforced as enterprises insist on avoiding single-provider lock-in and pursue optimized utilization.
Self-hosted clusters retain relevance among firms with bespoke security mandates or mainframe adjacency. Hybrid models serve as stepping-stones, letting teams containerize critical applications internally while bursting peaks to public clouds. Tool vendors are rolling out single-pane dashboards, GitOps pipelines, and policy engines that abstract differences among clouds, a move that compresses operational overhead and widens the Kubernetes market.
Geography Analysis
North America secured 36.40% of global revenue in 2025, anchored by the United States, which accounts for more than half of Kubernetes users worldwide. Hyperscale cloud footprints, early-mover enterprises, and deep developer communities sustain regional leadership. AI-infused workloads, especially in finance and retail, intensify Kubernetes adoption, and a patchwork of sectoral regulations (HIPAA, FISMA) spurs investment in security automation and policy gateways. Market participants here increasingly deploy multi-cloud blueprints, making Kubernetes the universal substrate for workload portability.
Asia-Pacific is the fastest-growing region with a 22.6% CAGR forecast for 2026-2031. Widespread digitization, 5G buildouts, and cloud data-center expansion in China, India, and Japan ignite demand. CAST AI's move into India exemplifies provider momentum in the region. Domestic giants such as Alibaba Cloud promote tailored Kubernetes stacks that satisfy local compliance, sustaining momentum. Manufacturing use-cases-smart factories, supply-chain telemetry-further contribute to the Kubernetes market expansion.
Europe commands a substantial slice, buoyed by GDPR-focused security spending and strong open-source culture. Enterprises in Germany, the United Kingdom, and France emphasize hybrid architectures to balance sovereignty and agility. Kubernetes adoption inside the banking and telco segments supports core system modernization. Community collaboration, including Cloud Native Computing Foundation (CNCF) meetups and code events, nurtures a robust contributor base that accelerates enterprise trust. Emerging hubs in the Middle East and Africa and South America, while smaller, display steady uptake as localized cloud availability zones come online, further widening the global Kubernetes market footprint.
- Google LLC
- Microsoft Corporation
- Amazon Web Services, Inc.
- Red Hat, Inc. (IBM)
- IBM Corporation
- VMware, Inc.
- Oracle Corporation
- SUSE (Rancher Labs)
- Cisco Systems, Inc.
- Alibaba Cloud
- Tencent Cloud
- Huawei Technologies Co., Ltd.
- DigitalOcean, LLC
- Mirantis, Inc.
- Platform9 Systems, Inc.
- Fairwinds
- Nutanix, Inc.
- Docker, Inc.
- Canonical Ltd.
- Ionos SE
- KubeSphere (QingCloud)
- Spectro Cloud
- Weaveworks
- HashiCorp
- Portainer.io
Additional Benefits:
- The market estimate (ME) sheet in Excel format
- 3 months of analyst support
TABLE OF CONTENTS
1 INTRODUCTION
- 1.1 Study Assumptions and Market Definition
- 1.2 Scope of the Study
2 RESEARCH METHODOLOGY
3 EXECUTIVE SUMMARY
4 MARKET LANDSCAPE
- 4.1 Market Overview
- 4.2 Market Drivers
- 4.2.1 Advent of Microservices
- 4.2.2 Increased Adoption of AI and ML Workloads
- 4.2.3 Growing Demand for Managed Kubernetes Services
- 4.2.4 Expansion of Hybrid and Multi-Cloud Strategies
- 4.2.5 Edge-Computing Adoption with Lightweight K8s Distros
- 4.2.6 Kubernetes-native FinOps Automation Reducing TCO
- 4.3 Market Restraints
- 4.3.1 Lack of Skilled Talent Pool
- 4.3.2 Security and Compliance Complexities
- 4.3.3 Control-Plane Cost Escalation under Autoscaling
- 4.3.4 Hyperscaler Dominance Limits OSS Monetisation
- 4.4 Key Regulatory Landscape
- 4.4.1 North America
- 4.4.1.1 HIPAA
- 4.4.1.2 FISMA
- 4.4.1.3 CIS Kubernetes Benchmark
- 4.4.1.4 PIPEDA
- 4.4.2 Europe
- 4.4.2.1 GDPR
- 4.4.3 Asia-Pacific
- 4.4.3.1 China Cybersecurity Law
- 4.4.3.2 India DPDP Act
- 4.4.3.3 CERT-In Guidelines
- 4.4.3.4 IRAP (Australia)
- 4.4.4 South America
- 4.4.4.1 LGPD - Brazil
- 4.4.4.2 Mexico Federal DP Law
- 4.4.5 Middle East and Africa
- 4.4.5.1 UAE DP Law
- 4.4.5.2 Dubai ESC Guidelines
- 4.4.5.3 Saudi CCRF
- 4.4.1 North America
- 4.5 Industry Ecosystem Analysis
- 4.6 Impact of Macro-Economic Factors
- 4.7 Assessment of Key Use Cases
- 4.7.1 Large-Scale Application Deployment
- 4.7.2 High-Performance Computing
- 4.7.3 AI and ML Workloads
- 4.7.4 Hybrid and Multi-Cloud Deployments
- 4.7.5 Other Emerging Use Cases
- 4.8 Market Player Case Studies
- 4.8.1 Huawei - Internal IT Orchestration
- 4.8.2 PayPal - Container Management for Speed
- 4.8.3 Additional Case Studies
- 4.9 Value / Supply-Chain Analysis
- 4.10 Technological Outlook
- 4.11 Porter's Five Forces
- 4.11.1 Threat of New Entrants
- 4.11.2 Bargaining Power of Suppliers
- 4.11.3 Bargaining Power of Buyers
- 4.11.4 Threat of Substitutes
- 4.11.5 Competitive Rivalry
5 MARKET SIZE AND GROWTH FORECASTS (VALUES)
- 5.1 By Component
- 5.1.1 Solutions
- 5.1.2 Services
- 5.1.2.1 Managed Services
- 5.1.2.2 Consulting and Support Services
- 5.2 By Deployment Model
- 5.2.1 Self-Hosted Kubernetes
- 5.2.1.1 On-Premise
- 5.2.1.2 Hybrid
- 5.2.2 Managed Kubernetes
- 5.2.2.1 Cloud-based Managed
- 5.2.2.2 Multi-Cloud Managed
- 5.2.1 Self-Hosted Kubernetes
- 5.3 By Organization Size
- 5.3.1 Small and Medium-Sized Enterprises (SMEs)
- 5.3.2 Large Enterprises
- 5.4 By End-User Vertical
- 5.4.1 Banking, Financial Services, and Insurance (BFSI)
- 5.4.2 Healthcare
- 5.4.3 Media and Entertainment
- 5.4.4 Information Technology (IT) and Telecom
- 5.4.5 Manufacturing
- 5.4.6 Retail
- 5.4.7 Government and Public Sector
- 5.4.8 Other Verticals
- 5.5 By Geography
- 5.5.1 North America
- 5.5.1.1 United States
- 5.5.1.2 Canada
- 5.5.1.3 Mexico
- 5.5.2 Europe
- 5.5.2.1 Germany
- 5.5.2.2 United Kingdom
- 5.5.2.3 France
- 5.5.2.4 Italy
- 5.5.2.5 Spain
- 5.5.2.6 Russia
- 5.5.2.7 Rest of Europe
- 5.5.3 Asia-Pacific
- 5.5.3.1 China
- 5.5.3.2 Japan
- 5.5.3.3 India
- 5.5.3.4 South Korea
- 5.5.3.5 Australia and New Zealand
- 5.5.3.6 Southeast Asia
- 5.5.3.7 Rest of Asia-Pacific
- 5.5.4 South America
- 5.5.4.1 Brazil
- 5.5.4.2 Argentina
- 5.5.4.3 Rest of South America
- 5.5.5 Middle East and Africa
- 5.5.5.1 Middle East
- 5.5.5.1.1 Saudi Arabia
- 5.5.5.1.2 United Arab Emirates
- 5.5.5.1.3 Turkey
- 5.5.5.1.4 Rest of Middle East
- 5.5.5.2 Africa
- 5.5.5.2.1 South Africa
- 5.5.5.2.2 Rest of Africa
- 5.5.5.1 Middle East
- 5.5.1 North America
6 COMPETITIVE LANDSCAPE
- 6.1 Market Concentration
- 6.2 Strategic Moves
- 6.3 Market Share Analysis
- 6.4 Company Profiles (includes Global level Overview, Market level overview, Core Segments, Financials as available, Strategic Information, Market Rank/Share, Products and Services, Recent Developments)
- 6.4.1 Google LLC
- 6.4.2 Microsoft Corporation
- 6.4.3 Amazon Web Services, Inc.
- 6.4.4 Red Hat, Inc. (IBM)
- 6.4.5 IBM Corporation
- 6.4.6 VMware, Inc.
- 6.4.7 Oracle Corporation
- 6.4.8 SUSE (Rancher Labs)
- 6.4.9 Cisco Systems, Inc.
- 6.4.10 Alibaba Cloud
- 6.4.11 Tencent Cloud
- 6.4.12 Huawei Technologies Co., Ltd.
- 6.4.13 DigitalOcean, LLC
- 6.4.14 Mirantis, Inc.
- 6.4.15 Platform9 Systems, Inc.
- 6.4.16 Fairwinds
- 6.4.17 Nutanix, Inc.
- 6.4.18 Docker, Inc.
- 6.4.19 Canonical Ltd.
- 6.4.20 Ionos SE
- 6.4.21 KubeSphere (QingCloud)
- 6.4.22 Spectro Cloud
- 6.4.23 Weaveworks
- 6.4.24 HashiCorp
- 6.4.25 Portainer.io
7 MARKET OPPORTUNITIES AND FUTURE OUTLOOK
- 7.1 White-space and Unmet Need Analysis
 南美洲綠色IT軟體:市場佔有率分析、產業趨勢與統計及成長預測(2026-2031年)德國綠色IT軟體:市場佔有率分析、產業趨勢與統計及成長預測(2026-2031年)無紙化企業和數位化流程永續性軟體:市場佔有率分析、產業趨勢和統計數據以及成長預測(2026-2031 年)
 雲端應用安全市場:按組件、部署模式、最終用戶產業和企業規模分類-2026-2032年全球市場預測
 容器和 Kubernetes 安全市場報告:按組件、產品、組織規模、行業垂直領域和地區分類(2026-2034 年)
 Kubernetes市場規模、佔有率和成長分析(按組件、產品、組織規模、垂直產業和地區分類)-2026-2033年產業預測
 雲端應用安全市場規模、佔有率和成長分析(按類型、組件、組織規模、部署類型、垂直產業和地區分類)-2026-2033年產業預測
 全球 Kubernetes 市場
 2026 年至 2032 年容器和 Kubernetes 安全市場(按產品、組織規模、垂直產業和地區分類)