


 |
市場調查報告書
商品編碼
2065434
GPU和HPC用矽中介層:市場佔有率分析、產業趨勢與統計數據以及成長預測(2026-2031年)GPU And HPC Silicon Interposer - Market Share Analysis, Industry Trends & Statistics, Growth Forecasts (2026 - 2031) |
||||||

※ 本網頁內容可能與最新版本有所差異。詳細情況請與我們聯繫。
預計用於 GPU 和 HPC 的矽中介層的市場規模將從 2025 年的 23.2 億美元成長到 2026 年的 29.4 億美元,到 2031 年將達到 75.4 億美元,2026 年至 2031 年的複合年預計成長率為 26.58%。
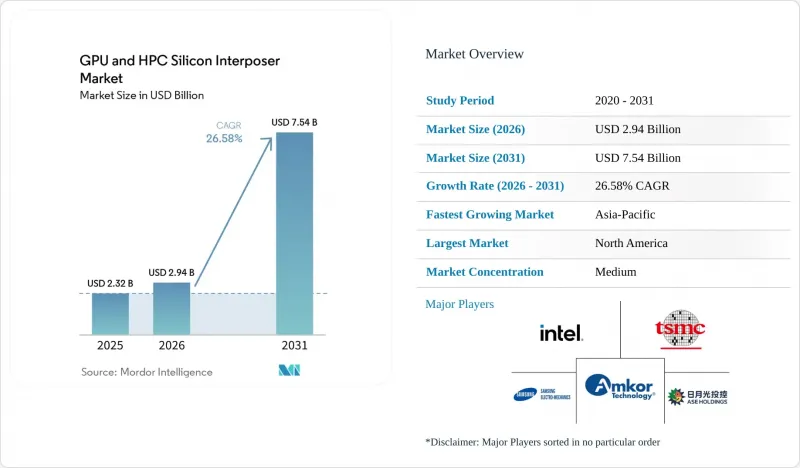
本報告按中介層類型(被動式矽中介層和主動式矽中介層)、應用領域(人工智慧/機器學習加速器、高效能運算、資料中心GPU、網路和高速運算)、最終用戶(雲端服務供應商、科學研究和政府高效能運算中心、企業資料中心)以及地區進行細分。市場預測以美元計價。
全球GPU及HPC矽中介層市場趨勢及洞察
生成式人工智慧工作負載的快速成長
目前最先進的模型參數數量超過一兆,所需的記憶體頻寬超過 20 TB/s,而此閾值只有透過大面積矽中介層才能實現。 NVIDIA 的 Blackwell 架構將於 2026 年開始量產,採用 8 個 HBM3E 堆疊即可實現 18 TB/s 的頻寬,封裝面積超過 3500 平方毫米。正如微軟的 Maia 100 和谷歌的 TPU v5p(均於 2025 年發布)所展示的那樣,從以訓練為中心向以推理為中心的部署模式轉變,使得內存容量和延遲比單純的計算密度更為重要。來自超大規模資料中心業者的客製化半導體正在使 GPU 和高效能運算 (HPC) 的矽中介層市場更加分散。這是因為每個專有加速器都需要自己的 CoWoS 配額,即使 GPU 單元成長放緩,也能確保高需求。因此,中介層供應商可以確保未來幾年的需求預測,但他們必須滿足小批量客製化設計的需求,這使得生產線運轉率管理變得複雜。
每個GPU封裝的HBM堆疊尺寸增加
整合HBM堆疊層數將從2022年的4層翻倍至2025年的8層,到2028年達到12層堆疊的藍圖也正在穩步推進。每增加一層堆疊,TSV密度就會翻倍,並且整個晶片面積上的溫差也會擴大,超過2000平方毫米。台積電將於2024年推出的CoWoS-L技術,透過分離邏輯區和儲存區,在不超出400瓦熱容量限制的情況下實現了12層堆疊佈局。同時,SK海力士已於2025年開始量產12層HBM3E。儲存端的瓶頸依然嚴峻,目前仍有三家廠商佔據了95%的HBM產能,甚至影響了中介層晶圓的規劃。
面積超過 65 K mm² 的晶圓代工廠產能短缺
目前,只有三家供應商——台積電、三星和英特爾——能夠生產光罩尺寸超過 65,000 平方毫米的中介層。台積電佔據主導地位,約佔 CoWoS 生產設施的 70%。即使到 2026 年底,台積電的產能能夠提升至每月 15 萬片晶圓,英偉達一家仍將壟斷其中一半以上的產能。多鏡頭光刻技術已將每台機器的處理速度降低至每天約 40 片晶圓,而 TSV 蝕刻設備的前置作業時間長達 18 個月。將最終組裝給日月光和安靠可以提高產能,但製程交接環節會帶來良率風險,而且這種供不應求預計至少會持續到 2027 年。
細分市場分析
到2025年,被動式矽中介層將佔GPU和HPC矽中介層市場82%的佔有率。這反映了製程控制的成熟、TSV的高良率,以及專注於訊號佈線和HBM整合的封裝方案所帶來的顯著成本優勢。到2025年,GPU和HPC的被動式矽中介層市場規模將達到19億美元,並隨著超大規模叢集採用大規模的封裝尺寸而持續成長。然而,純被動層存在散熱和電源方面的限制,因此設計人員擴大將局部穩壓器、重定時器和監控電路直接整合到中介層平面中。
因此,預計到2031年,主動式產品將達到26.98%的強勁複合年成長率,遠高於2025年4.2億美元的基準。英特爾的EMIB技術表明,在小型晶片佈局中,局部矽橋接技術可將材料成本降低高達50%;而台積電的SoIC技術則可將間距小於1微米的堆疊邏輯塊進行鍵合。隨著記憶體容量的激增,主動式電源網路能夠抑制電壓降,實現更高的時脈頻率,並帶來遠超設計複雜性的效率提升。分析師預測,到2031年,主動式解決方案將佔GPU和HPC矽中介層市場25%至30%的佔有率。
區域分析
至2025年,亞太地區將維持其在GPU和HPC矽中介層市場65%的主導地位。這主要得益於台積電位於竹南和龍潭的CoWoS中心,以及三星位於華城和平澤的I-Cube生產線。光是台灣就佔全球中介層產量的一半左右,台灣和韓國的晶圓廠都受惠於基板、掩模和化學品供應商的高度集中。像江電科技集團這樣的中國OSAT廠商擁有先進的扇出型封裝設備,但受到美國出口限制,難以獲得最先進的TSV設備,而且國內封裝技術也僅限於無法支援HBM4的傳統設計。
北美是成長最快的市場,預計到2031年將以27.58%的複合年成長率成長。根據《晶片法案》(CHIPS Act),總計390億美元的激勵措施正在加速新建晶圓廠和封裝廠的建設。英特爾獲得了85億美元的津貼和110億美元的貸款,用於支持其位於亞利桑那州和俄亥俄州的EMIB和Foveros組件生產工廠。同時,台積電位於亞利桑那州的晶圓廠獲得了66億美元的聯邦資金,用於在2027年擴大其CoWoS晶片的產能。安姆科科技(Amcor Technology)正在其亞利桑那州園區投資70億美元,目標是在2027年開始投產,但北美的成本水準仍比亞太地區高出30%至40%,這限制了注重成本的企業採用北美晶片。
由於歐洲晶圓代工廠代工產能有限,除高階基板外,封裝技術也較為侷限,其市佔率仍維持在個位數中段。歐洲晶片法案撥款430億歐元(約464億美元)用於邏輯晶片製造,而非2.5D封裝生產線,迫使該地區依賴進口裝置,尤其是HBM封裝。儘管南美、中東和非洲的需求總和不足2%,但各國人工智慧計畫的擴張正在加速該地區資料中心的建設,這有望在未來五年後刺激當地對封裝的需求。
其他好處:
- Excel格式的市場預測(ME)表
- 3個月的分析師支持
目錄
第1章:引言
- 研究假設和市場定義
- 調查範圍
第2章:調查方法
第3章執行摘要
第4章 市場狀況
- 市場概覽
- 市場促進因素
- 生成式人工智慧工作負載的快速成長
- 每個GPU封裝的HBM堆疊尺寸增加
- 向基於晶片組的GPU架構過渡
- 網路專用積體電路中2.5D封裝的主流化
- 提高晶圓級製造的良率
- 擴大中介層內橫向供電網路的使用
- 市場限制因素
- 晶圓尺寸為 65 K 或更大的中介晶圓代工廠工廠生產能力受到限制。
- 多層基板的高成本抵銷了中介層所帶來的成本節約。
- 大面積無源矽的可靠性問題
- 複雜的GPU晶片分塊溫度控管
- 宏觀經濟因素對市場的影響
- 產業價值鏈分析
- 監理情勢
- 技術展望
- 波特五力分析
第5章 市場規模與成長預測
- 中介型
- 無源矽中介層
- 有源矽中介層
- 透過使用
- 人工智慧/機器學習加速器
- 高效能運算(科學和技術計算)
- 用於資料中心的GPU
- 網路和高速運算
- 最終用戶
- 雲端服務供應商(超大規模資料中心業者)
- 研究機構及政府附屬高效能運算中心
- 企業資料中心
- 按地區
- 北美洲
- 美國
- 加拿大
- 墨西哥
- 歐洲
- 英國
- 德國
- 法國
- 其他歐洲國家
- 亞太地區
- 中國
- 日本
- 印度
- 韓國
- 其他亞太國家
- 南美洲
- 中東和非洲
- 北美洲
第6章 競爭情勢
- 市場集中度
- 策略趨勢
- 市佔率分析
- 公司簡介
- TSMC
- Samsung Electronics Co., Ltd.
- ASE Technology Holding Co., Ltd.
- Amkor Technology, Inc.
- Intel Corporation
- Advanced Micro Devices, Inc.
- NVIDIA Corporation
- Taiwan Union Technology Corporation
- Unimicron Technology Corp.
- Siliconware Precision Industries Co., Ltd.
- Shinko Electric Industries Co., Ltd.
- JCET Group Co., Ltd.
- SPIL(Siliconware Precision Industries)
- AT&S Austria Technologie & Systemtechnik AG
- Nepes Corporation
- UMC(United Microelectronics Corporation)
- Xilinx, Inc.(AMD Adaptive and Embedded Computing Group)
- Marvell Technology, Inc.
- Broadcom Inc.
- Texas Instruments Incorporated
第7章 市場機會與未來展望
According to Mordor Intelligence, the gPU and HPC silicon interposer market size is expected to increase from USD 2.32 billion in 2025 to USD 2.94 billion in 2026 and reach USD 7.54 billion by 2031, growing at a CAGR of 26.58% over 2026-2031.
This report is Segmented by Interposer Type (Passive Silicon Interposer, and Active Silicon Interposer), Application (AI/Machine Learning Accelerators, HPC, Data Center GPUs, and Networking and High-Speed Compute), End-User (Cloud Service Providers, Research and Government HPC Centers, and Enterprise Data Centers), and Geography. The Market Forecasts are Provided in Terms of Value (USD).
Global GPU And HPC Silicon Interposer Market Trends and Insights
Rapid Proliferation Of Generative AI Workloads
Frontier models now exceed one trillion parameters and demand memory bandwidth above 20 TB/s, a threshold only attainable with large-area silicon interposers. NVIDIA's Blackwell architecture ships in volume during 2026 with eight HBM3E stacks delivering 18 TB/s, forcing package footprints beyond 3,500 mm2. The pivot from training-centric to inference-dominant deployments prioritizes memory capacity and latency over sheer compute density, as illustrated by Microsoft's Maia 100 and Google's TPU v5p, both launched in 2025. Hyperscalers' custom silicon is fragmenting the GPU and HPC silicon interposer market, because every proprietary accelerator requires its own CoWoS allocation, keeping demand high even if GPU unit growth moderates. Consequently, interposer suppliers enjoy multi-year visibility but must juggle small-lot custom designs, which complicate line utilization.
Escalating HBM Stack Counts Per GPU Package
HBM integration has doubled from four stacks in 2022 to eight in 2025, with 12-stack roadmaps on track for 2028. Each additional stack multiplies TSV density and amplifies thermal gradients across die sizes, surpassing 2,000 mm2. TSMC's CoWoS-L, introduced in 2024, partitions logic and memory zones to enable 12-stack layouts without breaching 400-W thermal envelopes, while SK Hynix began volume shipments of 12-high HBM3E in 2025. Memory-side bottlenecks remain acute, as three vendors still command 95% of HBM capacity, creating ripple effects that propagate into interposer wafer planning.
Limited Foundry Capacity For >=65 K mm2 Interposers
Only three suppliers, TSMC, Samsung, and Intel, can currently process interposers that exceed reticle sizes of 65,000 mm2. TSMC dominates with roughly 70% of installed CoWoS fabrication, but even after ramping to 150,000 wafer starts per month by late 2026, NVIDIA alone will soak up more than half that output. Multi-shot lithography slows each tool to barely 40 wafers per day, and TSV etchers face 18-month lead times. Outsourcing final assembly to ASE Technology and Amkor Technology improves throughput yet introduces yield risk at the hand-off points, prolonging the shortage until at least 2027.
Other drivers and restraints analyzed in the detailed report include:
- Transition Toward Chiplet-Based GPU Architectures
- Mainstream Adoption Of 2.5D Packages In Networking ASICs
- High Build-Up Substrate Costs Offsetting Interposer Savings
For complete list of drivers and restraints, kindly check the Table Of Contents.
Segment Analysis
Passive silicon interposers accounted for 82% of the GPU and HPC silicon interposer market in 2025, reflecting mature process control, high TSV yields, and a clear cost edge for packages focused on signal routing and HBM integration. The GPU and HPC silicon interposer market for passive designs stood at USD 1.90 billion in 2025 and continues to expand as hyperscale clusters adopt ever-larger footprints. Yet the thermal and power-delivery limits of purely passive layers are prompting designers to embed localized regulators, retimers, and monitoring circuits directly on the interposer plane.
Active variants therefore register a brisk 26.98% CAGR to 2031, rising from a modest USD 0.42 billion baseline in 2025. Intel's EMIB shows how localized silicon bridges can cut material costs by up to 50% for small-die layouts, while TSMC's SoIC locks stacked logic blocks together at sub-1 µm pitches. As memory counts swell, active power-delivery grids reduce voltage droop, enabling higher clock frequencies and yielding efficiency gains that outweigh their design complexity. Analysts expect active solutions to seize 25-30% of the GPU and HPC silicon interposer market share by 2031.
Geography Analysis
Asia-Pacific maintained a commanding 65% share of the GPU and HPC silicon interposer market in 2025, anchored by TSMC's CoWoS hubs in Zhunan and Longtan and Samsung's I-Cube lines in Hwaseong and Pyeongtaek. Taiwan alone represents roughly half of worldwide interposer output, and both Taiwanese and South Korean fabs benefit from the tight clustering of substrate, mask, and chemical suppliers. Chinese OSATs such as JCET Group own advanced fan-out tools but face U.S. export controls that bar access to leading-edge TSV tooling, limiting domestic packages to legacy designs that cannot host HBM4.
North America is the fastest-growing theatre market, projected to grow at a 27.58% CAGR through 2031. CHIPS Act incentives totaling USD 39 billion have accelerated the construction of new fabs and packaging plants. Intel's USD 8.5 billion grant plus USD 11 billion loan backs Arizona and Ohio sites that will produce EMIB and Foveros assemblies, while TSMC's Arizona fab, supported by USD 6.6 billion in federal funding, adds CoWoS capacity in 2027. Amkor Technology is investing USD 7 billion in an Arizona campus aiming at 2027 production, but North America's cost base remains 30-40% above Asia-Pacific, limiting adoption among cost-sensitive enterprises.
Europe captures a mid-single-digit slice, constrained by scant foundry capacity and minimal packaging expertise beyond high-end substrates. The European Chips Act steers EUR 43 billion (approximately USD 46.4 billion) toward logic fabs rather than 2.5-D assembly lines, leaving the region dependent on imports for HBM-centric devices. South America, the Middle East, and Africa together account for less than 2% of demand, yet rising sovereign AI programs could spur regional data-center builds that, in turn, pull localized packaging in the latter half of the decade.
- TSMC
- Samsung Electronics Co., Ltd.
- ASE Technology Holding Co., Ltd.
- Amkor Technology, Inc.
- Intel Corporation
- Advanced Micro Devices, Inc.
- NVIDIA Corporation
- Taiwan Union Technology Corporation
- Unimicron Technology Corp.
- Siliconware Precision Industries Co., Ltd.
- Shinko Electric Industries Co., Ltd.
- JCET Group Co., Ltd.
- SPIL (Siliconware Precision Industries)
- AT&S Austria Technologie & Systemtechnik AG
- Nepes Corporation
- UMC (United Microelectronics Corporation)
- Xilinx, Inc. (AMD Adaptive and Embedded Computing Group)
- Marvell Technology, Inc.
- Broadcom Inc.
- Texas Instruments Incorporated
Additional Benefits:
- The market estimate (ME) sheet in Excel format
- 3 months of analyst support
TABLE OF CONTENTS
1 INTRODUCTION
- 1.1 Study Assumptions and Market Definition
- 1.2 Scope of the Study
2 RESEARCH METHODOLOGY
3 EXECUTIVE SUMMARY
4 MARKET LANDSCAPE
- 4.1 Market Overview
- 4.2 Market Drivers
- 4.2.1 Rapid Proliferation of Generative AI Workloads
- 4.2.2 Escalating HBM Stack Counts per GPU Package
- 4.2.3 Transition Toward Chiplet-Based GPU Architectures
- 4.2.4 Mainstream Adoption of 2.5D Packages in Networking ASICs
- 4.2.5 Wafer-Scale Fabrication Yield Improvements
- 4.2.6 Growing Use of Lateral Power-Delivery Networks Inside Interposers
- 4.3 Market Restraints
- 4.3.1 Limited Foundry Capacity for >=65 K Reticle-Size Interposers
- 4.3.2 High Build-Up Substrate Costs Offsetting Interposer Savings
- 4.3.3 Reliability Concerns in Large-Area Passive Silicon
- 4.3.4 Complex Thermal Management for Tiled GPU Dies
- 4.4 Impact of Macroeconomic Factors on the Market
- 4.5 Industry Value Chain Analysis
- 4.6 Regulatory Landscape
- 4.7 Technological Outlook
- 4.8 Porter's Five Forces Analysis
- 4.8.1 Bargaining Power of Suppliers
- 4.8.2 Bargaining Power of Buyers
- 4.8.3 Threat of New Entrants
- 4.8.4 Threat of Substitutes
- 4.8.5 Intensity of Competitive Rivalry
5 MARKET SIZE AND GROWTH FORECASTS (VALUE)
- 5.1 By Interprosr Type
- 5.1.1 Passive Silicon Interposer
- 5.1.2 Active Silicon Interposer
- 5.2 By Application
- 5.2.1 AI / Machine Learning accelerators
- 5.2.2 HPC (Scientific and Technical Computing)
- 5.2.3 Data Center GPUs
- 5.2.4 Networking and High-Speed Compute
- 5.3 By End-User
- 5.3.1 Cloud Service Providers (Hyperscalers)
- 5.3.2 Research and Government HPC Centers
- 5.3.3 Enterprise Data Centers
- 5.4 By Geography
- 5.4.1 North America
- 5.4.1.1 United States
- 5.4.1.2 Canada
- 5.4.1.3 Mexico
- 5.4.2 Europe
- 5.4.2.1 United Kingdom
- 5.4.2.2 Germany
- 5.4.2.3 France
- 5.4.2.4 Rest of Europe
- 5.4.3 Asia-Pacific
- 5.4.3.1 China
- 5.4.3.2 Japan
- 5.4.3.3 India
- 5.4.3.4 South Korea
- 5.4.3.5 Rest of Asia-Pacific
- 5.4.4 South America
- 5.4.5 Middle East and Africa
- 5.4.1 North America
6 COMPETITIVE LANDSCAPE
- 6.1 Market Concentration
- 6.2 Strategic Moves
- 6.3 Market Share Analysis
- 6.4 Company Profiles (includes Global Level Overview, Market Level Overview, Core Segments, Financials as available, Strategic Information, Market Rank/Share, Products and Services, Recent Developments)
- 6.4.1 TSMC
- 6.4.2 Samsung Electronics Co., Ltd.
- 6.4.3 ASE Technology Holding Co., Ltd.
- 6.4.4 Amkor Technology, Inc.
- 6.4.5 Intel Corporation
- 6.4.6 Advanced Micro Devices, Inc.
- 6.4.7 NVIDIA Corporation
- 6.4.8 Taiwan Union Technology Corporation
- 6.4.9 Unimicron Technology Corp.
- 6.4.10 Siliconware Precision Industries Co., Ltd.
- 6.4.11 Shinko Electric Industries Co., Ltd.
- 6.4.12 JCET Group Co., Ltd.
- 6.4.13 SPIL (Siliconware Precision Industries)
- 6.4.14 AT&S Austria Technologie & Systemtechnik AG
- 6.4.15 Nepes Corporation
- 6.4.16 UMC (United Microelectronics Corporation)
- 6.4.17 Xilinx, Inc. (AMD Adaptive and Embedded Computing Group)
- 6.4.18 Marvell Technology, Inc.
- 6.4.19 Broadcom Inc.
- 6.4.20 Texas Instruments Incorporated
7 MARKET OPPORTUNITIES AND FUTURE OUTLOOK
- 7.1 White-Space and Unmet-Need Assessment

 快速入口裝卸鎖門市場規模、佔有率及成長分析:依機構/驅動系統、真空壓力耐受等級、結構材料/基材、最終用途產業及地區分類-2026-2033年產業預測
 中介層和矽橋市場報告:趨勢、預測和競爭分析(至2035年)
 用於 HBM 的矽中介層和基板:市場佔有率分析、行業趨勢和統計數據以及成長預測(2026-2031 年)GPU晶圓需求:市佔率分析、產業趨勢與統計、成長預測(2026-2031年)GPU程式設計平台:市佔率分析、產業趨勢與統計、成長預測(2026-2031年)
 中介層及矽橋市場規模、佔有率、成長、全球產業分析、區域趨勢及2026年至2034年預測
 2026年全球量子模擬器市場報告2026年全球多模態記憶體市場報告2026 年 AI 工作負載的 RoCE(基於融合乙太網路的 RDMA)全球市場報告
 伺服器和高效能運算用ABF基板市場:按應用、材料類型、層數和基板厚度分類,全球預測,2026-2032年