

 |
市場調查報告書
商品編碼
2064442
機器學習維運(MLops):市場佔有率分析、產業趨勢與統計、成長預測(2026-2031)Machine Learning Operations (MLOps) - Market Share Analysis, Industry Trends & Statistics, Growth Forecasts (2026 - 2031) |
||||||
※ 本網頁內容可能與最新版本有所差異。詳細情況請與我們聯繫。
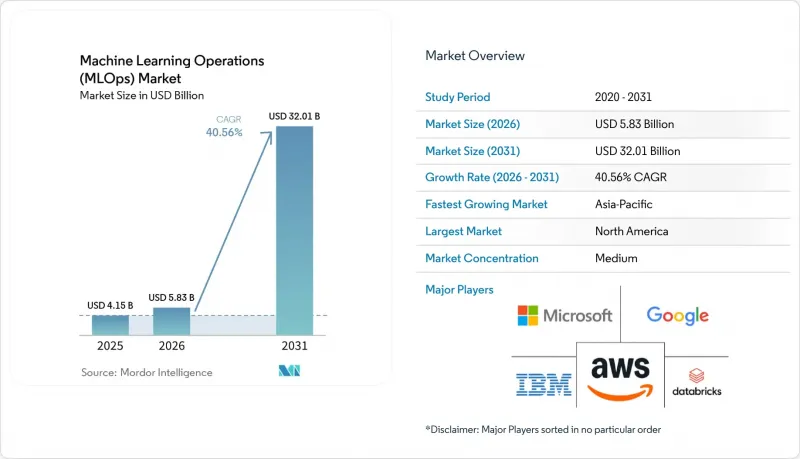
根據 Mordor Intelligence 預測,機器學習運作 (MLOps) 市場規模將從 2025 年的 41.5 億美元和 2026 年的 58.3 億美元成長到 2031 年的 320.1 億美元,2026 年至 2031 年的年複合成長率(CAGR)率為 40.5%。
本報告按組件(平台和服務)、部署類型(雲端、本地部署、混合部署)、組織規模(大型企業和中小企業)、最終用戶行業(銀行、金融服務和保險、醫療保健和生命科學、IT和電信、零售和電子商務、政府和公共部門等)以及地區進行細分。市場預測以美元計價。
全球機器學習運維(MLOps)市場趨勢與洞察
將人工智慧從試點階段擴展到生產環境
機器學習運作 (MLOps) 市場的發展動力源自於企業內部面臨的根本性挑戰。雖然許多組織能夠建立模型,但能夠將其遷移到可復現管理架構下的穩定生產環境中的組織卻寥寥無幾。隨著各部門模型數量的增加,手動遷移到生產環境、版本控制、回滾和重新訓練等工作很快就會成為維運瓶頸,減緩價值創造速度並增加發布風險。這種壓力促使買家不再依賴單一工具和自訂腳本,而是轉向能夠標準化開發、檢驗、部署和監控等各個環節交接的平台。 Amazon SageMaker AI 在 2025 年 12 月新增了無伺服器 MLflow,這表明供應商致力於減少設定工作量,並縮短從實驗到託管部署的流程。 Microsoft Fabric 在 2026 年 4 月也為 MLflow 引入了跨工作區日誌記錄功能,支援在不中斷工作流程的情況下,清楚地分類開發、測試和生產環境。因此,MLOps 市場正受惠於企業對維運規範的需求以及對新型 AI 功能的需求。
對模型監測和漂移管理的需求日益成長。
MLOps 市場擴張的另一個原因是,生產模型在部署後若缺乏持續監控,便無法維持其可靠性。效能下降、資料模式變化、延遲波動和策略失效等問題可能會逐漸顯現,而且這些問題在面向客戶的生成式 AI 系統中比在傳統預測性工作負載中更難檢測。 Databricks 於 2025 年 6 月透過 MLflow 3.0 解決了這項變化,新增了生產級追蹤、提示追蹤和 LLM 判斷功能,以支援生成式 AI 工作流程的評估和可觀測性。 2026 年 5 月,Amazon SageMaker AI 整合了 MLflow 3.10,新增了多輪工作流程的追蹤功能,以及用於延遲、令牌使用情況和品質的內建評估和儀表板功能。這反映了發布後對運維可見性的需求日益成長。此外,Arize AI 於 2026 年 3 月新增了對 NVIDIA NIM 的原生支持,使團隊能夠在同一可觀測性層內監控和評估透過其運行時部署的模型。這些變化,特別是隨著決策鏈的延長和自主系統導致的故障點數量的增加,使得監控成為機器學習運作(MLOps)市場的關鍵購買標準。
跨部門MLOps人才短缺
機器學習維運 (MLOps) 市場在普及方面仍面臨許多現實限制。這是因為生產環境中的人工智慧維運需要具備資料工程、軟體交付、管治和模型維運等綜合技能的人員,而許多組織恰恰缺乏這類人才。儘管許多公司能夠投資人工智慧工具,但它們仍然難以找到合適的人員來維護發布管道、監控運作中的系統、管理回溯流程以及記錄受監管用例中的控制措施。隨著組織從少數孤立的模型轉向更廣泛的產品組合,需要標準化的發布實踐和跨業務部門共用的管治流程,這種人才短缺問題尤其突出。平台供應商正在透過在實驗追蹤、配置範本和託管工作流程工具中整合更多自動化功能來解決這個問題,從而減少基本操作所需的專家工作量。微軟 Fabric 的 MLflow 在不同工作區之間的日誌記錄功能也反映了這一趨勢,旨在減少那些沒有大規模專用平台工程團隊的團隊之間的協調摩擦。然而,如果買家無法彌合工具獲取和維運知識之間的差距,機器學習運維 (MLOps) 市場將無法將強勁的軟體需求完全轉化為生產部署。
細分市場分析
2025年,平台佔總收入的64.23%,這意味著平台層仍是整個機器學習運作(MLOps)市場的主要支出領域。 2025年MLOps市場64%的佔有率反映出企業越來越傾向於使用控制平面,以便集中管理實驗追蹤、模型註冊、部署、監控和管治。這一趨勢反映了買家正在逐漸放棄組合使用不同的生命週期工具,尤其是在團隊需要清晰的模型發布和策略決策溯源時。 2025年6月,Databricks透過將MLflow 3.0擴展到傳統機器學習和生成式人工智慧工作流程,增強了這個模式,在單一平台上提供可追溯性、評估和配置控制。 Amazon SageMaker AI也在2025年12月增加了無伺服器MLflow,這表明主要供應商將簡化控制平面視為實現更廣泛生產應用的捷徑。
預計到2031年,服務市場將以41.34%的複合年成長率成長,即使在平台主導的收入結構中,服務層的重要性仍然很高。機器學習維運(MLOps)市場並未擺脫對人工支援的依賴,許多組織仍需要外部協助進行架構設計、工作流程遷移、管治設定和營運模式變更。隨著人工智慧專案向LLMOps和AgentOps發展,這一點尤其明顯,因為這些領域的配置模式尚未標準化,糟糕的發佈設計會導致高昂的成本。微軟Fabric在2026年4月推出的跨工作區日誌記錄更新展示了平台功能如何降低複雜性,但同時也凸顯了企業仍需要實施方面的協助,以協調各團隊之間的流程、權限和生產環境控制。事實上,MLOps市場正在向混合交付模式轉變,即軟體和服務打包購買,以縮短部署週期並減輕內部營運負擔。
到 2025 年,雲端運算將佔據機器學習運維 (MLOps) 市場 53.44% 的佔有率,並將成為成長最快的採用模式,到 2031 年的年複合成長率(CAGR)將達到 40.87%。雲端運算的主導地位反映了託管基礎設施的規模經濟效益、更快的環境部署速度以及運算、編配、監控和管治服務之間的緊密整合。亞馬遜雲端服務 (AWS) 在 2025 年 6 月進一步強化了這一趨勢,推出了降低 GPU 訓練和推理成本的方法,直接支援了基於雲端的 AI 生產環境的經濟效益。 2026 年 5 月,Google雲端為 Managed Airflow 添加了編配功能,使團隊能夠在運行資料和 AI 工作負載的同時,減少客製化工程的開銷。這些趨勢解釋了為什麼機器學習維運 (MLOps) 市場的大部分新增採用活動仍然集中在雲端環境中。
在監管和安全敏感的環境中,資料居住要求、自主人工智慧要求以及內部控制需求仍然強勁,因此本地部署仍然至關重要。正因如此,混合架構的重要性日益凸顯。這並非因為雲端運算成長放緩,而是因為許多公司現在需要一個能夠覆蓋雲端、私有基礎設施和邊緣節點的單一營運模式。亞馬遜網路服務 (AWS) 於 2026 年 5 月正式發布了 AWS MCP 伺服器和代理工具包,該工具包具備身分和存取管理 (IAM) 防護措施以及 CloudTrail 日誌記錄功能,體現了這一更廣泛的轉變。這凸顯了服務間安全性整合已成為部署討論中的關鍵要素。同樣在 2026 年 5 月,Teradata 發布了雲端、本地和混合環境的自主知識平台,顯示市場對跨不同執行環境的部署一致性有著持續的需求。因此,預計在預測期內,MLOps 市場在收入方面仍將以雲端主導,而在營運設計方面則會更加趨向混合模式。
區域分析
2025年,北美繼續保持其作為機器學習運維(MLOps)市場最大區域貢獻者的地位,佔據34.22%的市場佔有率。該地區受益於高密度的雲端基礎設施、龐大的企業人工智慧預算、強大的供應商基礎以及經驗豐富的平台和數據工程人才的集中。 2025年11月,亞馬遜宣布投資高達500億美元,用於擴展其面向美國政府機構的人工智慧和超級運算基礎設施,以滿足聯邦政府和國防領域對生產級MLOps的長期需求。加拿大也正透過新的人工智慧和雲端基礎設施計畫加強在該領域的影響力,以支援企業採用和公共部門在2025年至2026年間的部署。美國仍然是該地區的主要成長引擎,它融合了超大規模資料中心業者的優勢、高度集中的軟體供應商以及比許多其他市場更快的企業採用模式。
亞太地區是成長最快的區域市場,預計到2031年將以41.63%的複合年成長率成長,這將繼續使其在機器學習維運(MLOps)市場的長期發展軌跡中佔據核心地位。這一全部區域成長主要得益於企業人工智慧應用的不斷擴展、政策關注度的提升以及對可快速部署的雲端原生平台日益成長的需求。根據OpenAI的數據顯示,日本在企業API應用方面表現突出,擁有美國以外最多的企業API客戶。這顯示下游維運工具的需求強勁。中國正透過大規模的企業人工智慧應用以及對自主部署和本地部署維運模式日益成長的興趣,形成一個重要的市場。新加坡也在影響區域應用模式,金融、醫療保健和先進製造業中以管治主導的人工智慧專案提高了東南亞地區對可審計性和生命週期管理的期望。
歐洲仍然是第三大區域市場,其中德國、英國和法國佔據了機器學習運維 (MLOps) 市場的大部分區域支出。監管壓力是該地區的主要促進因素,因為高度監管行業的買家更加重視生產人工智慧系統中的技術文件、事件日誌和人工監督。德國的 appliedAI舉措與 40 家 DAX 指數成分股公司中的 23 家建立了合作關係,該計劃將人工智慧管治定位為營運模式本身不可或缺的一部分。這反映了當前合規性已直接融入 MLOps 實踐的現狀。雖然南美洲和中東及非洲的總合規模仍然較小,但各國的人工智慧優先事項、公共部門專案以及金融服務的數位化仍然為能夠支援國內、混合或嚴格控制部署架構的供應商創造了特定的商機。
其他好處:
- Excel格式的市場預測(ME)表
- 3個月的分析師支持
目錄
第1章:引言
- 研究假設和市場定義
- 調查範圍
第2章:調查方法
第3章執行摘要
第4章 市場狀況
- 市場概覽
- 市場促進因素
- 將人工智慧從試點階段部署到生產環境
- 對模型監測和漂移管理的需求日益成長。
- 雲端原生人工智慧基礎架構擴展
- 加強人工智慧管治和可審計性要求
- LLMOps 和 AgentOps 的融合增加了生命週期的複雜性。
- GPU FinOps 和推理成本管理將是平台優先事項。
- 市場限制因素
- 跨部門MLOps人才短缺
- 分散化的工具鏈和一體化的債務
- 主權人工智慧和資料本地化法規正在使部署架構碎片化。
- 模型登錄、特徵庫和 CI/CD 供應鏈中的安全風險
- 宏觀經濟因素對市場的影響
- 決定公司IT預算的優先順序
- GPU和加速運算成本不斷上漲。
- 雲端成本最佳化和對財務營運的壓力
- 貿易政策對半導體供應的影響
- 產業價值鏈分析
- 數據導入和標註
- 特徵工程和特徵存儲管理
- 模型開發與實驗
- 檢驗和負責任的人工智慧管理
- 實施和服務提供
- 監測、可觀察性和再培訓
- 整合、支援和管理服務
- 監理情勢
- 人工智慧管治和模型風險管理規則
- 資料隱私和跨境資料傳輸的要求
- 銀行、金融服務和保險 (BFSI):醫療保健和公共部門實施的特定產業合規要求
- 底層模型的版權、來源和使用管理
- 技術展望
- 整合 MLOps 和 LLMOps 控制平面
- 多重雲端和混合編配
- 要素儲存、向量儲存和元資料層
- 自動化評估、防護措施和策略即程式碼
- 邊緣和即時模型服務
- 波特五力分析
第5章 市場規模與成長預測
- 按組件
- 平台
- 實驗追蹤與協作
- 流水線編配和 CI/CD
- 特徵儲存和資料處理歷程
- 模型註冊和版本控制
- 部署和服務
- 監測和可觀測性
- 管治與負責任的人工智慧
- 服務
- 諮詢與策略
- 實施與整合
- 培訓與賦能
- 託管服務
- 支援與維護
- 平台
- 部署模式
- 雲
- 現場
- 混合
- 按組織規模
- 大公司
- 小型企業
- 按最終用戶行業分類
- BFSI
- 醫療保健和生命科學
- 資訊科技/通訊
- 零售與電子商務
- 製造業
- 政府/公共部門
- 能源公用事業
- 媒體與娛樂
- 運輸/物流
- 教育/研究
- 按地區
- 北美洲
- 美國
- 加拿大
- 墨西哥
- 南美洲
- 巴西
- 阿根廷
- 智利
- 其他南美國家
- 歐洲
- 德國
- 英國
- 法國
- 義大利
- 西班牙
- 俄羅斯
- 荷蘭
- 其他歐洲國家
- 亞太地區
- 中國
- 日本
- 印度
- 韓國
- 新加坡
- 其他亞太國家
- 中東
- 沙烏地阿拉伯
- 阿拉伯聯合大公國
- 土耳其
- 以色列
- 其他中東國家
- 非洲
- 南非
- 埃及
- 奈及利亞
- 肯亞
- 其他非洲國家
- 北美洲
第6章 競爭情勢
- 市場集中度
- 策略趨勢
- 市佔率分析
- 公司簡介
- Amazon Web Services, Inc.
- Microsoft Corporation
- Google LLC
- IBM Corporation
- Databricks, Inc.
- DataRobot, Inc.
- Domino Data Lab, Inc.
- Dataiku SAS
- H2O.ai, Inc.
- Cloudera, Inc.
- Hewlett Packard Enterprise Company
- SAS Institute Inc.
- Snowflake Inc.
- Teradata Corporation
- Seldon Technologies Ltd.
- ClearML Inc.
- Weights & Biases, Inc.
- Neptune Labs Sp. z oo
- Fiddler AI, Inc.
- ModelOp, Inc.
- Arize AI, Inc.
第7章 市場機會與未來展望
According to Mordor Intelligence, the machine learning operations (MLOps) market size is projected to expand from USD 4.15 billion in 2025 and USD 5.83 billion in 2026 to USD 32.01 billion by 2031, registering a CAGR of 40.56% between 2026 to 2031.
This report is Segmented by Component (Platform, and Services), Deployment Mode (Cloud, On-Premise, and Hybrid), Organization Size (Large Enterprises, and Small and Medium-Sized Enterprises), End-User Industry (BFSI, Healthcare and Life Sciences, IT and Telecom, Retail and E-Commerce, Government and Public Sector, and More), and Geography. The Market Forecasts are Provided in Terms of Value (USD).
Global Machine Learning Operations (MLOps) Market Trends and Insights
Scaling AI from Pilot to Production
The machine learning operations (MLOps) market is being lifted by a basic enterprise problem, many organizations can build models, but far fewer can move them into stable production with repeatable controls. Once model counts rise across departments, manual promotion, version tracking, rollback, and retraining quickly become operational bottlenecks that slow value capture and increase release risk. This pressure is pushing buyers toward platforms that standardize handoffs across development, validation, deployment, and monitoring, rather than relying on separate point tools and custom scripts. Amazon SageMaker AI added serverless MLflow in December 2025, which shows how vendors are trying to reduce setup work and shorten the path from experimentation to managed deployment. Microsoft Fabric also introduced cross-workspace logging for MLflow in April 2026, which supports cleaner separation across development, test, and production environments without breaking workflow continuity. As a result, the MLOps market is gaining from enterprise demand for operating discipline as much as it is gaining from demand for new AI features.
Rising Need for Model Monitoring and Drift Management
The MLOps market is also expanding because production models do not stay reliable without continuous oversight after deployment. Performance decay, changing data patterns, latency shifts, and policy failures can emerge gradually, and these issues are harder to detect in customer-facing generative systems than in traditional prediction workloads. Databricks addressed this shift in June 2025 with MLflow 3.0, which added production-scale tracing, prompt tracking, and LLM judges to support evaluation and observability across generative AI workflows. Amazon SageMaker AI integrated MLflow 3.10 in May 2026 with tracing for multi-turn workflows and built-in evaluation and dashboarding for latency, token use, and quality, which reflects growing demand for operational visibility after release. Arize AI also added native support for NVIDIA NIM in March 2026 so teams could monitor and evaluate models deployed through that runtime inside the same observability layer. These shifts are making monitoring a central buying criterion in the machine learning operations (MLOps) market, especially as agentic systems introduce longer decision chains and more failure points.
Shortage of Cross-Functional MLOps Talent
The machine learning operations (MLOps) market still faces a real adoption constraint because production AI requires combined skills in data engineering, software delivery, governance, and model operations, and that blend is scarce in most organizations. Many enterprises can fund AI tools, but they still struggle to staff teams that can maintain release pipelines, monitor live systems, manage rollback processes, and document controls for regulated use cases. This shortage is especially visible when organizations move from a few isolated models to broader portfolios that demand standardized release practices and shared governance processes across business units. Platform vendors are responding by building more automation into experiment tracking, deployment templates, and managed workflow tooling, which reduces the amount of specialist labor required for basic operations. Microsoft Fabric's MLflow logging across separate workspaces also reflects this push toward reducing coordination friction for teams that do not have large dedicated platform engineering groups. Even so, the machine learning operations (MLOps) market cannot fully convert strong software demand into production adoption unless buyers can close the gap between tooling access and operational expertise.
Other drivers and restraints analyzed in the detailed report include:
- Expansion of Cloud-Native AI Infrastructure
- LLMOps and AgentOps Convergence Raising Lifecycle Complexity
- Fragmented Toolchains And Integration Debt
For complete list of drivers and restraints, kindly check the Table Of Contents.
Segment Analysis
Platforms held 64.23% of revenue in 2025, which means the platform layer remained the core spending center across the machine learning operations (MLOps) market. Platforms held 64% of the machine learning operations (MLOps) market share in 2025 because enterprises increasingly preferred one control plane for experiment tracking, model registry, deployment, monitoring, and governance. That preference reflects a broader buyer shift away from stitching together separate lifecycle tools, especially when teams need clear lineage across model releases and policy decisions. Databricks strengthened this model in June 2025 by extending MLflow 3.0 across traditional machine learning and generative AI workflows with tracing, evaluation, and deployment controls on one platform. Amazon SageMaker AI also added serverless MLflow in December 2025, which shows that large vendors see control plane simplification as a direct route to wider production adoption.
Services are forecast to expand at a 41.34% CAGR through 2031, which keeps the service layer highly relevant even in a platform-led revenue structure. The machine learning operations (MLOps) market is not shifting away from human support, because many organizations still need outside help for architecture design, workflow migration, governance setup, and operating model changes. This is especially true when AI programs move into LLMOps and AgentOps, where deployment patterns are less standardized and the cost of poor release design is higher. Microsoft Fabric's cross-workspace logging update in April 2026 illustrates how platform features can reduce complexity, but it also highlights how enterprises still need implementation support to align process, permissions, and production controls across teams. In practice, the MLOps market is moving toward blended delivery models where software and services are purchased together to shorten deployment time and reduce internal operating strain.
Cloud accounted for 53.44% share of the machine learning operations (MLOps) market size in 2025, and it is also the fastest-growing deployment mode with a 40.87% CAGR through 2031. The cloud lead reflects the scale advantages of managed infrastructure, faster environment setup, and tighter integration between compute, orchestration, monitoring, and governance services. Amazon Web Services continued to reinforce this direction in June 2025 by outlining ways to lower GPU training and inference costs, which directly supports cloud-based production AI economics. Google Cloud added orchestration improvements to Managed Asia-Pacifiche Airflow in May 2026, which helps teams run data and AI workloads with less custom engineering overhead. These developments show why the machine learning operations (MLOps) market continues to concentrate a large share of new deployment activity in cloud environments.
On-premises deployment still matters because data residency, sovereign AI requirements, and internal control needs remain strong in regulated and security-sensitive settings. Hybrid architectures are therefore gaining weight, not because cloud growth is slowing, but because many enterprises now need one operating model across cloud, private infrastructure, and edge nodes. Amazon Web Services reflected this broader shift in May 2026 when it made the AWS MCP Server and Agent Toolkit generally available with IAM guardrails and CloudTrail logging, underscoring how secure integration across services has become part of the deployment conversation. Teradata also launched its Autonomous Knowledge Platform in May 2026 for cloud, on-premises, and hybrid environments, which points to sustained demand for deployment consistency across different runtime locations. The MLOps market is therefore likely to remain cloud-led on revenue while becoming more hybrid in operating design over the forecast period.
Geography Analysis
North America held 34.22% of the machine learning operations (MLOps) market share in 2025, which kept it as the largest regional contributor to the machine learning operations (MLOps) market. The region benefits from dense cloud infrastructure, large enterprise AI budgets, a deep vendor base, and a strong concentration of experienced platform and data engineering talent. Amazon said in November 2025 that it would invest up to USD 50 billion to expand AI and supercomputing infrastructure for U.S. government agencies, which supports long-run demand for production-grade MLOps in federal and defense-related environments. Canada is also strengthening its role through new AI and cloud infrastructure commitments that support enterprise adoption and public sector implementation over 2025 and 2026. The United States remains the main regional growth engine because it combines hyperscaler strength, software vendor density, and earlier enterprise adoption patterns than most other markets.
Asia-Pacific is the fastest-growing regional segment at a 41.63% CAGR through 2031, and this keeps it central to the longer-term expansion path of the machine learning operations (MLOps) market. Growth across the region is supported by a rising base of enterprise AI adoption, stronger policy attention, and more demand for cloud-native platforms that can be deployed quickly. Japan stands out for corporate API adoption, with OpenAI reporting the largest number of corporate API customers outside the United States, which suggests strong demand conditions for downstream operational tooling. China contributes significant volume through large-scale enterprise AI deployment and stronger interest in sovereign and on-premises operating models. Singapore is also influencing regional adoption patterns because governance-led AI programs in finance, healthcare, and advanced manufacturing are raising expectations around auditability and lifecycle control across Southeast Asia.
Europe remained the third-largest regional block, with Germany, the United Kingdom, and France accounting for much of regional spending in the machine learning operations (MLOps) market. Regulatory pressure is a major regional factor, because buyers in regulated sectors are placing greater emphasis on technical documentation, event logging, and human oversight in production AI systems. The appliedAI Initiative in Germany works with 23 of the 40 DAX corporations and treats AI governance as part of the operating model itself, which reflects how compliance is being built directly into MLOps practice. South America, the Middle East, and Africa remain smaller in aggregate, but sovereign AI priorities, public sector programs, and financial services digitization still create targeted opportunities for vendors that can support in-country, hybrid, or tightly governed deployment architectures.
- Amazon Web Services, Inc.
- Microsoft Corporation
- Google LLC
- IBM Corporation
- Databricks, Inc.
- DataRobot, Inc.
- Domino Data Lab, Inc.
- Dataiku SAS
- H2O.ai, Inc.
- Cloudera, Inc.
- Hewlett Packard Enterprise Company
- SAS Institute Inc.
- Snowflake Inc.
- Teradata Corporation
- Seldon Technologies Ltd.
- ClearML Inc.
- Weights & Biases, Inc.
- Neptune Labs Sp. z o.o.
- Fiddler AI, Inc.
- ModelOp, Inc.
- Arize AI, Inc.
Additional Benefits:
- The market estimate (ME) sheet in Excel format
- 3 months of analyst support
TABLE OF CONTENTS
1 INTRODUCTION
- 1.1 Study Assumptions and Market Definition
- 1.2 Scope of the Study
2 RESEARCH METHODOLOGY
3 EXECUTIVE SUMMARY
4 MARKET LANDSCAPE
- 4.1 Market Overview
- 4.2 Market Drivers
- 4.2.1 Scaling AI From Pilot to Production
- 4.2.2 Rising Need for Model Monitoring and Drift Management
- 4.2.3 Expansion of Cloud-Native AI Infrastructure
- 4.2.4 Tightening AI Governance and Auditability Requirements
- 4.2.5 LLMOps and AgentOps Convergence Raising Lifecycle Complexity
- 4.2.6 GPU FinOps and Inference Cost Control Becoming a Platform Priority
- 4.3 Market Restraints
- 4.3.1 Shortage of Cross-Functional MLOps Talent
- 4.3.2 Fragmented Toolchains and Integration Debt
- 4.3.3 Sovereign AI and Data Localization Rules Fragmenting Deployment Architectures
- 4.3.4 Security Exposure Across Model Registries, Feature Stores, and CI/CD Supply Chains
- 4.4 Impact of Macroeconomic Factors on the Market
- 4.4.1 Enterprise IT Budget Prioritization
- 4.4.2 GPU and Accelerated Compute Cost Inflation
- 4.4.3 Cloud Cost Optimization and FinOps Pressure
- 4.4.4 Trade Policy and Semiconductor Supply Exposure
- 4.5 Industry Value Chain Analysis
- 4.5.1 Data Ingestion and Labeling
- 4.5.2 Feature Engineering and Feature Store Management
- 4.5.3 Model Development and Experimentation
- 4.5.4 Validation and Responsible AI Controls
- 4.5.5 Deployment and Serving
- 4.5.6 Monitoring, Observability, and Retraining
- 4.5.7 Integration, Support, and Managed Services
- 4.6 Regulatory Landscape
- 4.6.1 AI Governance and Model Risk Management Rules
- 4.6.2 Data Privacy and Cross-Border Data Transfer Requirements
- 4.6.3 Sector-Specific Compliance for BFSI, Healthcare, and Public Sector Deployments
- 4.6.4 Copyright, Provenance, and Foundation Model Usage Controls
- 4.7 Technological Outlook
- 4.7.1 Unified MLOps and LLMOps Control Planes
- 4.7.2 Multi-Cloud and Hybrid Orchestration
- 4.7.3 Feature Stores, Vector Stores, and Metadata Layers
- 4.7.4 Automated Evaluation, Guardrails, and Policy-as-Code
- 4.7.5 Edge and Real-Time Model Serving
- 4.8 Porter's Five Forces Analysis
- 4.8.1 Bargaining Power of Buyers
- 4.8.2 Bargaining Power of Suppliers
- 4.8.3 Threat of New Entrants
- 4.8.4 Threat of Substitutes
- 4.8.5 Intensity of Competitive Rivalry
5 MARKET SIZE AND GROWTH FORECASTS (VALUE)
- 5.1 By Component
- 5.1.1 Platform
- 5.1.1.1 Experiment Tracking and Collaboration
- 5.1.1.2 Pipeline Orchestration and CI/CD
- 5.1.1.3 Feature Store and Data Lineage
- 5.1.1.4 Model Registry and Versioning
- 5.1.1.5 Deployment and Serving
- 5.1.1.6 Monitoring and Observability
- 5.1.1.7 Governance and Responsible AI
- 5.1.2 Services
- 5.1.2.1 Consulting and Strategy
- 5.1.2.2 Implementation and Integration
- 5.1.2.3 Training and Enablement
- 5.1.2.4 Managed Services
- 5.1.2.5 Support and Maintenance
- 5.1.1 Platform
- 5.2 By Deployment Mode
- 5.2.1 Cloud
- 5.2.2 On-Premises
- 5.2.3 Hybrid
- 5.3 By Organization Size
- 5.3.1 Large Enterprises
- 5.3.2 Small and Medium-Sized Enterprises
- 5.4 By End-User Industry
- 5.4.1 BFSI
- 5.4.2 Healthcare and Life Sciences
- 5.4.3 IT and Telecom
- 5.4.4 Retail and E-commerce
- 5.4.5 Manufacturing
- 5.4.6 Government and Public Sector
- 5.4.7 Energy and Utilities
- 5.4.8 Media and Entertainment
- 5.4.9 Transportation and Logistics
- 5.4.10 Education and Research
- 5.5 By Geography
- 5.5.1 North America
- 5.5.1.1 United States
- 5.5.1.2 Canada
- 5.5.1.3 Mexico
- 5.5.2 South America
- 5.5.2.1 Brazil
- 5.5.2.2 Argentina
- 5.5.2.3 Chile
- 5.5.2.4 Rest of South America
- 5.5.3 Europe
- 5.5.3.1 Germany
- 5.5.3.2 United Kingdom
- 5.5.3.3 France
- 5.5.3.4 Italy
- 5.5.3.5 Spain
- 5.5.3.6 Russia
- 5.5.3.7 Netherlands
- 5.5.3.8 Rest of Europe
- 5.5.4 Asia-Pacific
- 5.5.4.1 China
- 5.5.4.2 Japan
- 5.5.4.3 India
- 5.5.4.4 South Korea
- 5.5.4.5 Singapore
- 5.5.4.6 Rest of Asia-Pacific
- 5.5.5 Middle East
- 5.5.5.1 Saudi Arabia
- 5.5.5.2 United Arab Emirates
- 5.5.5.3 Turkey
- 5.5.5.4 Israel
- 5.5.5.5 Rest of Middle East
- 5.5.6 Africa
- 5.5.6.1 South Africa
- 5.5.6.2 Egypt
- 5.5.6.3 Nigeria
- 5.5.6.4 Kenya
- 5.5.6.5 Rest of Africa
- 5.5.1 North America
6 COMPETITIVE LANDSCAPE
- 6.1 Market Concentration
- 6.2 Strategic Moves
- 6.3 Market Share Analysis
- 6.4 Company Profiles (includes Global Level Overview, Market Level Overview, Core Segments, Financials as available, Strategic Information, Market Rank/Share, Products and Services, Recent Developments)
- 6.4.1 Amazon Web Services, Inc.
- 6.4.2 Microsoft Corporation
- 6.4.3 Google LLC
- 6.4.4 IBM Corporation
- 6.4.5 Databricks, Inc.
- 6.4.6 DataRobot, Inc.
- 6.4.7 Domino Data Lab, Inc.
- 6.4.8 Dataiku SAS
- 6.4.9 H2O.ai, Inc.
- 6.4.10 Cloudera, Inc.
- 6.4.11 Hewlett Packard Enterprise Company
- 6.4.12 SAS Institute Inc.
- 6.4.13 Snowflake Inc.
- 6.4.14 Teradata Corporation
- 6.4.15 Seldon Technologies Ltd.
- 6.4.16 ClearML Inc.
- 6.4.17 Weights & Biases, Inc.
- 6.4.18 Neptune Labs Sp. z o.o.
- 6.4.19 Fiddler AI, Inc.
- 6.4.20 ModelOp, Inc.
- 6.4.21 Arize AI, Inc.
7 MARKET OPPORTUNITIES AND FUTURE OUTLOOK
- 7.1 White-Space and Unmet-Need Assessment
- 7.2 Future Outlook
 2026年全球對抗性學習市場報告
 全球醫療、法律和監管 (MLR) 審查軟體市場:按組件、部署模式、組織規模、功能和審查內容類型分類-市場規模、產業趨勢、機會分析及 2026 年至 2035 年預測
 2026-2030年全球機械客戶市場人工智慧和機器學習:雲端人工智慧人工智慧與機器學習:雲端人工智慧市場數據概覽:2026年第二季度人工智慧和機器學習:邊緣人工智慧AI和機器學習:TinyMLAI和機器學習:個人和商用設備人工智慧與機器學習:TinyML 市場數據概覽:2026 年第二季度
 機器學習即服務 (MLaaS) 市場:2026-2032 年全球市場預測(按服務模式、應用類型、產業、部署模式和組織規模分類)