

 |
市場調查報告書
商品編碼
2063895
西歐可再生能源:市場佔有率分析、產業趨勢與統計及成長預測(2026-2031 年)West Europe Renewable Energy - Market Share Analysis, Industry Trends & Statistics, Growth Forecasts (2026 - 2031) |
||||||
※ 本網頁內容可能與最新版本有所差異。詳細情況請與我們聯繫。
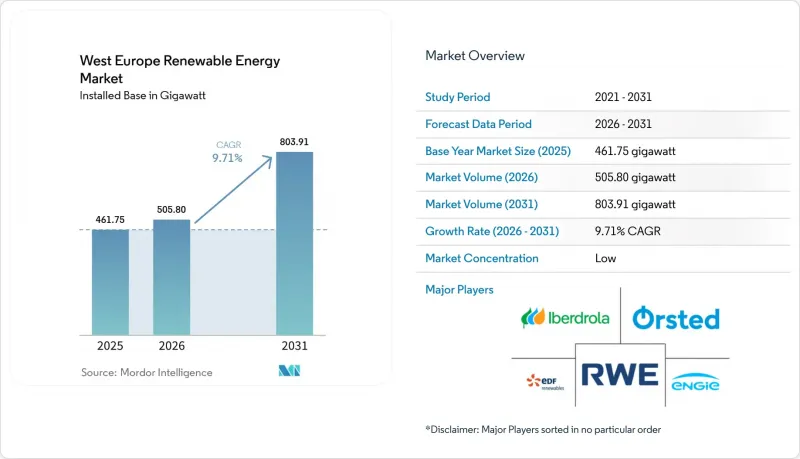
根據 Mordor Intelligence 預測,西歐可再生能源市場規模(以裝置容量計算)預計將從 2025 年的 461.75 吉瓦增至 2026 年的 505.80 吉瓦,到 2031 年達到 803.91 吉瓦,2026 年的複合成長率 203.31 年為 199.39%。
本報告按技術(太陽能、風能、水力、生質能源、海洋能)、最終用戶(公共產業、商業/工業、住宅)和地區(德國、英國、法國、愛爾蘭、荷蘭、比利時、盧森堡和其他西歐國家)進行分類。市場預測以容量(吉瓦)為單位。
西歐可再生能源市場的趨勢與洞察
歐盟綠色交易與2030年目標
根據歐盟再生能源計畫 (REPowerEU),歐盟委員會要求所有成員國到 2030 年實現 42.5% 的電力可再生能源佔比,並設定 45% 的上限。德國修訂後的氣候法規定,到 2030 年可再生能源佔比必須達到 80%,這意味著在 2025 年基準上,需要新增 115 吉瓦太陽能發電和 30 吉瓦離岸風力發電。愛爾蘭 900 兆瓦可再生能源太陽能系統 (ORESS) Tonn Nua 專案的競標結果已於 2025 年 12 月公佈,基準價格為 98,719 歐元/兆瓦時,支援該地區 15.50% 的複合年成長率。供熱和交通運輸領域的可再生能源子目標進一步增加了間接電力需求,而「可再生能源優先」區域預計將把授權前置作業時間從九年縮短到不到兩年。已在這些區域獲得土地的開發商可以獲得先發優勢,從而降低成本。
風能和太陽能的平準化度電成本快速下降
預計到2025年,歐洲可再生能源成本(LCOE)將下降7%,其中北海離岸風力發電專案計畫於2026年運作,其成本將降至50-60歐元/兆瓦時。由於排放權成本為每噸80歐元,燃氣發電廠的營業成本增加了40-50歐元/兆瓦時,這使得競爭格局向可再生能源傾斜。然而,在英國第七輪配額分配中,執行價格約為73英鎊/兆瓦時,截至2026年初,82個規劃項目中仍有75個尚未做出最終投資決定。德國現場太陽能購電協議(PPA)的平均合約期限為19年,比異地合約長7年,顯示企業買家越來越重視收入穩定性而非絕對成本。這一趨勢表明,儘管硬體成本下降,但利潤空間仍在受到擠壓,這意味著併網和價格對沖比單純的LCOE基準更為重要。
電網擁塞和互聯瓶頸
2024年,由於60太瓦時可再生能源發電發電量被削減或轉移,歐洲電力傳輸線路的重新調度成本高達43億歐元。同時,聯網線路的利用率停滯在54%,遠低於70%的監管目標。在德國南北走廊,石勒蘇益格-荷爾斯泰因州的離岸風力發電已經超過了巴伐利亞需求中心的輸電能力,導致每年高達8太瓦時的電力被削減。在英國,截至2026年初,82個離岸風力發電專案中只有7個最終確定了投資方案,與2030年55吉瓦的目標相比,仍有12.4吉瓦的缺口。這是因為港口和輸電網的升級改造比大多數資金籌措週期長6到10年。在荷蘭,由於陸上變電站的限制,TenneT公司已將其與北海的新連接推遲到2029年。這實際上將年度新增裝置容量限制在1.5吉瓦,而實現國家目標需要3吉瓦。這套頸部凸顯了「用戶側」太陽能發電和分散式電池儲能的戰略價值,因為它們可以完全繞過電網排隊。除非大規模電網現代化進程加快,否則併網限制預計將繼續使預期複合年成長率下降約1.4個百分點。
細分市場分析
儘管海洋能源在基準上小規模,但預計將以17.45%的複合年成長率(CAGR)在西歐可再生能源市場中實現最高成長。這一領域受益於莫爾萊30兆瓦的HydroWing潮汐能電站以及法國250兆瓦的在建項目,後者正從原型機過渡到多台渦輪機陣列。至2025年,太陽能發電將佔裝置容量的46.63%,專案儲備充足,平準化電力成本(LCOE)低於30歐元/兆瓦時。但由於土地徵用限制和對棄風棄光的擔憂,大型電站的新建設正在放緩。風能仍是大型發電的基礎能源,15兆瓦級渦輪機和浮體式基礎的普及使其地位穩固。水力發電和生質能源能將成為受監管的穩定能源,但由於歐洲的太陽輻射量適中,它們作為聚光太陽能發電(CSP)的佔有率仍然很小。
海上電力資產還能實現可預測的日間發電量,並便於夜間發電量調整,幫助輸電運營商在10吉瓦的部署規模下每年節省14.6億英鎊的系統成本。隨著容量市場規則的更新和電網支援收益的貨幣化,供應商融資已轉向專案支援債券。潮汐的可預測性、波浪能資源的規模以及修訂後的補償框架共同解釋了為什麼海上技術正在加速其對西方可再生能源市場規模的貢獻。像伊維爾德羅拉公司(Iberdrola)的274兆瓦風電+Tamega專案這樣的並聯抽水蓄能混合專案表明,受監管的可再生能源如何在不新建燃氣峰值電廠的情況下實現擴張。
其他好處
- Excel格式的市場預測(ME)表
- 3個月的分析師支持
目錄
第1章:引言
- 研究假設和市場定義
- 調查範圍
第2章:調查方法
第3章執行摘要
第4章 市場狀況
- 市場概覽
- 市場促進因素
- 歐盟綠色交易與2030年目標
- 風能和太陽能的平準化度電成本快速下降
- 公司間購電協議激增
- 強制安裝電池供電設備(2025 年改革)
- 與氫相關的可再生能源項目
- 指數掛鉤差價合約競標
- 市場限制因素
- 輸電網路擁塞和電網連接瓶頸
- 冗長的許可程序
- 稀土元素和安裝船短缺
- 農地利用:反對大規模太陽能發電
- 供應鏈分析
- 監理情勢
- 技術展望
- 波特五力模型
第5章 市場規模與成長預測
- 透過技術
- 太陽能發電(光伏和聚光太陽能)
- 風力發電(陸上和海上)
- 水力發電(小規模、大型、抽水蓄能)
- 生質能源
- 地熱
- 海洋能源(潮汐能和波浪能)
- 最終用戶
- 公共產業
- 商業和工業
- 住宅
- 按地區
- 德國
- 英國
- 法國
- 愛爾蘭
- 荷蘭
- 比利時
- 盧森堡
- 其他西歐國家
第6章 競爭情勢
- 市場集中度
- 策略性措施(併購、合資、資金籌措、購電協議)
- 市場佔有率分析(主要公司的市場排名和佔有率)
- 公司簡介
- Orsted A/S
- Iberdrola SA
- EDF Renewables(Electricite de France)
- Engie SA
- RWE Renewables GmbH
- Vestas Wind Systems A/S
- Siemens Gamesa Renewable Energy SA
- TotalEnergies SE
- Enel Green Power SpA
- Statkraft AS
- General Electric Co.(GE Vernova)
- Renewable Energy Systems Ltd.(RES)
- Nordex SE
- ACCIONA Energia
- BayWa re AG
- EDP Renovaveis
- Lightsource BP
- Equinor ASA
- JinkoSolar Holding Co. Ltd.
- Ecotricity Group Ltd.
第7章 市場機會與未來展望
According to Mordor Intelligence, the west europe renewable energy market size in terms of installed base is expected to increase from 461.75 gigawatt in 2025 to 505.80 gigawatt in 2026 and reach 803.91 gigawatt by 2031, growing at a CAGR of 9.71% over 2026-2031.
This report is Segmented by Technology (Solar Energy, Wind Energy, Hydropower, Bioenergy, Geothermal, Ocean Energy), End-User (Utilities, Commercial and Industrial, Residential), and Geography (Germany, United Kingdom, France, Ireland, Netherlands, Belgium, Luxembourg, Rest of West Europe). Market Forecasts are Provided in Terms of Volume (GW).
West Europe Renewable Energy Market Trends and Insights
EU Green Deal & 2030 Targets
The European Commission requires every member state to meet a 42.5% renewable-electricity share by 2030, with an aspirational 45% ceiling under REPowerEU. Germany's updated climate act mandates 80% renewable power by 2030, demanding a further 115 GW of solar and 30 GW of offshore wind beyond 2025 baselines. Ireland's 900 MW ORESS Tonn Nua award in December 2025 set a benchmark price of EUR 98.719/MWh, underpinning a 15.50% geographic CAGR. Sectoral sub-targets for renewable heat and transport intensify indirect electricity demand, while "renewables-go-to" areas promise to cut permitting lead-times from nine years to fewer than two. Developers that have already secured land in these zones gain a first-mover cost advantage.
Rapid LCOE Decline for Wind & Solar
Europe's average renewable LCOE fell 7% in 2025, with offshore wind in the North Sea dipping to EUR 50-60/MWh for 2026-bound projects . At EUR 80/tonne, emission-allowance costs add EUR 40-50/MWh to gas-plant dispatch, pivoting competitiveness toward renewables. However, U.K. Allocation Round 7 strike prices near GBP 73/MWh still left 75 of 82 pipeline projects without final investment decisions as of early 2026 . Corporate buyers increasingly prize revenue stability over absolute cost, as demonstrated by German on-site solar PPAs averaging 19-year terms seven years longer than off-site deals. The pattern reveals margin compression despite falling hardware costs, meaning grid access and price hedging now trump pure LCOE benchmarks.
Grid Congestion & Interconnection Bottlenecks
Europe's transmission redispatch costs reached EUR 4.3 billion in 2024 after 60 TWh of renewable output was curtailed or rerouted, while cross-border interconnector utilization stalled at 54 % against the 70 % target set by regulators. Germany's north-south corridor already curtails up to 8 TWh a year because offshore wind in Schleswig-Holstein overwhelms grid capacity to Bavarian demand centers . In the U.K., only 7 of 82 offshore-wind projects reached final investment decision by early 2026, exposing a 12.4 GW gap to the 55 GW 2030 goal because port and grid upgrades require 6-10 years longer than most financing windows. The Netherlands' TenneT delayed new North Sea connections until 2029 owing to onshore substation constraints, effectively capping annual additions at 1.5 GW versus the 3 GW pace needed to hit national targets. These bottlenecks elevate the strategic value of behind-the-meter solar and distributed batteries that bypass transmission queues altogether. Unless large-scale grid modernization accelerates, interconnection caps will continue to shave roughly 1.4 percentage points from forecast CAGR.
Other drivers and restraints analyzed in the detailed report include:
- Corporate PPAs Surge
- Battery-ready Co-location Mandates (2025 reform)
- Lengthy Permitting Procedures
For complete list of drivers and restraints, kindly check the Table Of Contents.
Segment Analysis
Ocean energy held a modest baseline yet is forecast to grow at 17.45% CAGR, the fastest rate among technologies in the West Europe renewable energy market . The segment benefits from the 30 MW HydroWing tidal array at Morlais and France's 250 MW pipeline moving from prototype toward multi-turbine arrays. Solar retained 46.63% of installed capacity in 2025 as sub-EUR 30/MWh LCOE kept project pipelines full, although land limits and curtailment headwinds slow incremental utility-scale builds. Wind power, bolstered by 15 MW turbines and floating foundations, remains the foundational bulk-capacity provider. Hydropower and bioenergy supply dispatchable stability, while CSP's share stays negligible owing to Europe's moderate direct normal irradiance.
Ocean assets also enable predictable diurnal output that eases evening ramps, helping transmission operators cut system costs by GBP 1.46 billion annually at 10 GW deployment. Vendor financing has shifted toward project-backed bonds once grid-support benefits are monetized under updated capacity-market rules. The confluence of tidal predictability, wave resource scale, and updated remuneration frameworks explains the accelerating contribution of ocean technologies to the West Europe renewable energy market size. Parallel pumped-storage hybrids, such as Iberdrola's 274 MW wind-plus-Tamega scheme, showcase how dispatchable renewables are expanding without adding new gas peakers.
List of Companies Covered in this Report:
- Orsted A/S
- Iberdrola SA
- EDF Renewables (Electricite de France)
- Engie SA
- RWE Renewables GmbH
- Vestas Wind Systems A/S
- Siemens Gamesa Renewable Energy SA
- TotalEnergies SE
- Enel Green Power SpA
- Statkraft AS
- General Electric Co. (GE Vernova)
- Renewable Energy Systems Ltd. (RES)
- Nordex SE
- ACCIONA Energia
- BayWa r.e. AG
- EDP Renovaveis
- Lightsource BP
- Equinor ASA
- JinkoSolar Holding Co. Ltd.
- Ecotricity Group Ltd.
Additional Benefits:
- The market estimate (ME) sheet in Excel format
- 3 months of analyst support
TABLE OF CONTENTS
1 Introduction
- 1.1 Study Assumptions & Market Definition
- 1.2 Scope of the Study
2 Research Methodology
3 Executive Summary
4 Market Landscape
- 4.1 Market Overview
- 4.2 Market Drivers
- 4.2.1 EU Green Deal & 2030 Targets
- 4.2.2 Rapid LCOE Decline for Wind & Solar
- 4.2.3 Corporate PPAs Surge
- 4.2.4 Battery-ready Co-location Mandates (2025 reform)
- 4.2.5 Hydrogen-linked Renewable Projects
- 4.2.6 Indexed CfD-style Auctions
- 4.3 Market Restraints
- 4.3.1 Grid Congestion & Interconnection Bottlenecks
- 4.3.2 Lengthy Permitting Procedures
- 4.3.3 Rare-earth & Installation Vessel Shortages
- 4.3.4 Farmland-use Opposition to Utility Solar
- 4.4 Supply-Chain Analysis
- 4.5 Regulatory Landscape
- 4.6 Technological Outlook
- 4.7 Porter's Five Forces
- 4.7.1 Bargaining Power of Suppliers
- 4.7.2 Bargaining Power of Buyers
- 4.7.3 Threat of New Entrants
- 4.7.4 Threat of Substitutes
- 4.7.5 Competitive Rivalry
5 Market Size & Growth Forecasts
- 5.1 By Technology
- 5.1.1 Solar Energy (PV and CSP)
- 5.1.2 Wind Energy (Onshore and Offshore)
- 5.1.3 Hydropower (Small, Large, PSH)
- 5.1.4 Bioenergy
- 5.1.5 Geothermal
- 5.1.6 Ocean Energy (Tidal and Wave)
- 5.2 By End-User
- 5.2.1 Utilities
- 5.2.2 Commercial and Industrial
- 5.2.3 Residential
- 5.3 By Geography
- 5.3.1 Germany
- 5.3.2 United Kingdom
- 5.3.3 France
- 5.3.4 Ireland
- 5.3.5 Netherlands
- 5.3.6 Belgium
- 5.3.7 Luxembourg
- 5.3.8 Rest of West Europe
6 Competitive Landscape
- 6.1 Market Concentration
- 6.2 Strategic Moves (M&A, JVs, Funding, PPAs)
- 6.3 Market Share Analysis (Market Rank/Share for key companies)
- 6.4 Company Profiles (includes Global-level Overview, Market-level Overview, Core Segments, Financials, Strategic Information, Products & Services, Recent Developments)
- 6.4.1 Orsted A/S
- 6.4.2 Iberdrola SA
- 6.4.3 EDF Renewables (Electricite de France)
- 6.4.4 Engie SA
- 6.4.5 RWE Renewables GmbH
- 6.4.6 Vestas Wind Systems A/S
- 6.4.7 Siemens Gamesa Renewable Energy SA
- 6.4.8 TotalEnergies SE
- 6.4.9 Enel Green Power SpA
- 6.4.10 Statkraft AS
- 6.4.11 General Electric Co. (GE Vernova)
- 6.4.12 Renewable Energy Systems Ltd. (RES)
- 6.4.13 Nordex SE
- 6.4.14 ACCIONA Energia
- 6.4.15 BayWa r.e. AG
- 6.4.16 EDP Renovaveis
- 6.4.17 Lightsource BP
- 6.4.18 Equinor ASA
- 6.4.19 JinkoSolar Holding Co. Ltd.
- 6.4.20 Ecotricity Group Ltd.
7 Market Opportunities & Future Outlook
- 7.1 White-Space & Unmet-Need Assessment
 企業購電協議 (PPA) 平台市場預測至 2034 年—按合約類型、合約期限、能源來源、買方類型、平台模式和地區分類的全球分析農業用電動推進器市場預測至2034年-按系統類型、組件、技術、應用、最終用戶和地區分類的全球分析
 可再生能源市場-全球產業規模、佔有率、趨勢、機會與預測:按類型、最終用途產業、地區和競爭格局分類,2021-2031年混合電池市場-全球產業規模、佔有率、趨勢、機會和預測:按產品類型、額定功率、最終用戶、連接方式、地區和競爭格局分類,2021-2031年
 東亞可再生能源:市場佔有率分析、產業趨勢與統計及成長預測(2026-2031年)
 可再生能源領域的人工智慧市場:按組件、能源類型、部署模式、最終用戶、國家和地區分類-全球產業分析、市場規模、市場佔有率及2026年至2033年預測
 2026-2030年全球可再生能源市場
 可再生能源保險市場機會、成長要素、產業趨勢分析及2026-2035年預測
 新一輪石油危機:推動通訊業者轉向可再生能源
 可再生能源市場規模、佔有率、成長及全球產業分析:按類型、應用和地區分類的洞察,2026-2034 年預測