

 |
市場調查報告書
商品編碼
2073421
西班牙可再生能源:市場佔有率分析、產業趨勢與統計及成長預測(2026-2031 年)Spain Renewable Energy - Market Share Analysis, Industry Trends & Statistics, Growth Forecasts (2026 - 2031) |
||||||
※ 本網頁內容可能與最新版本有所差異。詳細情況請與我們聯繫。
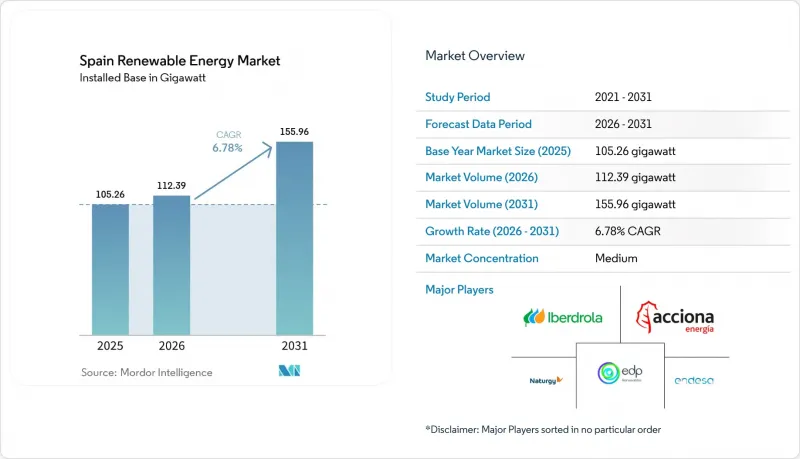
根據Mordor Intelligence預測,西班牙可再生能源市場規模預計在2026年達到112.39吉瓦,高於2025年的105.26吉瓦。預計到2031年將達到155.96吉瓦,並且從2026年到2031年的複合年成長率將達到6.78%。
本報告按技術(太陽能、風能、水力發電、生質能源、地熱能和海洋能)和最終用戶(公共產業、商業和工業以及住宅)進行細分。市場規模和預測以裝置容量(吉瓦)為單位。
西班牙可再生能源市場趨勢與洞察
太陽能發電的平準化電力成本(LCOE)正在下降。
2024年,公用事業規模太陽能發電的平均平準化度電成本(LCOE)為每兆瓦時29歐元,在所有主要地區均低於聯合循環燃氣發電的成本。這項成本優勢歸功於雙面組件和單軸追蹤系統的普及,這些技術可將發電量提高高達20%,以及來自中國的新興參與企業極具競爭力的EPC(工程、採購和施工)定價策略。共享自用政策也使類似的經濟效益擴展到都市區屋頂光電發電,2024年屋頂光電裝置增加了30%。由於太陽能發電的加速普及,批發價格預計將下降,這將威脅到火力發電廠的獲利能力,並可能加速燃煤發電廠的淘汰。然而,針對亞洲組件進口的反傾銷調查可能會擾亂成本下降的趨勢。儘管如此,投資轉向商業項目和購電協議(PPA)支持的項目,正在減少對政府競標的依賴,並表明人們對太陽能發電的長期競爭力越來越有信心。
陸域風力發電能力快速擴張
利用15兆瓦級平台對2000年代初期安裝的風力發電機進行改造,使裝置容量利用率提高了約40%,同時緩和了飽和地區的土地利用緊張局勢。開發商透過與資料中心和鋼鐵製造商簽訂長期購電協議(PPA),獲得了低於4%的貸款利率,從而將供應風險轉移到下游。然而,由於缺乏待開發區場地以及鳥類保護區的存在,開發活動已轉向在加利西亞和加那利群島沿海地區試點建設浮體式海上風電項目,預計其中3吉瓦的裝機容量將在本十年後半期投入運作。簡化環境評估流程對於西班牙實現年均淨增加5吉瓦風電裝置容量的目標,最終邁向2030年達到62吉瓦的目標仍然至關重要。
電網擁塞和減產風險
2023年,棄電數量較前一年增加了兩倍;2024年,尖峰時段白天有1.2吉瓦的太陽能和風能發電裝置容量被迫關閉,導致1.8億歐元的收入損失。 REE的擴建計畫包括新建2,500公里輸電線路和15座變電站,但土地徵用速度跟不上發電裝置容量的成長,這將在2027年之前造成限制。配套的電池儲能專案在一定程度上彌補了發電損失,但由於往返效率和成本方面的挑戰,其應用受到限制。目前,一項優先發展混合發電設施的試點計畫正在實施,這表明未來獨立太陽能發電的盈利將面臨更大的挑戰。
細分市場分析
到2025年,西班牙太陽能發電裝置容量將佔總裝置容量的42.62%,鞏固其在西班牙可再生能源市場的主導地位。安達盧西亞和埃斯特雷馬杜拉的公用事業規模項目,由於太陽輻射量超過2000千瓦時/平方米,預計到2031年,該領域的複合年成長率將達到10.09%。到本世紀末,西班牙可再生能源市場中太陽能發電的規模預計將增加約35吉瓦,這反映出其在競爭能源來源中最低的平準化度電成本(LCOE)。風能是第二大支柱。卡斯蒂利亞-拉曼恰和阿拉貢的陸上風電場已實現28-32%的裝置容量利用率,而加利西亞和加那利群島沿海的3吉瓦浮動式風力發電計畫正在爭取最終許可。水力發電供應 20 吉瓦,其中 5.3 吉瓦為抽水蓄能水力發電,這構成了柔軟性的基礎,但其缺點是容易受到乾旱導致的入流波動的影響。
儘管投資者因其高成本競爭力而青睞太陽能和風能,但技術多元化仍然至關重要。聚光型太陽熱能發電(CSP)透過整合儲熱功能來緩解價格波動,從而能夠在晚間用電高峰時段提供電力。生質能源、地熱能和海洋能的總合供應量仍低於2吉瓦,這主要是由於原料供應和資源品質的限制,以及這些能源技術尚處於早期成熟階段。然而,抽水蓄能水力發電廠的擴張以及與電池儲能的混合應用表明,能源結構正朝著平衡間歇性並提高系統可靠性的綜合能源組合發展。
其他好處:
- Excel格式的市場預測(ME)表
- 3個月的分析師支持
目錄
第1章:引言
- 研究假設和市場定義
- 調查範圍
第2章:調查方法
第3章執行摘要
第4章 市場狀況
- 市場概覽
- 市場促進因素
- 降低太陽能發電的平準化成本
- 陸域風力發電設施快速擴張
- 歐盟的「適合55歲」計劃和西班牙的PNIEC 2023目標。
- 能源密集型產業公司之間的購電協議(PPA)
- 綠氫能出口中心概念
- 橫跨法國和葡萄牙邊境的輸電線路
- 市場限制因素
- 電網擁塞和減產風險
- 環境評估和授權流程前置作業時間很長。
- 2025年及以後調整市場收益的波動性
- 電池用鋰供應的不確定性
- 供應鏈分析
- 監理情勢
- 技術展望
- 波特五力模型
- PESTLE分析
第5章 市場規模與成長預測
- 透過技術
- 太陽能(光伏和聚光太陽能)
- 風力發電(陸上和海上)
- 水力發電(小規模、大型、抽水蓄能)
- 生質能源
- 地熱
- 海洋能源(潮汐能和波浪能)
- 最終用戶
- 公用事業
- 商業和工業用途
- 住宅
第6章 競爭情勢
- 市場集中度
- 策略性措施(併購、合資、資金籌措、購電協議)
- 市場佔有率分析(主要公司的市場排名和市場佔有率)
- 公司簡介
- Iberdrola SA
- Acciona Energia SA
- Siemens Gamesa Renewable Energy SA
- Endesa SA
- Naturgy Energy Group SA
- EDP Renovaveis(EDPR)
- Cobra Group(ACS)
- Red Electrica Corporacion SA(REE)
- Solaria Energia y Medio Ambiente SA
- JinkoSolar Holding Co. Ltd(Spain)
- Vestas Wind Systems Spain
- Enel Green Power Espana
- Grenergy Renovables
- Forestalia Renovables
- Capital Energy
- Repsol Renovables
- Solarpack Corporacion
- X-Elio
- Abengoa Solar
- IM2 Systems SLU
第7章 市場機會與未來展望
According to Mordor Intelligence, spain renewable energy market size in 2026 is estimated at 112.39 gigawatt, growing from 2025 value of 105.26 gigawatt with 2031 projections showing 155.96 gigawatt, growing at 6.78% CAGR over 2026-2031.
This report is Segmented by Technology (Solar Energy, Wind Energy, Hydropower, Bioenergy, Geothermal, and Ocean Energy) and End-User (Utilities, Commercial and Industrial, and Residential). The Market Sizes and Forecasts are Provided in Terms of Installed Capacity (GW).
Spain Renewable Energy Market Trends and Insights
Declining Levelized Cost of Solar PV
Utility-scale solar delivered an average LCOE of EUR 29 per MWh in 2024, undercutting combined-cycle gas generation in every major node. The cost advantage reflects widespread adoption of bifacial modules and single-axis tracking that lifts yields by up to 20%, as well as aggressive EPC pricing from new Chinese entrants. Collective self-consumption rules have translated the same economics into urban rooftops, where installations expanded by 30% during 2024. Lower wholesale prices, expected from accelerated solar additions, threaten thermal margins and hasten coal retirements; however, anti-dumping probes on Asian module imports could disrupt the downward cost curve. Even so, the investment shift toward merchant or PPA-backed projects reduces dependence on government auctions and signals rising confidence in the long-term competitiveness of solar energy.
Rapid Build-Out of Onshore Wind Capacity
The repowering of early-2000s turbines using 15 MW platforms has increased capacity factors by approximately 40%, while alleviating land-use tensions in saturated regions. Developers secure sub-4% debt through long-tenor PPAs with data-center and steel offtakers, transferring volumetric risk downstream. Nonetheless, limited greenfield sites and avian-protection zones push activity toward floating offshore pilots off Galicia and the Canary Islands, where 3 GW is slated for commissioning late in the decade. Streamlined environmental reviews remain essential if Spain is to achieve an average of 5 GW of net wind additions each year and stay aligned with its 2030 target of 62 GW.
Grid Congestion and Curtailment Risk
Curtailment events tripled year-over-year in 2023 and forced 1.2 GW of solar and wind capacity offline during midday peaks in 2024, erasing EUR 180 million in revenue. REE's expansion plan encompasses 2,500 kilometers of new lines and 15 substations; however, land acquisition lags behind capacity additions, resulting in constraints through 2027. Co-located battery projects partly offset lost output; however, round-trip efficiency and cost hurdles limit their uptake. A pilot dispatch regime now prioritizes hybrid assets, signaling tougher economics ahead for standalone solar.
Other drivers and restraints analyzed in the detailed report include:
- EU Fit-for-55 and PNIEC 2023 Targets
- Corporate PPAs from Energy-Intensive Industries
- Lengthy Environmental and Permitting Lead-Times
For complete list of drivers and restraints, kindly check the Table Of Contents.
Segment Analysis
Spain Solar energy accounted for 42.62% of installed capacity in 2025, confirming its leadership within the Spanish renewable energy market. Utility-scale projects in Andalusia and Extremadura, where irradiance exceeds 2,000 kWh / m2, underpin the segment's 10.09% CAGR outlook through 2031. The Spain renewable energy market size for solar is forecast to add roughly 35 GW by the decade's close, reflecting the lowest LCOE across competing resources. Wind follows as the second-largest pillar; onshore parks in Castilla-La Mancha and Aragon deliver capacity factors of 28-32%, while a 3 GW floating portfolio off Galicia and the Canary Islands seeks final permits. Hydropower supplies 20 GW, with 5.3 GW of pumped storage acting as a flexibility backbone, yet it is vulnerable to drought-driven inflow variability.
Cost competitiveness drives investor preference toward solar and wind, but technological diversification remains essential. CSP plants provide thermal storage and extend dispatch into evening peaks, mitigating price cannibalization. Bioenergy, geothermal, and ocean energy collectively contribute less than 2 GW, primarily due to limited feedstock availability, resource quality, and the nascent stage of technology readiness. Nevertheless, pumped storage expansions and battery hybrids signal a trend toward integrated resource portfolios that balance intermittency and bolster system reliability.
Complete Report Scope:
- By Technology
- Solar Energy (PV and CSP)
- Wind Energy (Onshore and Offshore)
- Hydropower (Small, Large, PSH)
- Bioenergy
- Geothermal
- Ocean Energy (Tidal and Wave)
- By End-User
- Utilities
- Commercial and Industrial
- Residential
List of Companies Covered in this Report:
- Iberdrola SA
- Acciona Energia SA
- Siemens Gamesa Renewable Energy SA
- Endesa SA
- Naturgy Energy Group SA
- EDP Renovaveis (EDPR)
- Cobra Group (ACS)
- Red Electrica Corporacion SA (REE)
- Solaria Energia y Medio Ambiente SA
- JinkoSolar Holding Co. Ltd (Spain)
- Vestas Wind Systems Spain
- Enel Green Power Espana
- Grenergy Renovables
- Forestalia Renovables
- Capital Energy
- Repsol Renovables
- Solarpack Corporacion
- X-Elio
- Abengoa Solar
- IM2 Systems SLU
Additional Benefits:
- The market estimate (ME) sheet in Excel format
- 3 months of analyst support
TABLE OF CONTENTS
1 Introduction
- 1.1 Study Assumptions & Market Definition
- 1.2 Scope of the Study
2 Research Methodology
3 Executive Summary
4 Market Landscape
- 4.1 Market Overview
- 4.2 Market Drivers
- 4.2.1 Declining levelized cost of solar PV
- 4.2.2 Rapid build-out of on-shore wind capacity
- 4.2.3 EU Fit-for-55 & Spain's PNIEC 2023 targets
- 4.2.4 Corporate PPAs from energy-intensive industries
- 4.2.5 Green-hydrogen export hub initiatives
- 4.2.6 Cross-border interconnectors with France & Portugal
- 4.3 Market Restraints
- 4.3.1 Grid congestion & curtailment risk
- 4.3.2 Lengthy environmental/permitting lead-times
- 4.3.3 Balancing-market revenue volatility post 2025
- 4.3.4 Battery-grade lithium supply uncertainty
- 4.4 Supply-Chain Analysis
- 4.5 Regulatory Landscape
- 4.6 Technological Outlook
- 4.7 Porter's Five Forces
- 4.7.1 Threat of New Entrants
- 4.7.2 Bargaining Power of Buyers
- 4.7.3 Bargaining Power of Suppliers
- 4.7.4 Threat of Substitutes
- 4.7.5 Competitive Rivalry
- 4.8 PESTLE Analysis
5 Market Size & Growth Forecasts
- 5.1 By Technology
- 5.1.1 Solar Energy (PV and CSP)
- 5.1.2 Wind Energy (Onshore and Offshore)
- 5.1.3 Hydropower (Small, Large, PSH)
- 5.1.4 Bioenergy
- 5.1.5 Geothermal
- 5.1.6 Ocean Energy (Tidal and Wave)
- 5.2 By End-User
- 5.2.1 Utilities
- 5.2.2 Commercial and Industrial
- 5.2.3 Residential
6 Competitive Landscape
- 6.1 Market Concentration
- 6.2 Strategic Moves (M&A, JVs, Funding, PPAs)
- 6.3 Market Share Analysis (Market Rank/Share for key companies)
- 6.4 Company Profiles (includes Global-level Overview, Market-level Overview, Core Segments, Financials, Strategic Information, Products & Services, Recent Developments)
- 6.4.1 Iberdrola SA
- 6.4.2 Acciona Energia SA
- 6.4.3 Siemens Gamesa Renewable Energy SA
- 6.4.4 Endesa SA
- 6.4.5 Naturgy Energy Group SA
- 6.4.6 EDP Renovaveis (EDPR)
- 6.4.7 Cobra Group (ACS)
- 6.4.8 Red Electrica Corporacion SA (REE)
- 6.4.9 Solaria Energia y Medio Ambiente SA
- 6.4.10 JinkoSolar Holding Co. Ltd (Spain)
- 6.4.11 Vestas Wind Systems Spain
- 6.4.12 Enel Green Power Espana
- 6.4.13 Grenergy Renovables
- 6.4.14 Forestalia Renovables
- 6.4.15 Capital Energy
- 6.4.16 Repsol Renovables
- 6.4.17 Solarpack Corporacion
- 6.4.18 X-Elio
- 6.4.19 Abengoa Solar
- 6.4.20 IM2 Systems SLU
7 Market Opportunities & Future Outlook
- 7.1 White-space & unmet-need assessment
 義大利可再生能源:市場佔有率分析、產業趨勢與統計及成長預測(2026-2031 年)
 企業購電協議 (PPA) 平台市場預測至 2034 年—按合約類型、合約期限、能源來源、買方類型、平台模式和地區分類的全球分析海洋溫差發電(OTEC)市場預測—按組件、安裝地點、技術、應用、最終用戶和地區分類的全球分析—2034年農業用電動推進器市場預測至2034年-按系統類型、組件、技術、應用、最終用戶和地區分類的全球分析可再生能源保險:市場佔有率分析、產業趨勢與統計、成長預測(2026-2031 年)
 可再生能源市場-全球產業規模、佔有率、趨勢、機會與預測:按類型、最終用途產業、地區和競爭格局分類,2021-2031年混合電池市場-全球產業規模、佔有率、趨勢、機會和預測:按產品類型、額定功率、最終用戶、連接方式、地區和競爭格局分類,2021-2031年東亞可再生能源:市場佔有率分析、產業趨勢與統計及成長預測(2026-2031年)
 可再生能源領域的人工智慧市場:按組件、能源類型、部署模式、最終用戶、國家和地區分類-全球產業分析、市場規模、市場佔有率及2026年至2033年預測西歐可再生能源:市場佔有率分析、產業趨勢與統計及成長預測(2026-2031 年)