

 |
市場調查報告書
商品編碼
2073359
可再生能源保險:市場佔有率分析、產業趨勢與統計、成長預測(2026-2031 年)Renewable Energy Insurance - Market Share Analysis, Industry Trends & Statistics, Growth Forecasts (2026 - 2031) |
||||||
※ 本網頁內容可能與最新版本有所差異。詳細情況請與我們聯繫。
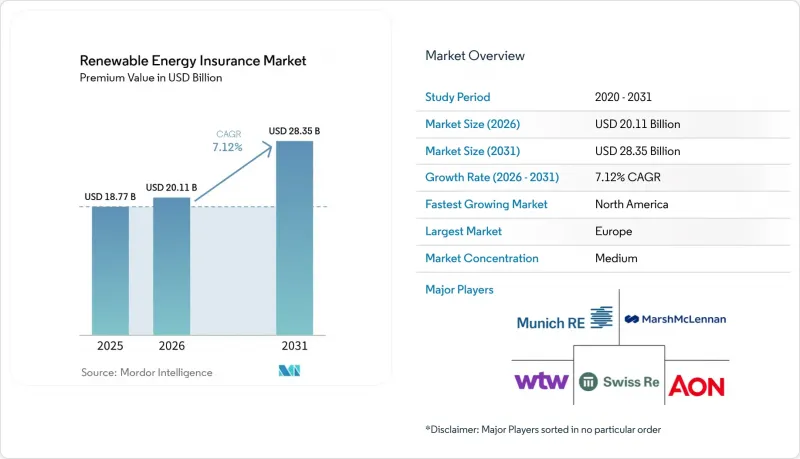
根據 Mordor Intelligence 預測,以保費計算,可再生能源保險市場規模預計在 2025 年達到 187.7 億美元,2026 年達到 201.1 億美元,到 2031 年達到 283.5 億美元,2026 年至 2031 年的複合成長率 7.12%。
本報告按保險類型(財產損失和業務中斷險、綜合建築保險/安裝保險等)、可再生能源技術(陸上風電、離岸風電、公用事業規模太陽能發電等)、最終用戶(公用事業規模獨立發電商和業主、商業和工業運營商等)以及地區進行細分。市場預測以美元計價。
全球可再生能源保險市場趨勢與洞察
全球公用事業規模太陽能和風能資產的擴張
吉瓦級可再生能源部署的激增推動了對超越傳統財產保險的複雜保險方案的需求。瑞士再保險公司參與菲律賓一個3500兆瓦太陽能發電和儲能綜合項目的再保險,生動地展現瞭如今大型清潔能源大型企劃普遍存在的規模和複雜性。保險架構必須涵蓋所有建設風險、營運績效保證以及數十年的收益穩定性,同時也要應對地域集中化所帶來的關聯損失風險。保險公司正透過提高承保上限、精細化災害建模以及將損失賠償與指數支付相結合的多重觸發機制來應對這項挑戰。隨著亞太地區和北美地區專案儲備的加速成長,這已成為可再生能源保險市場總保費成長的最大正面促進因素。
自然災害造成的損失日益增加,推動了風險轉移的需求。
與可再生能源相關的自然災害造成的損失正在激增,光是2022年美國就因冰雹對太陽能發電系統的損害支付了3億美元。雖然冰雹災害僅佔所有災害的6%,但卻造成了太陽能發電系統70%以上的損失。這種不對稱的風險狀況迫使保險公司轉向參數化解決方案,根據冰雹直徑和動能閾值觸發賠付,而開發商也在採取預防措施,例如自動化存儲裝置。不斷上升的損失率和專門的再保險定價形成了一個反饋循環,推高了保費,但與此同時,可再生能源保險市場中差異化產品的客戶群也在擴大。
整個可再生能源產業的承保能力下降,保險費上漲。
由於一系列自然災害導致保險索賠激增,許多保險公司正在縮減承保能力或退出某些風險領域,從而導致保費大幅上漲。根據GCube的數據顯示,美國太陽能發電風險的保費已從每100美元保額10美分飆升至30美分。這項急劇上漲反映出可再生能源專案承保面臨的巨大挑戰,尤其是在自然災害易發地區。此外,隨著主險保險公司被迫將這些增加的成本轉嫁給投保人。中小開發商在應對不斷上漲的免賠額方面面臨挑戰,可能會推遲項目,直到獲得更有利的承保能力。此類延誤可能會在短期內影響可再生能源的部署速度。雖然專注於參數化解決方案的新興參與企業正在進入市場填補這一空白,但需要大量股本的傳統財產保險的承保能力仍然有限,預計到 2026 年價格仍將居高不下。承保能力的限制和飆升的保險費凸顯了創新風險轉移機制對於支持可再生能源產業發展的必要性。
細分市場分析
到2025年,財產損失和業務中斷保險將佔保費的37.74%,在可再生能源保險市場佔據最大佔有率。對於需要從建設階段到20年營運階段的資產級保障的貸款機構而言,這些保險仍然至關重要。然而,由於買家在發生不涉及實體損失的業務中斷事件(例如風能資源短缺)時尋求快速資金籌措,預計到2031年,參數型保險的複合年成長率將達到9.92%,在所有產品中成長率最高。建築風險保險和安裝風險保險預計將繼續發揮重要作用,尤其是在涉及自升式平台和深海基礎的海上項目中。涵蓋第三方和環境風險的責任責任險形式正在不斷發展,納入了關於漸進性污染和野生動物棲息地的條款。隨著可再生能源產業向控制系統數位轉型,先前被排除在傳統財產保險條款之外的綜合風險正在增加,網路技術領域的疏忽和遺漏(E&O)保險也在穩步擴展。這些趨勢凸顯了保險公司必須具備的先進應對力,以滿足可再生能源保險市場不斷變化的需求。
創新方法包括太陽輻射對沖、冰雹損害參數觸發機制以及野火煙霧停電指數,這些方法可以彌補分散式能源資源生產能力的不足。保險公司正擴大將參數層納入傳統的財產保險保單中,當免賠額對利潤造成壓力時,這些參數層就會啟動。仲介表示,這些複雜的結構透過為發起人提供近乎即時的流動性選擇,同時滿足貸款機構規定的承保要求,提高了貸款的可行性。這種轉變正在重新思考保費分配方式,並擴大可再生能源保險市場,以滿足兼顧財產損失和收益穩定性的混合型產品需求。
區域分析
2025年,歐洲保費市場佔有率將維持在29.74%,這得益於其嚴格的氣候風險揭露體係以及已建立的公私合營自然災害基金,該基金為保險公司的資產負債表提供了保障。該地區離岸風力發電的成熟發展提升了精算可信度,從而實現了具有競爭力的價格並降低了發起人的資本成本。丹麥、德國和荷蘭的創新中心正在加速引入參數型冰雹險和低風速指數險,進一步擴大了歐洲在可再生能源保險市場的影響力。
北美是成長最快的地區,年複合成長率高達 8.93%,這主要得益於《通貨膨脹抑制法案》的獎勵以及諸如 Marsh 的稅務、投資和違約保險等客製化解決方案,這些方案可在稅額扣抵抵免不足的情況下保護投資者。然而,中西部地區毀滅性的冰雹災害和加州的野火給免責事項能力帶來了壓力,導致一些保險公司降低了總承保限額或對每個風險類別設定了最低承保額。開發商則透過提高免賠額和推出多層專屬式來應對,以維持其資金籌措能力。儘管面臨這些不利因素,再生能源保險市場仍在持續可再生,這得益於美國和加拿大各州為電網現代化和電池能源儲存系統(BESS) 部署提供的資金支持。
亞太地區正崛起為重要的需求中心。僅在中國,吉瓦級太陽能和海上太陽能電站就陸續投入運作,由此產生的再保險合約總限額超過10億美元。瑞士再保險公司參與菲律賓一個集太陽能發電和儲能於一體的大型企劃,充分展現了這一市場機會的規模。東南亞國家採用混合融資模式,依賴銀行擔保的保險結構來吸引國際資本。從易受颱風侵襲的沿海地區到受季風影響的內陸地區,各地監管環境和極端氣候條件各不相同,迫使保險公司製定區域性風險地圖,從而促進可再生能源保險市場產品的在地化。
南美洲和非洲雖然規模較小,但仍是潛力無窮的地區。巴西關於分散式發電的監管以及墨西哥的商業太陽能市場正在為引入參數型乾旱保險鋪平道路,而南非的可再生能源獨立電力生產商採購計劃(REIPPPP)正在探索引入信用增級保險池,以降低購電協議(PPA)取消的風險。隨著政策框架的趨於穩定,保險公司預計保費將實現兩位數成長,這將進一步促進全球可再生能源保險市場的多元化。
其他好處:
- Excel格式的市場預測(ME)表
- 3個月的分析師支持
目錄
第1章:引言
- 研究假設和市場定義
- 調查範圍
第2章:調查方法
第3章執行摘要
第4章 市場狀況
- 市場概覽
- 市場促進因素
- 全球大規模太陽能和風能發電資產的擴張
- 自然災害造成的損失日益增加,推高了風險轉移的需求。
- 關於政府脫碳義務和綠色金融的合約條款
- 投資者和貸款機構對「可融資擔保」的ESG合規要求
- 電池能源儲存系統(BESS)的興起需要客製化保險。
- 推出參數化天氣指數產品,加速保險理賠支付速度。
- 市場限制因素
- 可再生能源各領域供給能力下降,保險費上漲。
- 關於新興技術相關索賠的保險統計數據有限。
- 美國中西部地區對太陽能發電的保險承保範圍限制了與冰雹損害相關的免責事項。
- 網路風險在多角化資產的累積,令再保險公司猶豫不決。
- 價值供應鏈分析
- 監理情勢
- 技術展望
- 波特五力模型
第5章 市場規模與成長預測
- 按目標類型
- 財產損失和業務中斷
- 建築保險/安裝保險
- 責任險(一般責任險、環境責任險、專業)
- 網路技術事故和不作為保險
- 參數型/指數型保險
- 透過可再生能源技術
- 陸域風力發電
- 離岸風力發電
- 大規模太陽能發電(PV)
- 工商業太陽能發電
- 水力發電和海洋能
- 生質能源和垃圾焚化發電
- 電池能源儲存系統(BESS)
- 最終用戶
- 公用事業規模的獨立發電商和所有者
- 商業和工業企業
- 住宅聚合商和社區太陽能
- 按地區
- 北美洲
- 美國
- 加拿大
- 墨西哥
- 歐洲
- 德國
- 英國
- 法國
- 義大利
- 西班牙
- 俄羅斯
- 其他歐洲國家
- 亞太地區
- 中國
- 印度
- 日本
- 韓國
- 東南亞
- 其他亞太國家
- 南美洲
- 巴西
- 阿根廷
- 其他南美國家
- 中東和非洲
- 沙烏地阿拉伯
- 阿拉伯聯合大公國
- 南非
- 其他中東和非洲國家
- 北美洲
第6章 競爭情勢
- 市場集中度
- 策略趨勢
- 市佔率分析
- 公司簡介
- Marsh McLennan
- Willis Towers Watson(WTW)
- Aon
- Munich Re
- Swiss Re
- Liberty Specialty Markets
- GCube Insurance
- Axis Capital
- Zurich Insurance
- Chubb
- Allianz Global Corporate & Specialty(AGCS)
- Travelers
- Hugh Wood Inc(HWI)
- kWh Analytics
- Descartes Underwriting
- Gallagher
- BKS Partners
- RSA Insurance
- Horton Group
- Tokio Marine Kiln
第7章 市場機會與未來展望
According to Mordor Intelligence, the renewable energy insurance market size in terms of premium value is projected to be USD 18.77 billion in 2025, USD 20.11 billion in 2026, and reach USD 28.35 billion by 2031, growing at a CAGR of 7.12% from 2026 to 2031.
This report is Segmented by Coverage Type (Property Damage & Business Interruption, Construction All-Risk/Erection All-Risk, and More), Renewable Energy Technology (Onshore Wind, Offshore Wind, Utility-Scale Solar PV, and More), End-User (Utility-Scale IPPs & Owners, Commercial & Industrial Operators, and More), and Region. The Market Forecasts are Provided in Value (USD).
Global Renewable Energy Insurance Market Trends and Insights
Global Roll-out of Utility-scale Solar & Wind Assets
Surging deployment of gigawatt-class renewables is widening demand for sophisticated insurance packages that go beyond traditional property indemnity. Swiss Re's participation in reinsuring a 3,500 MW solar-plus-storage complex in the Philippines showcases the scale and complexity now commonplace for clean-energy megaprojects. Coverage frameworks must span construction all-risk, operational performance guarantees, and multi-decade revenue stability while also addressing geographic clustering that amplifies correlated loss potential. Underwriters are responding with larger capacity tranches, granular catastrophe modeling, and multi-trigger structures that blend damage and index-based payouts. As project pipelines in APAC and North America accelerate, this driver exerts the largest positive push on overall premium growth in the renewable energy insurance market.
Escalating NatCat Losses Heighten Risk-Transfer Demand
Natural catastrophe losses tied to renewables have surged, exemplified by USD 300 million in US hail-related solar claims paid during the 2022 season. Although hail events represent just 6% of incidents, they account for more than 70% of photovoltaic system losses. The asymmetric peril profile is pushing carriers toward parametric solutions that trigger hailstone diameter or kinetic energy thresholds while developers adopt proactive measures such as automatic stow protocols. The feedback loop of higher loss ratios and specialty reinsurance pricing is hardening premiums, yet it also widens the addressable pool for differentiated products within the renewable energy insurance market.
Capacity Withdrawal & Premium Hardening Across Renewable Lines
In response to a series of heightened natural catastrophe claims, numerous insurance carriers have either reduced their line sizes or withdrawn from specific perils, leading to significant rate hikes. According to GCube, US solar risks have seen premiums surge from 10 cents to as much as 30 cents for every USD 100 of insured value. This sharp increase reflects the growing challenges in underwriting renewable energy projects, particularly in regions prone to natural disasters. Additionally, reinsurers are tightening retrocession terms, compelling primary underwriters to transfer these increased costs to policyholders. Smaller developers find it challenging to manage rising deductibles and might postpone projects until there is a more favorable capacity. These delays could potentially impact the pace of renewable energy adoption in the short term. While new players with a focus on parametric solutions are stepping in to bridge the gap, traditional property covers, which require substantial balance sheets, remain limited and are expected to retain their high prices until 2026. This constrained capacity and premium hardening underscore the need for innovative risk transfer mechanisms to support the renewable energy sector's growth.
Other drivers and restraints analyzed in the detailed report include:
- Government Decarbonization Mandates & Green-Finance Covenants
- Investor/Lender ESG Compliance Requirements for Bankable Cover
- Limited Actuarial Loss Data for Emerging Technologies
For complete list of drivers and restraints, kindly check the Table Of Contents.
Segment Analysis
Property damage & business interruption policies delivered 37.74% of the 2025 premium, securing the largest slice of the renewable energy insurance market share. They remain indispensable for lenders that require asset-level indemnification through construction and 20-year operational phases. However, parametric structures are projected to post a 9.92% CAGR through 2031, the fastest among all offerings, as buyers seek rapid liquidity following non-damage business interruption events such as wind-resource shortfalls. Construction All-Risk and Erection All-Risk plans to maintain relevance, especially for offshore projects that involve jack-up vessels and deep-water foundations. Liability forms covering third-party and environmental risks are evolving to include gradual pollution and wildlife-habitat clauses. Cyber & Technology Errors/Omissions coverage is expanding steadily as the renewable energy industry digitalizes control systems, raising aggregation exposures that traditional property wordings exclude. Together, these dynamics underscore the sophistication that carriers must embed to keep pace with evolving renewable energy insurance market requirements.
Innovation is visible in solar-radiation hedges, hail-parametric triggers, and wildfire smoke outage indices that compensate distributed energy resources for curtailed production. Carriers increasingly bundle conventional property contracts with parametric layers that drop down when deductibles erode profits. Brokers report that combined structures improve bankability by satisfying lender-mandated indemnity parameters while providing near-instant liquidity options for sponsors. The shift alters premium allocation and expands the renewable energy insurance market size for hybrid products that capture both physical damage and revenue stability needs.
Complete Report Scope:
- By Coverage Type
- Property Damage & Business Interruption
- Construction All-Risk / Erection All-Risk
- Liability (General, Environmental, Professional)
- Cyber & Technology Errors/Omissions
- Parametric / Index-based Covers
- By Renewable Energy Technology
- Onshore Wind
- Offshore Wind
- Utility-scale Solar PV
- Commercial & Industrial (C&I) Solar
- Hydropower & Marine Energy
- Bioenergy & Waste-to-Energy
- Battery Energy Storage Systems (BESS)
- By End-User
- Utility-Scale IPPs & Owners
- Commercial & Industrial Operators
- Residential Aggregators & Community Solar
- By Geography
- North America
- United States
- Canada
- Mexico
- Europe
- Germany
- United Kingdom
- France
- Italy
- Spain
- Russia
- Rest of Europe
- Asia-Pacific
- China
- India
- Japan
- South Korea
- Southeast Asia
- Rest of Asia-Pacific
- South America
- Brazil
- Argentina
- Rest of South America
- Middle East & Africa
- Saudi Arabia
- United Arab Emirates
- South Africa
- Rest of Middle East & Africa
- North America
Geography Analysis
Europe maintained a 29.74% premium share in 2025, supported by stringent climate-risk disclosure regimes and well-established public-private NatCat pools that backstop insurer balance sheets. Regional offshore wind maturity delivers actuarial credibility, allowing competitive pricing and reducing the cost of capital for sponsors. Innovation hubs in Denmark, Germany, and the Netherlands accelerate the adoption of parametric hail and low-wind index covers, further widening Europe's impact on the renewable energy insurance market.
North America is the fastest-growing region, charting a 8.93% CAGR on the strength of Inflation Reduction Act incentives and tailored solutions such as Marsh's tax-investment-default coverage that insulates investors when tax-credit allocations fall short. However, catastrophic hail in the Midwest and wildfire-driven exclusions in California strain capacity, leading some carriers to reduce aggregate limits or enforce peril sub-limits. Developers are responding through elevated deductibles and layered captive programs to preserve bankability. Despite these headwinds, the renewable energy insurance market continues expanding as US and Canadian provincial programs fund grid modernization and BESS roll-outs.
Asia-Pacific is emerging as a pivotal demand center. China alone is commissioning multi-gigawatt solar parks and offshore arrays that require reinsurance treaties surpassing USD 1 billion in aggregate limits. Swiss Re's involvement in the Philippines' integrated solar-plus-storage megaproject demonstrates the scale of opportunity. Southeast Asian nations adopting blended-finance models rely on bank-guaranteed insurance structures to attract international capital. Diverse regulatory landscapes and climatic extremes, from typhoon-prone coastlines to monsoon-impacted interiors, challenge underwriters to create location-specific perils maps, thereby fueling product localization within the renewable energy insurance market.
South America and Africa remain smaller but high-potential territories. Brazil's distributed-generation rules and Mexico's merchant solar market open doorways for parametric drought covers, while South Africa's REIPPPP program is experimenting with credit-enhanced insurance pools to mitigate PPA termination risks. As policy frameworks stabilize, insurers anticipate double-digit premium growth that will further diversify the global renewable energy insurance market.
- Marsh McLennan
- Willis Towers Watson (WTW)
- Aon
- Munich Re
- Swiss Re
- Liberty Specialty Markets
- GCube Insurance
- Axis Capital
- Zurich Insurance
- Chubb
- Allianz Global Corporate & Specialty (AGCS)
- Travelers
- Hugh Wood Inc (HWI)
- kWh Analytics
- Descartes Underwriting
- Gallagher
- BKS Partners
- RSA Insurance
- Horton Group
- Tokio Marine Kiln
Additional Benefits:
- The market estimate (ME) sheet in Excel format
- 3 months of analyst support
TABLE OF CONTENTS
1 Introduction
- 1.1 Study Assumptions & Market Definition
- 1.2 Scope of the Study
2 Research Methodology
3 Executive Summary
4 Market Landscape
- 4.1 Market Overview
- 4.2 Market Drivers
- 4.2.1 Global roll-out of utility-scale solar & wind assets
- 4.2.2 Escalating NatCat losses heightening risk-transfer demand
- 4.2.3 Government decarbonization mandates & green-finance covenants
- 4.2.4 Investor/lender ESG compliance requirements for bankable cover
- 4.2.5 Rise of battery-energy-storage systems (BESS) needing bespoke cover
- 4.2.6 Adoption of parametric weather-index products for faster payouts
- 4.3 Market Restraints
- 4.3.1 Capacity withdrawal & premium hardening across renewable lines
- 4.3.2 Limited actuarial loss data for emerging technologies
- 4.3.3 Hail-related exclusions curbing solar cover in US Midwest
- 4.3.4 Cyber-risk aggregation across distributed assets deterring reinsurers
- 4.4 Value / Supply-Chain Analysis
- 4.5 Regulatory Landscape
- 4.6 Technological Outlook
- 4.7 Porter's Five Forces
- 4.7.1 Threat of New Entrants
- 4.7.2 Bargaining Power of Buyers
- 4.7.3 Bargaining Power of Suppliers
- 4.7.4 Threat of Substitutes
- 4.7.5 Intensity of Competitive Rivalry
5 Market Size & Growth Forecasts (Value)
- 5.1 By Coverage Type
- 5.1.1 Property Damage & Business Interruption
- 5.1.2 Construction All-Risk / Erection All-Risk
- 5.1.3 Liability (General, Environmental, Professional)
- 5.1.4 Cyber & Technology Errors/Omissions
- 5.1.5 Parametric / Index-based Covers
- 5.2 By Renewable Energy Technology
- 5.2.1 Onshore Wind
- 5.2.2 Offshore Wind
- 5.2.3 Utility-scale Solar PV
- 5.2.4 Commercial & Industrial (C&I) Solar
- 5.2.5 Hydropower & Marine Energy
- 5.2.6 Bioenergy & Waste-to-Energy
- 5.2.7 Battery Energy Storage Systems (BESS)
- 5.3 By End-User
- 5.3.1 Utility-Scale IPPs & Owners
- 5.3.2 Commercial & Industrial Operators
- 5.3.3 Residential Aggregators & Community Solar
- 5.4 By Geography
- 5.4.1 North America
- 5.4.1.1 United States
- 5.4.1.2 Canada
- 5.4.1.3 Mexico
- 5.4.2 Europe
- 5.4.2.1 Germany
- 5.4.2.2 United Kingdom
- 5.4.2.3 France
- 5.4.2.4 Italy
- 5.4.2.5 Spain
- 5.4.2.6 Russia
- 5.4.2.7 Rest of Europe
- 5.4.3 Asia-Pacific
- 5.4.3.1 China
- 5.4.3.2 India
- 5.4.3.3 Japan
- 5.4.3.4 South Korea
- 5.4.3.5 Southeast Asia
- 5.4.3.6 Rest of Asia-Pacific
- 5.4.4 South America
- 5.4.4.1 Brazil
- 5.4.4.2 Argentina
- 5.4.4.3 Rest of South America
- 5.4.5 Middle East & Africa
- 5.4.5.1 Saudi Arabia
- 5.4.5.2 United Arab Emirates
- 5.4.5.3 South Africa
- 5.4.5.4 Rest of Middle East & Africa
- 5.4.1 North America
6 Competitive Landscape
- 6.1 Market Concentration
- 6.2 Strategic Moves
- 6.3 Market Share Analysis
- 6.4 Company Profiles (includes Global level Overview, Market level overview, Core Segments, Financials as available, Strategic Information, Market Rank/Share for key companies, Products & Services, and Recent Developments)
- 6.4.1 Marsh McLennan
- 6.4.2 Willis Towers Watson (WTW)
- 6.4.3 Aon
- 6.4.4 Munich Re
- 6.4.5 Swiss Re
- 6.4.6 Liberty Specialty Markets
- 6.4.7 GCube Insurance
- 6.4.8 Axis Capital
- 6.4.9 Zurich Insurance
- 6.4.10 Chubb
- 6.4.11 Allianz Global Corporate & Specialty (AGCS)
- 6.4.12 Travelers
- 6.4.13 Hugh Wood Inc (HWI)
- 6.4.14 kWh Analytics
- 6.4.15 Descartes Underwriting
- 6.4.16 Gallagher
- 6.4.17 BKS Partners
- 6.4.18 RSA Insurance
- 6.4.19 Horton Group
- 6.4.20 Tokio Marine Kiln
7 Market Opportunities & Future Outlook
- 7.1 White-space & Unmet-Need Assessment
 義大利可再生能源:市場佔有率分析、產業趨勢與統計及成長預測(2026-2031 年)西班牙可再生能源:市場佔有率分析、產業趨勢與統計及成長預測(2026-2031 年)
 企業購電協議 (PPA) 平台市場預測至 2034 年—按合約類型、合約期限、能源來源、買方類型、平台模式和地區分類的全球分析海洋溫差發電(OTEC)市場預測—按組件、安裝地點、技術、應用、最終用戶和地區分類的全球分析—2034年農業用電動推進器市場預測至2034年-按系統類型、組件、技術、應用、最終用戶和地區分類的全球分析
 可再生能源市場-全球產業規模、佔有率、趨勢、機會與預測:按類型、最終用途產業、地區和競爭格局分類,2021-2031年混合電池市場-全球產業規模、佔有率、趨勢、機會和預測:按產品類型、額定功率、最終用戶、連接方式、地區和競爭格局分類,2021-2031年東亞可再生能源:市場佔有率分析、產業趨勢與統計及成長預測(2026-2031年)
 可再生能源領域的人工智慧市場:按組件、能源類型、部署模式、最終用戶、國家和地區分類-全球產業分析、市場規模、市場佔有率及2026年至2033年預測西歐可再生能源:市場佔有率分析、產業趨勢與統計及成長預測(2026-2031 年)