

 |
市場調查報告書
商品編碼
2063820
服務供應商的路由器:市場佔有率分析、產業趨勢與統計及成長預測(2026-2031 年)Service Provider Router - Market Share Analysis, Industry Trends & Statistics, Growth Forecasts (2026 - 2031) |
||||||
※ 本網頁內容可能與最新版本有所差異。詳細情況請與我們聯繫。
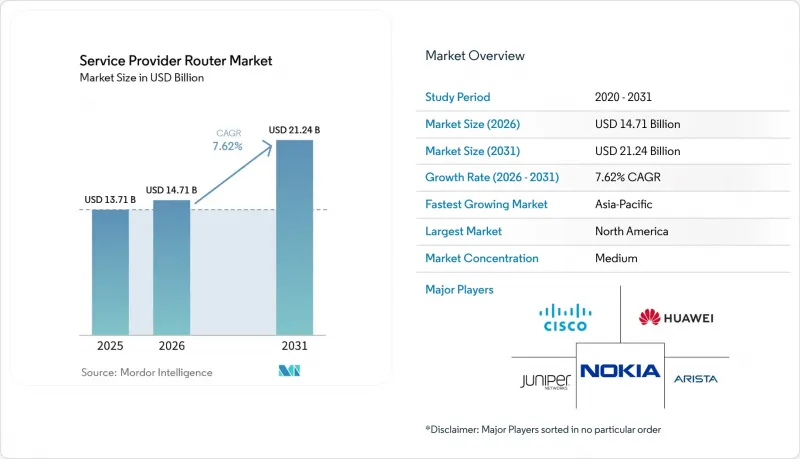
據 Mordor Intelligence 稱,2025 年服務供應商路由器市值為 137 億美元,預計到 2031 年將達到 212 億美元,而 2026 年為 147 億美元,預測期(2026-2031 年)的複合年成長率為 7.6%。
本報告按路由器類型(核心路由器、邊緣路由器、匯聚路由器等)、頻寬/連接埠速度(最高 40 Gbps、40–100 Gbps、100–400 Gbps 等)、應用領域(電信服務供應商、雲端服務供應商、網際網路交換中心供應商等)、技術(硬體路由器等)和地區進行細分。市場預測以美元計價。
面向服務供應商的路由器全球市場趨勢與洞察
5G 和 5G-Advanced回程傳輸要求
行動通訊業者正從初始 5G 服務過渡到 5G-Advanced 功能,例如網路切片和整合存取回程傳輸。中國計劃在 2025 年底建成 350 萬個基地台,每個基地台至少需要 10G 的回程傳輸容量,這將對全國範圍內超過 35Tbit/s 的路由器產生額外需求。韓國三大通訊業者已投資 8.7 兆韓元(約 65 億美元)用於 2025 年的回程傳輸升級。華為的 FlexE 2.0 硬切片和 SRv6 分段技術可在企業級 SLA 實現亞毫秒延遲。諾基亞已出貨超過 100 萬台 AirScale 微波無線電模組,支援 10G E 波段鏈路,可將都市區光纖成本降低 30%。這些部署優先採用 IEEE 1588v2 等定時協議,以維持分散式天線之間的相位一致性。
400G/800G路由技術的普及
由於高連貫相干可插拔模組,自 2024 年以來,每位元傳輸成本已降低約 60%。 Lumen 計劃到 2025 年在其美國城際骨幹網路全面部署 800G 介面,屆時每條路由所需的波長數量將減少 75%。 Colt 和 Nokia 的現場測試成功地在標準光纖上傳輸了 120 公里的 800G QSFP-DD 模組,且無需使用放大裝置。 Arista 的 R4 路由器可在單一 HyperPort 上聚合 3.2T 的數據,使其成為超大規模資料中心業者的理想選擇。 Ciena 的 WaveLogic 6 Extreme光學模組實現了 500 公里 1.6T 的傳輸速率,預示著Terabit特級長距離鏈路的到來。基於 OIF 800ZR 規範的多廠商互通性降低了廠商鎖定風險,並加速了大規模部署。
半導體供應鏈的波動
到2025年初,7nm和5nm佈線ASIC的前置作業時間超過40週,迫使企業提前18個月鎖定產能,導致營運資金緊張。 DDR4/DDR5記憶體價格飆漲80-90%,使中型廠商的利潤率下降5-7個百分點。受人工智慧加速器需求驅動,全球HBM3記憶體供不應求,迫使多家路由器製造商轉向高功率GDDR6記憶體。台積電的N3製程預計將於2025年中期達到滿載產能,將使中小型無廠半導體公司繼續沿用舊製程。美國《晶片製造與整合法案》(CHIPS Act)對國內晶圓代晶圓代工廠的補貼要到2027年才能緩解產能瓶頸,短期市場波動預計仍將持續。
細分市場分析
邊緣平台預計將以 8.94% 的複合年成長率成長,超過服務供應商路由器市場的整體成長速度。到 2025 年,核心底盤將佔總收入的 35.4%,用於支援長途和城域骨幹網路。邊緣運算的成長主要由私人 5G 網路和多重存取邊緣運算 (MAEC) 驅動,這些技術要求在終端用戶附近實現亞毫秒延遲。思科 Catalyst 8200 預計到 2025 年出貨量將超過 5 萬台,透過整合 SD-WAN、IPsec 和應用程式感知路由來取代傳統的網路分支設備。瞻博網路 (Juniper) 的會話智慧路由器 (Session Smart Router) 在財富 500 強企業的試點部署中,將廣域網路頻寬降低了 30%。在成熟的佈線系統中,聚合路由器仍然保持穩定的市場需求,這些系統需要 10G 和 25G回程傳輸來支援 DOCSIS 4.0 上行鏈路。用戶邊緣功能擴大在 uCPE 上虛擬化。瑞士電信部署了 10,000 台 OneOS6 設備,現場服務次數減少了 60%。這一轉變使得資本投資從專用硬體轉向基於 x86 的白盒設備,給現有供應商的利潤率帶來了壓力。儘管如此,對於管理超過 10 萬路由公里網路的頂級營運商而言,核心路由器仍然發揮著至關重要的作用,冗餘交換矩陣模組可確保 99.999% 的運轉率。
這種細分市場的分化表明,儘管服務供應商路由器市場的擴張主要集中在分散式節點,但核心升級需求仍然穩定。能夠將邊緣路由、運算和安全功能整合到軟體定義捆綁包中的供應商最有希望獲得額外的支出。同時,專注於核心網路的供應商透過整合連貫光技術和節能晶片來提高每個框架單位的吞吐量,從而維持其市場佔有率,並推遲全面升級。
預計超過 400G 的介面將以 12.42% 的複合年成長率成長,服務供應商路由器市場所有速度等級中最高的成長率。即使到了 2025 年,100G 至 400G 連接埠仍將佔銷售額的 34.82%,這反映了其在城域網路整合和資料中心骨幹網路中的成熟應用。通訊業者跳過 100G 直接升級到 400G 或 800G 的趨勢日益明顯,例如 Verizon 在其 2025 年的城域網路升級中完全跳過了 100G。中興通訊的 ZXCTN 6120H-SE 在緊湊型基地台路由器中提供 400G 速率,無需機櫃升級即可實現Terabit特級回程傳輸。
Arista 的 XPO 液冷插件聯盟面向 1.6T 和 3.2T 模組,散熱能力超過 30W,並將主動散熱迴路與標準 QSFP-DD 插座結合。 Ciena 的 WaveLogic 6光學模組可傳輸 1.6T 波長,傳輸距離超過 500 公里,從而降低再生成本和每位元能耗。隨著連貫可插拔技術將轉發器機架整合到路由器線路卡中,服務供應商路由器在 400G 以上平台的市場佔有率正在擴大,並將光纖通訊和 IP 預算整合到一個統一的支出池中。
區域分析
北美地區在維吉尼亞、奧勒岡州和德克薩斯州等超大規模資料中心業者中心800億美元的投資推動下,預計到2025年將佔全球收入的41.28%。寬頻股權、存取和部署(BEAD)計劃正在投資424.5億美元建設本地光纖網路,這將提振對高效能聚合路由器的需求。能源效率目標和對中國供應商的禁令正在推動國內採購,有利於本土製造商。
預計到2031年,亞太地區將以8.14%的複合年成長率成長,這主要得益於中國「5G-Advanced」計畫將基地台數量擴展至350萬個,每個基地台都需要10G回程傳輸。印度的「BharatNet」計畫已撥款13.9兆印度盧比(約167億美元)用於其光纖骨幹網路建設。日本通訊業者在2025會計年度於5G相關項目上投入了1.8兆日圓(約120億美元)。東南亞海底光纜建設的蓬勃發展進一步推動了島國對路由器的需求。
在歐洲,儘管歐盟第2023/826號法規限制了高效能設備的待機功耗為8瓦,從而限制了資本支出,但通訊業者已為2025年的網路建設投資了450億歐元(509億美元)。遵守能源法規的成本正在推動水冷光學元件和先進散熱設計的發展,這有利於那些擁有充足研發預算的供應商。
在南美洲,巴西正利用頻率競標收入對其核心骨幹網路進行現代化改造,而阿根廷則在加速光纖到府(FTTH)的部署。在中東,基於「沙烏地阿拉伯2030願景」和阿拉伯聯合大公國智慧城市計劃,5G獨立網路核心網正在部署,這需要相容UPF的路由器。非洲國家正在利用世界銀行的津貼擴展其國內光纖環網,例如莫三比克的“數位加速計劃”,這為可在50°C環境溫度下運行的戶外兼容路由器創造了商機。
其他好處:
- Excel格式的市場預測(ME)表
- 3個月的分析師支持
目錄
第1章:引言
- 研究假設和市場定義
- 調查範圍
第2章:調查方法
第3章執行摘要
第4章 市場狀況
- 市場概覽
- 市場促進因素
- 5G 和 5G-Advanced回程傳輸要求
- 400G/800G路由技術的普及
- 雲端資料中心擴充和DCI流量
- 人工智慧疊加網路的興起需要無損且高頻寬的骨幹網
- 採用一種新的抗量子路由協定
- 開發中國家政府對農村光纖骨幹網路的補貼
- 市場限制因素
- 半導體供應鏈的波動性
- 對中國供應商的監管限制
- 向虛擬化路由的轉變正在給硬體利潤率帶來壓力。
- 更嚴格的能源效率法規推高了設計成本。
- 產業供應鏈分析
- 監理情勢
- 技術展望
- 宏觀經濟因素對市場的影響
- 波特五力分析
第5章 市場規模與成長預測
- 路由器類型
- 核心路由器
- 邊緣路由器
- 聚合路由器
- 用戶邊緣路由器
- 頻寬和連接埠速度
- 低於 40 Gbps
- 40~100 Gbps
- 100~400 Gbps
- 超過 400 Gbps
- 透過使用
- 電信服務供應商
- 雲端服務供應商
- 網際網路交換服務供應商
- 企業和公共部門
- 透過技術
- 硬體路由器
- 軟體定義虛擬路由器(VNF/uCPE)
- 分離式/白盒路由器
- 按地區
- 北美洲
- 美國
- 加拿大
- 墨西哥
- 南美洲
- 巴西
- 阿根廷
- 其他南美國家
- 歐洲
- 德國
- 英國
- 法國
- 義大利
- 西班牙
- 俄羅斯
- 其他歐洲國家
- 亞太地區
- 中國
- 日本
- 印度
- 韓國
- 澳洲
- 其他亞太國家
- 中東
- 沙烏地阿拉伯
- 阿拉伯聯合大公國
- 土耳其
- 其他中東國家
- 非洲
- 南非
- 奈及利亞
- 肯亞
- 其他非洲國家
- 北美洲
第6章 競爭情勢
- 市場集中度
- 策略趨勢
- 市佔率分析
- 公司簡介
- Cisco Systems, Inc.
- Huawei Technologies Co., Ltd.
- Juniper Networks, Inc.
- Nokia Corporation
- Hewlett Packard Enterprise Company
- ZTE Corporation
- Arista Networks, Inc.
- Ciena Corporation
- Extreme Networks, Inc.
- Dell Technologies Inc.
- NEC Corporation
- Fujitsu Limited
- Ribbon Communications Inc.
- Adtran Holdings, Inc.
- Edgecore Networks Corporation
- Telefonaktiebolaget LM Ericsson
- Allied Telesis Holdings Corporation
- Radisys Corporation
- D-Link Corporation
- Infinera Corporation
第7章 市場機會與未來展望
According to Mordor Intelligence, the service provider router market size was valued at USD 13.7 billion in 2025 and is estimated to grow from USD 14.7 billion in 2026 to reach USD 21.2 billion by 2031, at a CAGR of 7.6% during the forecast period (2026-2031).
This report is Segmented by Router Type (Core Routers, Edge Routers, Aggregation Routers, and More), Bandwidth/Port Speed (Up To 40 Gbps, 40-100 Gbps, 100-400 Gbps, and More), Application (Telecom Service Providers, Cloud Service Providers, Internet Exchange Providers and More), Technology (Hardware-Based Routers, and More), and Geography. The Market Forecasts are Provided in Terms of Value (USD).
Global Service Provider Router Market Trends and Insights
5G And 5G-Advanced Backhaul Requirements
Mobile operators are moving from early 5G releases toward 5G-Advanced features such as network slicing and integrated access backhaul. China targeted 3.5 million base stations by year-end 2025, each requiring at least 10 G of backhaul capacity, creating incremental router demand exceeding 35 Tbit/s nationwide. South Korea's three carriers invested KRW 8.7 trillion (USD 6.5 billion) in backhaul upgrades in 2025. Huawei's FlexE 2.0 hard slicing and SRv6 segmentation enable sub-millisecond latency for enterprise SLA tiers. Nokia shipped more than one million AirScale microwave radios supporting 10 G E-band links, cutting urban fiber costs by 30%. These deployments prioritize timing protocols such as IEEE 1588v2 to maintain phase coherence across distributed antennas.
Proliferation Of 400 G / 800 G Routing Technology
The cost per transported bit has fallen roughly 60% since 2024, thanks to high-baud-rate coherent pluggables. Lumen activated 800G interfaces across its U.S. intercity backbone in 2025, reducing the required wavelengths per route by 75%. A Colt-Nokia field trial pushed 800 G QSFP-DD modules 120 km over standard fiber with no amplification. Arista's R4 routers aggregate 3.2 T on a single HyperPort, ideal for hyperscaler spine fabrics. Ciena's WaveLogic 6 Extreme optics achieved 1.6 T over 500 km, heralding terabit-class long-haul links. Multi-vendor interoperability under the OIF 800ZR spec is reducing lock-in and expediting volume deployments.
Semiconductor Supply-Chain Volatility
Lead times for 7 nm and 5 nm routing ASICs surpassed 40 weeks in early 2025, forcing 18-month capacity reservations and straining working capital. DDR4/DDR5 prices surged 80-90%, slicing mid-tier vendor margins by 5-7 points. A global HBM3 shortage, driven by AI accelerators, pushed several router makers toward higher-power GDDR6 buffers. TSMC's N3 node reached full allocation by mid-2025, leaving smaller fabless firms on older processes. Domestic foundry subsidies under the U.S. CHIPS Act will not soften bottlenecks before 2027, extending volatility through the near term.
Other drivers and restraints analyzed in the detailed report include:
- Expansion Of Cloud Data Centers And DCI Traffic
- Rise Of AI Overlay Networks Requiring Lossless Ethernet
- Regulatory Restrictions On Chinese Vendors
For complete list of drivers and restraints, kindly check the Table Of Contents.
Segment Analysis
Edge platforms are forecast to expand at an 8.94% CAGR, outstripping the overall service provider router market. Core chassis captured 35.4% of 2025 revenue, anchoring long-haul and metro backbones. Edge growth stems from private 5G networks and multi-access edge computing that require sub-millisecond latency near end users. Cisco's Catalyst 8200 shipped more than 50,000 units in 2025, bundling SD-WAN, IPsec, and application-aware routing to displace legacy branch appliances. Juniper's Session Smart Router pilot reduced WAN bandwidth by 30% at Fortune 500 sites. Aggregation routers remain steady in mature cable systems where DOCSIS 4.0 uplinks need 10 G and 25 G backhaul. Subscriber edge functions are virtualizing onto uCPE: Swisscom rolled out 10,000 OneOS6 appliances, cutting truck rolls by 60%. This shift directs capex from proprietary hardware toward x86-based white boxes, tightening margins for incumbents. Nevertheless, core routers retain relevance for tier-1 carriers managing networks beyond 100,000 route-km, where redundant fabric modules ensure five-nines uptime.
The segment's divergence illustrates how service provider router market size growth concentrates in distributed nodes while core refreshes flatten. Vendors that can package edge routing, compute, and security into a software-defined bundle are best positioned to capture incremental spend. Meanwhile, core-focused suppliers defend their share by integrating coherent optics and power-optimized silicon to squeeze more throughput per rack unit, delaying forklift upgrades.
Interfaces above 400 G are forecast to rise at a 12.42% CAGR, the fastest of any speed tier in the service provider router market. In 2025, 100 G-to-400 G ports still accounted for a commanding 34.82% of revenue, reflecting entrenched use in metro aggregation and data-center spines. Operators increasingly skip 100 G and move straight to 400 G or 800 G, as seen in Verizon's 2025 metro refresh that bypassed 100 G entirely. ZTE's ZXCTN 6120H-SE delivered 400 G in a compact base-station router, enabling terabit backhaul without cabinet upgrades.
Arista's XPO liquid-cooled pluggable alliance targets 1.6 T and 3.2 T modules dissipating 30 W+, pairing active thermal loops with standard QSFP-DD sockets. Ciena's WaveLogic 6 optics extend 1.6T wavelengths over 500 km, lowering regeneration costs and energy consumption per bit. As coherent pluggables collapse transponder shelves into router line cards, the service provider router market share for platforms above 400 G widens, pulling optical and IP budgets into a converged spend pool.
Geography Analysis
North America captured 41.28% of 2025 revenue, buoyed by USD 80 billion hyperscaler investment across Virginia, Oregon, and Texas. The Broadband Equity, Access, and Deployment program injects USD 42.45 billion into rural fiber networks, boosting demand for rugged aggregation routers. Energy-efficiency targets and Chinese vendor bans are accelerating domestic sourcing, advantaging local manufacturers.
Asia-Pacific is set for an 8.14% CAGR through 2031 as China's 5G-Advanced plan scales to 3.5 million base stations, each requiring 10 G backhaul. India's BharatNet allocated INR 139,000 crore (USD 16.7 billion) for fiber backbone projects. Japan's carriers spent JPY 1.8 trillion (USD 12 billion) on 5G in fiscal 2025. Southeast Asia's submarine-cable boom further props router demand in archipelagic states.
In Europe, operators invested EUR 45 billion (USD 50.9 billion) in 2025 networks despite tight capital outlays under EU Regulation 2023/826 that caps standby power at 8 W for high-performance appliances. Energy compliance costs encourage liquid-cooled optics and advanced thermal design, which favor vendors with deep R&D budgets.
South America leverages Brazil's spectrum auction proceeds to modernize core backbones, while Argentina accelerates FTTH adoption. The Middle East is deploying 5G standalone cores under Saudi Vision 2030 and UAE smart-city initiatives, requiring UPF-enabled routers. African nations tap World Bank grants, such as Mozambique's Digital Acceleration Program, to extend national fiber rings, creating opportunities for outdoor-rated routers capable of operating at 50 °C ambient temperatures.
- Cisco Systems, Inc.
- Huawei Technologies Co., Ltd.
- Juniper Networks, Inc.
- Nokia Corporation
- Hewlett Packard Enterprise Company
- ZTE Corporation
- Arista Networks, Inc.
- Ciena Corporation
- Extreme Networks, Inc.
- Dell Technologies Inc.
- NEC Corporation
- Fujitsu Limited
- Ribbon Communications Inc.
- Adtran Holdings, Inc.
- Edgecore Networks Corporation
- Telefonaktiebolaget LM Ericsson
- Allied Telesis Holdings Corporation
- Radisys Corporation
- D-Link Corporation
- Infinera Corporation
Additional Benefits:
- The market estimate (ME) sheet in Excel format
- 3 months of analyst support
TABLE OF CONTENTS
1 INTRODUCTION
- 1.1 Study Assumptions and Market Definition
- 1.2 Scope of the Study
2 RESEARCH METHODOLOGY
3 EXECUTIVE SUMMARY
4 MARKET LANDSCAPE
- 4.1 Market Overview
- 4.2 Market Drivers
- 4.2.1 5G and 5G-Advanced Backhaul Requirements
- 4.2.2 Proliferation of 400G/800G Routing Technology
- 4.2.3 Expansion of Cloud Data Centers and DCI Traffic
- 4.2.4 Rise of AI Overlay Networks Requiring Lossless High-Bandwidth Backbone
- 4.2.5 Emerging Quantum-Safe Routing Protocol Adoption
- 4.2.6 Government Subsidies for Rural Fiber Backbone in Developing Countries
- 4.3 Market Restraints
- 4.3.1 Semiconductor Supply Chain Volatility
- 4.3.2 Regulatory Restrictions on Chinese Vendors
- 4.3.3 Transition to Virtualized Routing Compressing Hardware Margins
- 4.3.4 Increasing Energy Efficiency Mandates Raising Design Costs
- 4.4 Industry Supply-Chain Analysis
- 4.5 Regulatory Landscape
- 4.6 Technological Outlook
- 4.7 Impact of Macroeconomic Factors on the Market
- 4.8 Porter's Five Forces Analysis
- 4.8.1 Threat of New Entrants
- 4.8.2 Bargaining Power of Suppliers
- 4.8.3 Bargaining Power of Buyers
- 4.8.4 Threat of Substitute Products
- 4.8.5 Intensity of Competitive Rivalry
5 MARKET SIZE AND GROWTH FORECASTS (VALUE)
- 5.1 By Router Type
- 5.1.1 Core Routers
- 5.1.2 Edge Routers
- 5.1.3 Aggregation Routers
- 5.1.4 Subscriber Edge Routers
- 5.2 By Bandwidth/Port Speed
- 5.2.1 Up to 40 Gbps
- 5.2.2 40-100 Gbps
- 5.2.3 100-400 Gbps
- 5.2.4 Above 400 Gbps
- 5.3 By Application
- 5.3.1 Telecom Service Providers
- 5.3.2 Cloud Service Providers
- 5.3.3 Internet Exchange Providers
- 5.3.4 Enterprises and Public Sector
- 5.4 By Technology
- 5.4.1 Hardware-Based Routers
- 5.4.2 Software-Defined/Virtual Routers (VNF/uCPE)
- 5.4.3 Disaggregated/White-Box Routers
- 5.5 By Geography
- 5.5.1 North America
- 5.5.1.1 United States
- 5.5.1.2 Canada
- 5.5.1.3 Mexico
- 5.5.2 South America
- 5.5.2.1 Brazil
- 5.5.2.2 Argentina
- 5.5.2.3 Rest of South America
- 5.5.3 Europe
- 5.5.3.1 Germany
- 5.5.3.2 United Kingdom
- 5.5.3.3 France
- 5.5.3.4 Italy
- 5.5.3.5 Spain
- 5.5.3.6 Russia
- 5.5.3.7 Rest of Europe
- 5.5.4 Asia-Pacific
- 5.5.4.1 China
- 5.5.4.2 Japan
- 5.5.4.3 India
- 5.5.4.4 South Korea
- 5.5.4.5 Australia
- 5.5.4.6 Rest of Asia-Pacific
- 5.5.5 Middle East
- 5.5.5.1 Saudi Arabia
- 5.5.5.2 United Arab Emirates
- 5.5.5.3 Turkey
- 5.5.5.4 Rest of Middle East
- 5.5.6 Africa
- 5.5.6.1 South Africa
- 5.5.6.2 Nigeria
- 5.5.6.3 Kenya
- 5.5.6.4 Rest of Africa
- 5.5.1 North America
6 COMPETITIVE LANDSCAPE
- 6.1 Market Concentration
- 6.2 Strategic Moves
- 6.3 Market Share Analysis
- 6.4 Company Profiles (includes Global Level Overview, Market Level Overview, Core Segments, Financials as available, Strategic Information, Market Rank/Share, Products and Services, Recent Developments)
- 6.4.1 Cisco Systems, Inc.
- 6.4.2 Huawei Technologies Co., Ltd.
- 6.4.3 Juniper Networks, Inc.
- 6.4.4 Nokia Corporation
- 6.4.5 Hewlett Packard Enterprise Company
- 6.4.6 ZTE Corporation
- 6.4.7 Arista Networks, Inc.
- 6.4.8 Ciena Corporation
- 6.4.9 Extreme Networks, Inc.
- 6.4.10 Dell Technologies Inc.
- 6.4.11 NEC Corporation
- 6.4.12 Fujitsu Limited
- 6.4.13 Ribbon Communications Inc.
- 6.4.14 Adtran Holdings, Inc.
- 6.4.15 Edgecore Networks Corporation
- 6.4.16 Telefonaktiebolaget LM Ericsson
- 6.4.17 Allied Telesis Holdings Corporation
- 6.4.18 Radisys Corporation
- 6.4.19 D-Link Corporation
- 6.4.20 Infinera Corporation
7 MARKET OPPORTUNITIES AND FUTURE OUTLOOK
- 7.1 White-Space and Unmet-Need Assessment
 工業路由器市場:2026-2032年全球市場預測(依產品類型、連接技術、部署環境、最終用戶產業及銷售管道)
 2026年全球電信級路由市場報告全球乙太網路路由器市場報告(2026 年)
 路由器市場規模、佔有率和成長分析:按產品類型、頻寬類型、技術、應用、銷售管道、最終用戶和地區分類-2026-2033年產業預測
 工業路由器市場:按產品類型、最終用戶和地區分類
 高耐久性路由器:市場佔有率分析、產業趨勢與統計資料、成長預測(2026-2031 年)SOHO路由器:市佔率分析、產業趨勢與統計及成長預測(2026-2031年)消費級路由器:市佔率分析、產業趨勢與統計及成長預測(2026-2031 年)2026年全球路由器市場報告2026年全球電信級路由系統(CRS)市場報告