

 |
市場調查報告書
商品編碼
2063355
政府與教育物流:市場佔有率分析、產業趨勢與統計、成長預測(2026-2031 年)Government And Education Logistics - Market Share Analysis, Industry Trends & Statistics, Growth Forecasts (2026 - 2031) |
||||||
※ 本網頁內容可能與最新版本有所差異。詳細情況請與我們聯繫。
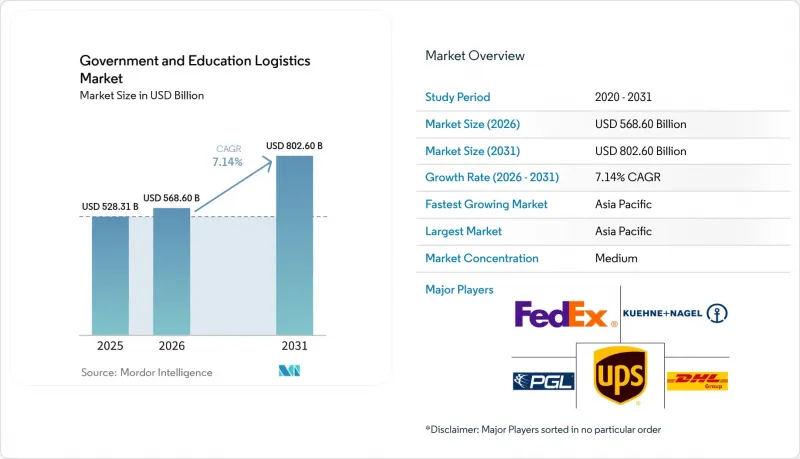
根據 Mordor Intelligence 預測,政府和教育物流市場規模將從 2025 年的 5,283.1 億美元成長到 2026 年的 5,686 億美元,到 2031 年將達到 8,026 億美元,2026 年至 2031 年的複合年成長率為 7.14%。
公共部門採購人員正將關注點從最低價格合約轉向網路彈性、排放和數位化透明度。本報告按服務類型(運輸、倉儲和儲存、附加價值服務)、最終用戶(中央/聯邦政府、州和地方政府、國防機構、公共教育機構及其他)和地區(北美、南美、亞太、歐洲、中東和非洲)進行細分。市場預測以美元計價。
全球政府及教育物流市場趨勢及洞察
強制性脫碳和綠色採購目標
目前,公共機構已將排放上限和區域採購規則納入所有競標。歐盟的《清潔車輛指令》規定了2025年和2030年的採購目標,要求成員國優先發展電動車和鐵路運輸;而美國馬裡蘭州等州則要求公共建設項目的物流業者揭露其碳排放。國際永續發展研究所(IISD)的一項分析顯示,綠色法規雖然成功降低了供應鏈的排放,但也增加了合約的初始成本,導致公共機構不得不簽訂長期契約,以便承運商分攤低碳車輛的成本。無力資金籌措電動卡車費用的中小型承運商正在退出競標,運輸量則集中在全球貨運代理商手中。
疫情後用於建構韌性公共供應鏈的緊急時應對計畫
新冠疫情引發的供不應求促使世界各國政府將物流韌性視為國家安全優先事項,而非僅是提高採購效率的手段。在白宮供應鏈韌性委員會等行政措施的基礎上,聯邦機構擴大被要求識別關鍵依賴項並優先考慮雙重採購。一些具體舉措,例如美國衛生與公眾服務部推動倉庫分散化以及透過供應商管理庫存(VMI)擴大戰略國家儲備(SNS),正在推動次市場對物流租賃的需求成長。此外,聯邦採購指南也越來越傾向於選擇擁有強大且冗餘的國內網路的承運商。雖然優先考慮緩衝庫存和網路冗餘必然會增加整體物流成本,但對於決心避免再次發生中斷的公共採購負責人來說,這些投資仍然是不可妥協的要求。
全球貨櫃運輸能力的波動會影響成本預測的難度。
紅海的安全隱患以及巴拿馬運河因乾旱而通航受阻,導致自2024年起航線延長,船舶燃油成本飆升達40%。由於公共部門買家要求固定價格,承運商要么被迫承受價格波動,要么面臨競標失敗的風險。沒有避險方案的中小型貨運代理商紛紛退出競標,政府和教育機構的物流市場日益集中,以能夠承受現貨價格大幅上漲的整合商為中心。
細分市場分析
預計附加價值服務將在2025年實現最快成長,並在2031年之前以10.57%的複合年成長率持續成長。同時,運輸業仍將保持最大佔有率,在2025年佔據政府和教育物流市場49.66%的佔有率。目前,各機構對諸如翻新筆記型電腦的逆向物流、學校餐食的已調整的包裝以及受管制物品的合規標籤等服務需求日益成長。美國環保署(EPA)的循環採購法規要求對二手設備進行移除、安全運輸和經認證的資料擦除,這推動了對能夠追蹤資產從收集到轉售全過程的供應商的需求。
隨著對機器人和無線射頻識別 (RFID) 技術的依賴日益加深,政府和教育物流整合服務套件的市場規模正在擴大。 UPS 計劃在 2025 年為其所有美國送貨車輛配備RFID讀取器,使公共部門採購人員能夠即時了解研究原型庫存狀態。自動化降低了單位履約成本,使承運商能夠整合倉儲、取貨和配送,並以低於內部標準的價格簽訂多年期合約。運輸仍然至關重要,尤其是短途道路運輸運輸和長途鐵路運輸,但利潤率的邊界正在向利用技術實現兩位數利潤的附加價值服務轉移。
區域分析
預計到2025年,亞太地區將佔全球銷售額的40.67%,並在2031年之前以8.60%的複合年成長率成長,這主要得益於印度政府電子市場(GeM)、中國的「一帶一路」大學建設項目以及東南亞數位校園的蓬勃發展。在印度,透過GeM進行的公共採購額到2025年將超過300億美元,其內建的即時供應商評估系統將使符合嚴格交付標準的物流公司更具優勢。中國在中亞的夥伴關係正在推動科研設備透過保稅走廊進行分銷,而東協的關稅協調則促進了教科書在區域內的流通。在澳洲和韓國,隨著國防研究的擴展,符合ITAR規定的物流業務正在成長;而日本正在其「社會5.0」計畫中,對校園內的自主配送機器人進行檢查和運作。
北美仍然是政府和教育物流的合約中心,這得益於美國聯邦政府2024年超過7000億美元的支出以及加拿大各省對本地寬頻的投資。美國總務管理局(GSA)正在OASIS+和Polaris專案下整合合約名額,簡化採購流程,同時減少合格競標的數量。一家公司獲得了美國郵政服務(USPS)2024年的一個重要空運名額,這表明陸空一體化網路比傳統合約條款更為重要。墨西哥近岸外包業務的激增正在推動教育設備的跨境流動,但加州的海關瓶頸和港口堵塞仍然威脅著貨物的運輸時間表。
歐洲的前景取決於加強環境法規,例如《清潔車輛指令》。該指令要求公共部門採購人員優先考慮低碳和零排放運輸。這項要求迫使許多傳統承運商更新車隊或建立合資企業,以符合綠色政府採購標準。比荷盧經濟聯盟和北歐國家率先採用數位化電子貨運單 (e-CMR),並要求第三方物流(3PL) 供應商與先進的數位追蹤平台整合,以確保資產可追溯性。儘管歐盟凝聚基金正投資於東歐的教育基礎設施,但貨幣波動和監管碎片化使定價變得複雜,迫使承運商要么增加風險溢價,要么限制其風險承受能力。
其他好處
- Excel格式的市場預測(ME)表
- 3個月的分析師支持
目錄
第1章:引言
- 研究假設和市場定義
- 調查範圍
第2章:調查方法
第3章執行摘要
第4章 市場狀況
- 市場概覽
- 市場促進因素
- 法律規定的脫碳和綠色採購目標
- 疫情後用於建構韌性公共供應鏈的緊急時應對計畫
- 新興國家衛星校區的擴張正在創造新的物流走廊。
- 國防研究與開發的擴展以及與大學的合作促進了機密資訊的流通。
- 在政府庫存管理中實施基於區塊鏈的憑證和資產追蹤。
- 農村地區寬頻基礎設施的推廣正在促進教育設備的大規模部署。
- 市場限制因素
- 全球貨櫃運輸能力的波動會影響成本預測的準確性。
- 具備安全許可的後勤人員短缺
- 低密度教育區的最後一公里基礎設施分段式
- 更嚴格的網路安全法規推高了IT整合成本。
- 價值供應鏈分析
- 監理情勢
- 技術展望
- 波特五力模型
第5章 市場規模與成長預測
- 按服務類型
- 運輸
- 路
- 鐵路
- 航空
- 海路和內河航道
- 倉庫/存儲
- 附加價值服務
- 運輸
- 最終用戶
- 中央/聯邦政府
- 州/地方政府
- 國防組織
- 公立教育機構(幼稚園至12年級)
- 高等教育機構
- 其他
- 按地區
- 北美洲
- 美國
- 加拿大
- 墨西哥
- 南美洲
- 巴西
- 秘魯
- 智利
- 阿根廷
- 其他南美國家
- 亞太地區
- 印度
- 中國
- 日本
- 澳洲
- 韓國
- 東南亞(新加坡、馬來西亞、泰國、印尼、越南、菲律賓)
- 其他亞太國家
- 歐洲
- 英國
- 德國
- 法國
- 西班牙
- 義大利
- 比荷盧經濟聯盟(比利時、荷蘭、盧森堡)
- 北歐國家(丹麥、芬蘭、冰島、挪威、瑞典)
- 其他歐洲國家
- 中東和非洲
- 阿拉伯聯合大公國
- 沙烏地阿拉伯
- 南非
- 奈及利亞
- 其他中東和非洲國家
- 北美洲
第6章 競爭情勢
- 市場集中度
- 策略趨勢
- 市佔率分析
- 公司簡介
- DHL Group
- FedEx
- United Parcel Service, Inc.(UPS)
- Kuehne+Nagel International AG
- PGL(Primary Global Logistics)
- DSV
- CEVA Logistics(CMA CGM)
- XPO
- BDP International
- GEODIS
- Maersk Logistics & Services
- Scan Global Logistics
- PLS Logistics
- SEKO Logistics
- Rhenus Logistics
- Expeditors International
- Toll Group
- Atlantic Logistics
- Logistics Plus Inc.
- Noble Supply & Logistics
第7章 市場機會與未來展望
According to Mordor Intelligence, the government and education logistics market size is expected to increase from USD 528.31 billion in 2025 to USD 568.60 billion in 2026 and reach USD 802.60 billion by 2031, growing at a CAGR of 7.14% over 2026-2031.
Public-sector buyers are shifting from lowest-price contracting toward network resilience, emissions reduction, and digital transparency. This report is Segmented by Service Type (Transportation, Warehousing & Storage, and Value-Added Services), by End-User (Central/Federal Government, State & Local Government, Defense Agencies, Public Education, and More), and by Geography (North America, South America, Asia-Pacific, Europe, and Middle East and Africa). The Market Forecasts are Provided in Terms of Value (USD).
Global Government And Education Logistics Market Trends and Insights
Mandated Decarbonization & Green-Procurement Targets
Public agencies now embed emissions caps and local-content rules into every tender. The EU's Clean Vehicles Directive, with mandatory procurement targets for 2025 and 2030, obliges members to favor electric vehicles and rail, while U.S. states such as Maryland require carbon disclosure for logistics serving public construction. International Institute for Sustainable Development analysis shows green rules have successfully driven down supply chain emissions but lifted upfront contract costs, prompting agencies to sign longer-term deals so carriers can amortize low-carbon fleets. Smaller haulers unable to finance electric trucks are exiting bids, concentrating volumes with global integrators.
Post-Pandemic Contingency Planning for Resilient Public Supply Chains
After COVID-19 shortages, governments treat logistics resilience as a national security priority rather than just a procurement efficiency lever. Building on executive actions such as the establishment of the White House Council on Supply Chain Resilience, federal agencies are increasingly directed to map critical dependencies and prioritize dual-sourcing. Specific initiatives, such as the Department of Health and Human Services' push to decentralize and expand the Strategic National Stockpile through split-warehouse networks and vendor-managed inventory, have boosted logistics leasing in secondary markets. Furthermore, federal procurement guidelines are increasingly favoring carriers with robust, redundant domestic networks. While prioritizing buffer stock and network redundancy inherently lifts total logistics costs, these investments remain non-negotiable for public procurement officers determined to avoid repeat disruptions.
Global Container-Capacity Volatility Impacting Cost Predictability
Red Sea security incidents and drought-affected Panama Canal transits have lengthened routes and inflated bunker fuel costs by up to 40% since 2024. Public buyers insist on fixed prices, so carriers absorb volatility or risk losing bids. Smaller forwarders absent hedging programs exit tenders, further consolidating the government and education logistics market around integrators able to cushion spot spikes.
Other drivers and restraints analyzed in the detailed report include:
- Expansion of Satellite Campuses in Emerging Countries Creating New Logistics Corridors
- Growth in Defense R&D Partnerships with Universities Driving Classified Material Flows
- Shortage of Security-Cleared Logistics Personnel
For complete list of drivers and restraints, kindly check the Table Of Contents.
Segment Analysis
Value-Added services accounted for the fastest growth in 2025 and are forecast to rise at a 10.57% CAGR through 2031, while Transportation retained the largest 49.66% slice of the government and education logistics market share in 2025. Agencies now expect reverse logistics for refurbished laptops, kitting for pre-portioned school meals, and compliance labeling for controlled goods. U.S. Environmental Protection Agency circular-procurement rules require de-installation, secure transport, and certified data wiping of end-of-life devices, creating premium demand for providers that track assets from pickup through resale.
Growing reliance on robotics and radio-frequency identification boosts the government and education logistics market size for integrated service suites. UPS equipped all U.S. package cars with RFID readers in 2025, giving public buyers real-time inventory visibility for research prototypes. Automation lowers unit fulfillment cost, letting carriers bundle warehousing, refurbishment, and distribution into multi-year contracts priced below in-house benchmarks. Transportation remains indispensable, especially road haulage for short-haul deliveries and rail for long-distance bulk moves, yet the margin frontier is shifting toward tech-enabled value-added services with double-digit profit potential.
Geography Analysis
Asia-Pacific held 40.67% of 2025 revenue and is projected to grow at an 8.60% CAGR to 2031, underpinned by India's Government e-Marketplace, China's Belt and Road university projects, and Southeast Asia's digital-campus boom. India processed more than USD 30 billion in public purchases on GeM during 2025, and embedded real-time vendor scoring now rewards logistics firms that meet aggressive on-time metrics. Chinese partnerships across Central Asia funnel scientific instruments through bonded corridors, and the Association of Southeast Asian Nations' duty harmonization lifts intra-regional textbook flows. Australia and South Korea add ITAR-compliant traffic as defense research proliferates, while Japan pilots autonomous on-campus delivery robots within its Society 5.0 program.
North America remains the contractual anchor of the government and education logistics market, supported by U.S. federal spending that topped USD 700 billion in 2024 and Canadian provincial investments in rural broadband. The U.S. General Services Administration is consolidating contract vehicles under OASIS+ and Polaris, trimming the field of eligible bidders yet streamlining procurement cycles. secured the primary USPS air-cargo slot in 2024, demonstrating that integrated ground-and-air networks matter more than legacy tenure. Mexico's nearshoring surge attracts cross-border education-equipment flows, although customs chokepoints and California port congestion still test schedule reliability.
Europe's outlook hinges on tightening environmental regulations, such as the Clean Vehicles Directive, which forces public buyers to prioritize low-carbon and zero-emission lanes. This requirement pushes many traditional carriers to upgrade their fleets or form joint ventures to remain compliant with green public procurement standards. BENELUX and Nordic states are early adopters of digitized e-CMR (electronic consignment notes), obliging 3PLs to integrate with advanced digital tracking platforms for asset provenance. Eastern European education infrastructure receives EU cohesion funds, yet currency volatility and regulatory fragmentation complicate pricing, compelling carriers to add risk premia or cap exposure.
- DHL Group
- FedEx
- United Parcel Service, Inc. (UPS)
- Kuehne + Nagel International AG
- PGL (Primary Global Logistics)
- DSV
- CEVA Logistics (CMA CGM)
- XPO
- BDP International
- GEODIS
- Maersk Logistics & Services
- Scan Global Logistics
- PLS Logistics
- SEKO Logistics
- Rhenus Logistics
- Expeditors International
- Toll Group
- Atlantic Logistics
- Logistics Plus Inc.
- Noble Supply & Logistics
Additional Benefits:
- The market estimate (ME) sheet in Excel format
- 3 months of analyst support
TABLE OF CONTENTS
1 Introduction
- 1.1 Study Assumptions & Market Definition
- 1.2 Scope of the Study
2 Research Methodology
3 Executive Summary
4 Market Landscape
- 4.1 Market Overview
- 4.2 Market Drivers
- 4.2.1 Mandated Decarbonization & Green-Procurement Targets
- 4.2.2 Post-Pandemic Contingency Planning for Resilient Public Supply Chains
- 4.2.3 Expansion of Satellite Campuses in Emerging Countries Creating New Logistics Corridors
- 4.2.4 Growth in Defense R&D Partnerships with Universities Driving Classified Material Flows
- 4.2.5 Blockchain-Based Credential & Asset Tracking Adoption Across Government Inventories
- 4.2.6 Rural Broadband Stimulus Fueling Large-Scale Educational Equipment Deployments
- 4.3 Market Restraints
- 4.3.1 Global Container-Capacity Volatility Impacting Cost Predictability
- 4.3.2 Shortage of Security-Cleared Logistics Personnel
- 4.3.3 Fragmented Last-Mile Infrastructure in Low-Density Education Districts
- 4.3.4 Escalating Cybersecurity Mandates Increasing IT Integration Costs
- 4.4 Value / Supply-Chain Analysis
- 4.5 Regulatory Landscape
- 4.6 Technological Outlook
- 4.7 Porter's Five Forces
- 4.7.1 Threat of New Entrants
- 4.7.2 Bargaining Power of Suppliers
- 4.7.3 Bargaining Power of Buyers
- 4.7.4 Threat of Substitutes
- 4.7.5 Competitive Rivalry
5 Market Size & Growth Forecasts
- 5.1 By Service Type
- 5.1.1 Transportation
- 5.1.1.1 Road
- 5.1.1.2 Rail
- 5.1.1.3 Air
- 5.1.1.4 Sea and Inland Waterway
- 5.1.2 Warehousing & Storage
- 5.1.3 Value-Added Services
- 5.1.1 Transportation
- 5.2 By End-User
- 5.2.1 Central/Federal Government
- 5.2.2 State & Local Government
- 5.2.3 Defense Agencies
- 5.2.4 Public Education (K-12)
- 5.2.5 Higher Education Institutions
- 5.2.6 Others
- 5.3 By Geography
- 5.3.1 North America
- 5.3.1.1 United States
- 5.3.1.2 Canada
- 5.3.1.3 Mexico
- 5.3.2 South America
- 5.3.2.1 Brazil
- 5.3.2.2 Peru
- 5.3.2.3 Chile
- 5.3.2.4 Argentina
- 5.3.2.5 Rest of South America
- 5.3.3 Asia-Pacific
- 5.3.3.1 India
- 5.3.3.2 China
- 5.3.3.3 Japan
- 5.3.3.4 Australia
- 5.3.3.5 South Korea
- 5.3.3.6 South East Asia (Singapore, Malaysia, Thailand, Indonesia, Vietnam, and Philippines)
- 5.3.3.7 Rest of Asia-Pacific
- 5.3.4 Europe
- 5.3.4.1 United Kingdom
- 5.3.4.2 Germany
- 5.3.4.3 France
- 5.3.4.4 Spain
- 5.3.4.5 Italy
- 5.3.4.6 BENELUX (Belgium, Netherlands, and Luxembourg)
- 5.3.4.7 NORDICS (Denmark, Finland, Iceland, Norway, and Sweden)
- 5.3.4.8 Rest of Europe
- 5.3.5 Middle East and Africa
- 5.3.5.1 United Arab of Emirates
- 5.3.5.2 Saudi Arabia
- 5.3.5.3 South Africa
- 5.3.5.4 Nigeria
- 5.3.5.5 Rest of Middle East And Africa
- 5.3.1 North America
6 Competitive Landscape
- 6.1 Market Concentration
- 6.2 Strategic Moves
- 6.3 Market Share Analysis
- 6.4 Company Profiles (includes Global level Overview, Market level overview, Core Segments, Financials as available, Strategic Information, Market Rank/Share for key companies, Products & Services, and Recent Developments)
- 6.4.1 DHL Group
- 6.4.2 FedEx
- 6.4.3 United Parcel Service, Inc. (UPS)
- 6.4.4 Kuehne + Nagel International AG
- 6.4.5 PGL (Primary Global Logistics)
- 6.4.6 DSV
- 6.4.7 CEVA Logistics (CMA CGM)
- 6.4.8 XPO
- 6.4.9 BDP International
- 6.4.10 GEODIS
- 6.4.11 Maersk Logistics & Services
- 6.4.12 Scan Global Logistics
- 6.4.13 PLS Logistics
- 6.4.14 SEKO Logistics
- 6.4.15 Rhenus Logistics
- 6.4.16 Expeditors International
- 6.4.17 Toll Group
- 6.4.18 Atlantic Logistics
- 6.4.19 Logistics Plus Inc.
- 6.4.20 Noble Supply & Logistics
7 Market Opportunities & Future Outlook
- 7.1 White-space & Unmet-need Assessment
 裝卸整平機市場規模、佔有率和成長分析:按操作方式、核心材料成分、最終用途產業、分銷管道和地區分類-2026-2033年產業預測
 全球物流市場:市場規模、佔有率、趨勢和成長分析(2026-2034)
 2026年全球智慧物流市場報告
 智慧物流自動化市場預測至2034年—全球解決方案、運輸方式、組件、技術、應用、最終用戶和區域分析
 航運和海事資訊通訊技術:市場佔有率分析、行業趨勢和統計數據、成長預測(2026-2031 年)
 2026-2030年全球物流市場亞太地區政府和教育物流:市場佔有率分析、行業趨勢和統計數據以及成長預測(2026-2031 年)按需物流:市場佔有率分析、產業趨勢與統計、成長預測(2026-2031)
 全球資料中心物流市場(2026 年)2026年貨櫃存放場即時定位系統(RTLS)全球市場報告