


 |
市場調查報告書
商品編碼
2061614
休閒車輛:市場佔有率分析、產業趨勢與統計、成長預測(2026-2031)Recreational Vehicle - Market Share Analysis, Industry Trends & Statistics, Growth Forecasts (2026 - 2031) |
||||||

※ 本網頁內容可能與最新版本有所差異。詳細情況請與我們聯繫。
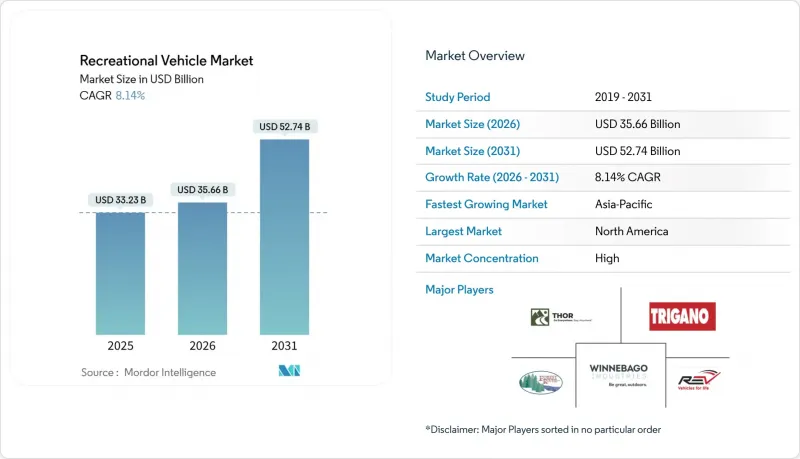
據 Mordor Intelligence 稱,2025 年休閒車 (RV) 市場價值為 332.3 億美元,預計到 2031 年將達到 527.4 億美元,而 2026 年為 356.6 億美元,預測期(2026-2031 年)的複合成長率為 8.14%。
本報告按類型(拖曳式休閒車和旅居車)、用途(住宅/個人和商業用途)、動力系統(內燃機、混合動力和純電動休閒車)、總長度(20英尺以下、20-30英尺和30英尺以上)以及地區進行細分。市場預測以價值(美元)和銷售(輛)為單位呈現。
全球休閒車市場趨勢及洞察
遠距辦公文化滿足了人們對行動生活方式的需求。
休閒車市場預測,到2025年,許多露營者將在營地工作,休閒車(RV)也逐漸成為混合型辦公室。年輕的車主青睞配備LTE路由器、太陽能板和折疊式的B型房車,促使汽車製造商在其2025款車型中將兼容Starlink的支架和120伏逆變器作為標準配置。作為回應,營地營運商已將電力設施升級至50安培,並安裝了休閒Wi-Fi。在KOA,由於營地業主進行再投資以確保長期住宿預訂,其特許經營續約率達到了95%。這種轉變模糊了休閒和住宅物業之間的界限,在淡季期間保持了穩定的運轉率,並提高了長期營地租賃的輔助收入。然而,關於行動辦公室折舊免稅額的稅收指南尚未明確,這會帶來合規風險,可能會減緩這種模式的普及。
國內旅遊業蓬勃發展,露營地基礎設施也隨之成長。
2020年代初期的邊境關閉促使休閒支出轉向國內自駕遊,即使航空公司在2025年恢復燃油額外費用後,這一趨勢依然持續。在澳大利亞,2023年記錄的房車和露營旅行次數達1,530萬次,消費額達143億澳元(95億美元)。在美國,州立公園系統在2024年累計超過2億美元,用於改善電力和排水基礎設施,以應對力更大的旅居車。像Sun Communities這樣的私募股權集團收購了12個房車度假村,統一了設施標準,並在需求旺盛的地區將每晚房價提高了8%至12%。雖然休閒車市場直接受惠於接待能力的提升,主要公園在旺季的運轉率超過95%,但大量非計畫旅客湧向服務匱乏、監管不力的零散公共土地。如果薪資成長跟不上,提高使用費可能會引發人們對新手露營者經濟負擔的擔憂。
高利率環境推高了貸款成本。
儘管利率有所放鬆,但貸款環境依然緊張,抑制了對價格敏感的拖掛式房車的需求。由於聯準會將政策利率維持在2025年全年5.25%至5.50%不變,預計房車貸款的年利率將升至9.5%至13.5%,這意味著一輛價值5萬美元的拖掛式房車,15年期貸款,每月還款額將增加150至250美元。次級貸款借款人面臨近20%的利率,實際上被排除在新車市場之外,導致對老舊二手車的需求增加。由於庫存融資的利息負擔給經銷商訂單帶來壓力,Winnebago公司2025年第一季的銷售額下降了19.5%,至5.506億美元。金融機構將最低首付比例提高到15%,進一步減少了首次購車者的到店次數。雖然寬鬆的貨幣政策會立即提振銷售數據,但利率波動可能會使購屋能力成為首要考量。
細分市場分析
由於價格實惠且可與現有皮卡相容,拖曳式休閒車(RV)預計到2025年將佔RV市場出貨量的62.44%。旅行拖車涵蓋了從16英尺到35英尺的各種樓層平面圖,能夠滿足從極簡主義情侶到大家庭等不同用戶的需求;而第五輪拖車則吸引了那些重視鵝頸式拖車穩定性的長途旅行者。折疊式露營車和皮卡車廂式房車則透過解決車庫高度和越野駕駛的限制,進一步拓展了目標市場。
以賓士Sprinter和福特Transit底盤為基礎的緊湊型B級旅居車,因其操控性受到注重駕駛體驗的年輕買家青睞,預計到2031年將以9.26%的複合年成長率成長,超過拖掛式房車。折疊式露營車迎合了儲物空間有限的車主,但由於微型旅居車的競爭,其成長前景正在放緩。 THOR將Entegra Coach的柴油動力旅居車生產線整合到Tiffin旗下,顯示其規模經濟效益的提升以及高價房旅居車產品線的持續精簡。 A級豪華房車保持其高階地位,但由於燃油成本飆升和超過20萬美元的定價,其銷售面臨壓力。 C級房車兼具操控性與內部空間,對年輕家庭頗具吸引力。隨著汽車製造商將貨車平台改造為生活空間,電氣化和混合動力技術將加劇競爭,從而擴大休閒車市場。
預計到2025年,國內房車擁有量將佔總需求的70.63%,這反映了週末露營、長途自駕遊以及預計新增的100萬常住居住者的需求成長。退休人士傾向選擇A級房車進行季節性旅行,而薪資家庭則選擇可拖掛式房車,以便季節性停放。 54%的遠距辦公家庭在房車內辦公,將休閒與工作完美融合。
商業領域正以8.54%的複合年成長率快速成長,其應用領域包括點對點租賃、活動車隊服務以及行動指揮中心。 Cruise America和El Monte兩家公司共營運約8,000輛傳統租賃車輛,但由於其平台上的車輛資訊超過5萬條,供應已多元化拓展次市場。企業用戶正將豪華巴士整修成“移動會議室”,每日租金超過1000美元。商業用途的成長不僅豐富了收入來源,也使休閒車市場免受純粹零售週期的影響。
區域分析
預計到2025年,北美將佔據全球房車銷售59.52%的主導地位。這得歸功於美國1120萬個房車家庭以及遍布全國的2500家經銷商組成的強大網路。然而,Thor Industries公司卻遭遇困境,其2026會計年度第一季北美銷售額年減13.4%至16.8億美元。這主要是由於高額年利率抑制了經銷商的訂單。儘管經銷商庫存水準有所波動,但其他因素也發揮了作用。二手車價格下跌以及加州二手停車禁令促使旅行者更多地選擇付費露營地,這對露營地營運商來說無疑是利好消息。加拿大的優勢在接近性美國供應鏈,以及有利的外匯帶來的跨國採購吸引力。相較之下,墨西哥房車市場仍然是一個小眾市場,受限於露營地密度較低。
亞太地區是成長最快的地區,預計年複合成長率將達到9.54%。澳洲位居榜首,其註冊的房車和旅居車數量已達908,513輛,較2019年增加了21%。儘管澳洲預計到2024年將生產25,185輛,但仍進口了近20,000輛,其中95%產自中國工廠,價格比當地價格低8,000至12,000美元。中國已成為第四大國內市場,儘管基礎設施不足(僅廣東省就有不到20個專用露營地),但仍售出了14,365輛。日本和韓國的需求主要集中在基於豐田Hiace和現代Staria平台打造的微型露營車上,這些車輛專為在狹窄的都市區道路上行駛而設計。
歐洲老牌房車製造商Trigano、Knauss-Tabbert和Hymer正面臨消費者謹慎消費的局面。 Trigano 2024/25會計年度上半年的銷售額下降5.9%,至15.6億歐元(16.9億美元)。在德國,排放氣體法規和柴油價格上漲抑制了旅居車需求;而在英國,脫歐後關稅摩擦的影響仍在持續。西班牙和葡萄牙等南歐市場受益於溫暖的氣候,得以維持淡季使用。東歐市場潛力巨大,但需要開發露營地並資金籌措才能刺激需求。整體而言,歐洲約佔休閒車市場的四分之一,但其成長速度落後於北美和亞太地區。
其他好處:
- Excel格式的市場預測(ME)表
- 3個月的分析師支持
目錄
第1章:引言
- 研究假設和市場定義
- 調查範圍
第2章:調查方法
第3章執行摘要
第4章 市場狀況
- 市場概覽
- 市場促進因素
- 遠距辦公文化滿足了人們對行動生活方式的需求。
- 國內旅遊業蓬勃發展,露營地基礎建設也隨之興起。
- 房車融資和P2P租賃平台的擴張
- OEM廠商零排放房車產品線電氣化藍圖
- 透過OTA連結開發訂閱收入來源
- 面向消費者的線上銷售正在給經銷商的利潤率帶來壓力。
- 市場限制因素
- 高利率推高了貸款成本。
- 底盤和零件供應瓶頸問題依然存在。
- 二手房車供應過剩導致價格下跌。
- 地方政府加強對都市區夜間停車的執法力度
- 價值/供應鏈分析
- 監理情勢
- 技術展望
- 波特五力分析
第5章 市場規模與成長預測
- 按類型
- 拖曳式房車
- 旅行拖車
- 第五輪拖車
- 折疊式露營拖車
- 卡車露營車
- 露營車
- A級
- B級(露營車)
- C級
- 拖曳式房車
- 透過使用
- 家庭/個人
- 商業用途(租賃車輛、移動辦公室、活動)
- 透過推進力
- 內燃機(ICE)
- 混合
- 電池驅動房車
- 按長度
- 不到20英尺
- 20-30英尺
- 超過30英尺
- 按地區
- 北美洲
- 美國
- 加拿大
- 其他北美國家
- 南美洲
- 巴西
- 阿根廷
- 其他南美國家
- 歐洲
- 德國
- 英國
- 法國
- 西班牙
- 義大利
- 荷蘭
- 其他歐洲國家
- 亞太地區
- 中國
- 日本
- 印度
- 韓國
- 澳洲和紐西蘭
- 其他亞太國家
- 中東和非洲
- GCC
- 土耳其
- 南非
- 奈及利亞
- 肯亞
- 其他中東和非洲國家
- 北美洲
第6章 競爭情勢
- 市場集中度
- 策略趨勢
- 市佔率分析
- 公司簡介
- Thor Industries Inc.
- Forest River Inc.
- Winnebago Industries Inc.
- REV Group Inc.
- Trigano SA
- Knaus Tabbert AG
- Jayco Inc.
- Grand Design RV Co.
- Keystone RV Co.
- Airstream Inc.
- Hymer GmbH
- Burstner GmbH
- Dethleffs GmbH
- Hobby-Wohnwagenwerk
- Adria Mobil doo
- Triple E Recreational Vehicles
- Tiffin Motorhomes Inc.
- Coachmen RV
- Gulf Stream Coach Inc.
- Leisure Travel Vans
第7章 市場機會與未來展望
According to Mordor Intelligence, the recreational vehicle market size was valued at USD 33.23 billion in 2025 and estimated to grow from USD 35.66 billion in 2026 to reach USD 52.74 billion by 2031, at a CAGR of 8.14% during the forecast period (2026-2031).
This report is Segmented by Type (Towable Recreational Vehicles and Motorhomes), Application (Domestic/Personal Use and Commercial), Propulsion (Internal Combustion Engine, Hybrid, and Battery Electric Recreational Vehicles), Length Category (Below 20 Feet, 20 To 30 Feet, and Above 30 Feet), and Geography. The Market Forecasts are Provided in Terms of Value (USD) and Volume (Units).
Global Recreational Vehicle Market Trends and Insights
Remote-Work Culture Sustaining Mobile Living Demand
In the recreational vehicle market, Most of the campers worked from campsites in 2025, indicating that recreational vehicles (RVs) are now doubling as hybrid offices. Younger owners gravitate toward Class B vans outfitted with LTE routers, solar arrays, and fold-down desks, prompting OEMs to add Starlink-ready mounts and 120-volt inverters as standard features on 2025 models. Campground operators responded by upgrading electrical pedestals to 50-amp service and installing fiber-optic Wi-Fi; KOA registered a 95% franchise-renewal rate as park owners reinvested to capture extended-stay bookings. The shift blurs the boundary between leisure and residential real estate, creating dependable off-season occupancy and elevating ancillary revenue from long-term site leases. However, unresolved tax guidance on depreciation deductions for mobile offices creates compliance risk that could temper adoption.
Domestic Tourism Boom and Campground Infrastructure Growth
Border closures earlier in the decade redirected leisure spending to domestic road trips, and the habit persisted as airlines reinstated fuel surcharges in 2025. Australia logged 15.3 million caravan and camping trips in 2023, generating AUD 14.3 billion (USD 9.5 billion) in spending. In the United States, state park systems collectively earmarked more than USD 200 million in 2024 for electrification and wastewater hookups, increasing suitability for larger motorhomes. Private-equity groups such as Sun Communities acquired 12 RV-resort portfolios, standardized amenities, and lifted nightly rates 8%-12% in high-demand corridors. The recreational vehicle market benefits directly from the capacity build-out, yet peak-season occupancy exceeding 95% at flagship parks funnels spontaneous travelers toward dispersed public lands where services are minimal and regulatory enforcement is inconsistent. Rising fees could spark affordability concerns for entry-level campers if wage growth lags.
High Interest-Rate Environment Inflating Loan Costs
Credit remains tight even as rates ease, curbing demand in price-sensitive towable categories. The Federal Reserve held its target rate at 5.25%-5.50% throughout 2025, pushing RV loan APRs into a 9.5%-13.5% band, adding USD 150-USD 250 to monthly payments on a USD 50,000 towable financed over 15 years. Subprime borrowers faced rates near 20%, effectively excluding them from the new-unit market and swelling demand for aging used inventory. Winnebago's Q1 FY 2025 revenue slid 19.5% to USD 550.6 million, with floorplan interest expense squeezing dealer orders. Lenders raised minimum down payments to 15%, further dampening first-time buyer traffic. Monetary easing would provide an immediate volume catalyst, but rate volatility will keep affordability center stage.
Other drivers and restraints analyzed in the detailed report include:
- Expansion of RV Financing and Peer-To-Peer Rental Platforms
- OEM Electrification Road-Maps For Zero-Emission RV Lines
- Oversupply of Used RVs Driving Price Depreciation
For complete list of drivers and restraints, kindly check the Table Of Contents.
Segment Analysis
Towable recreational vehicles accounted for 62.44% of 2025 shipments within the recreational vehicle market, buoyed by lower entry prices and compatibility with existing pickups. Travel trailers span 16- to 35-foot floorplans, serving everyone from minimalist couples to large families, whereas fifth-wheels attract long-haul travelers who value gooseneck stability. Folding campers and truck-bed units address garage-height or off-road constraints, broadening demographic reach.
Motorhomes are projected to outpace towables at a 9.26% CAGR through 2031, powered by compact Class B vans on Mercedes Sprinter and Ford Transit chassis that resonate with younger buyers prioritizing drivability. Folding campers cater to storage-challenged owners, but competition from micro motorhomes dampens growth prospects. THOR's move to consolidate Entegra Coach's diesel-pusher production under Tiffin enhances scale efficiencies and signals continued rationalization in high-price motorhome lines. Class A luxury coaches maintain premium status but face volume pressure from high fuel costs and price tags north of USD 200,000. Class C rigs offer balanced handling and interior space, appealing to young families. Electrification and hybridization will intensify competition as OEMs repurpose delivery-van platforms into human-habitat configurations, expanding the recreational vehicle market footprint.
Domestic ownership represented 70.63% of 2025 demand, reflecting weekend camping, extended road trips, and a growing cohort of full-timers estimated at 1 million United States households. Retirees gravitate toward Class A rigs for seasonal migrations, while working families choose towables that can be parked seasonally. Fifty-four percent of remote-work households perform their jobs from an RV, blending leisure and livelihood.
Commercial deployments, advancing at an 8.54% CAGR, leverage peer-to-peer rentals, fleet hospitality at events, and mobile command centers. Cruise America and El Monte operate roughly 8,000 traditional rentals, but platform listings exceed 50,000, dispersing supply to secondary markets. Corporate users retrofit luxury coaches as boardrooms on wheels, commanding daily rates above USD 1,000. Rising commercial utilization diversifies revenue and insulates the recreational vehicle market from pure retail cycles.
Geography Analysis
North America commanded a dominant 59.52% share of the global RV revenue in 2025, buoyed by 11.2 million RV-owning households in the United States and a robust network of 2,500 dealers. However, Thor Industries faced a setback, with North American sales dipping 13.4% year-over-year to USD 1.68 billion in Q1 FY 2026, primarily due to high APRs that tempered dealer orders. While dealer inventory levels shifted, other dynamics played out: used-unit depreciation and municipal parking bans in California nudged travelers towards fee-based campsites, much to the delight of campground operators. Canada's advantage lies in its closeness to the United States supply chains and the allure of currency-driven cross-border purchases. In contrast, Mexico's RV market remains a niche player, hampered by a sparse campground density.
Asia-Pacific is the fastest-growing territory at a projected 9.54% CAGR, led by Australia's 908,513 registered caravans and motorhomes, up 21% since 2019. The country manufactured 25,185 units in 2024 but imported nearly 20,000, 95% from Chinese factories that undercut local pricing by USD 8,000-USD 12,000. China sold 14,365 units, becoming the fourth-largest national market despite infrastructure shortfalls-Guangdong hosts fewer than 20 dedicated campsites. Japanese and South Korean demand centers on micro campers based on the Toyota HiAce and Hyundai Staria platforms that navigate narrow urban streets.
Europe's entrenched players-Trigano, Knaus Tabbert, and Hymer-face a cautious consumer backdrop: Trigano's half-year FY 2024/25 revenue slipped 5.9% to EUR 1.56 billion (USD 1.69 billion). Germany's emissions zones and elevated diesel prices weigh on motorhome appetite, while the United Kingdom digests post-Brexit tariff friction. Southern markets such as Spain and Portugal enjoy milder climates, sustaining off-season utilization. Eastern Europe represents untapped potential but requires campground investment and financing access to unlock demand. Collectively, Europe contributes roughly one-quarter of the recreational vehicle market, though growth lags North America and Asia-Pacific.
- Thor Industries Inc.
- Forest River Inc.
- Winnebago Industries Inc.
- REV Group Inc.
- Trigano SA
- Knaus Tabbert AG
- Jayco Inc.
- Grand Design RV Co.
- Keystone RV Co.
- Airstream Inc.
- Hymer GmbH
- Burstner GmbH
- Dethleffs GmbH
- Hobby-Wohnwagenwerk
- Adria Mobil d.o.o
- Triple E Recreational Vehicles
- Tiffin Motorhomes Inc.
- Coachmen RV
- Gulf Stream Coach Inc.
- Leisure Travel Vans
Additional Benefits:
- The market estimate (ME) sheet in Excel format
- 3 months of analyst support
TABLE OF CONTENTS
1 Introduction
- 1.1 Study Assumptions and Market Definition
- 1.2 Scope of the Study
2 Research Methodology
3 Executive Summary
4 Market Landscape
- 4.1 Market Overview
- 4.2 Market Drivers
- 4.2.1 Remote-Work Culture Sustaining Mobile Living Demand
- 4.2.2 Domestic Tourism Boom and Campground Infrastructure Growth
- 4.2.3 Expansion of RV Financing and Peer-to-Peer Rental Platforms
- 4.2.4 OEM Electrification Road-Maps for Zero-Emission RV Lines
- 4.2.5 OTA Connectivity Unlocking Subscription Revenue Streams
- 4.2.6 Direct-to-Consumer Online Sales Shrinking Dealer Margins
- 4.3 Market Restraints
- 4.3.1 High Interest-Rate Environment Inflating Loan Costs
- 4.3.2 Persistent Chassis and Component Supply Bottlenecks
- 4.3.3 Oversupply of Used RVs Driving Price Depreciation
- 4.3.4 Municipal Crack-Downs On Urban Overnight Parking
- 4.4 Value/Supply-Chain Analysis
- 4.5 Regulatory Landscape
- 4.6 Technological Outlook
- 4.7 Porter's Five Forces Analysis
- 4.7.1 Bargaining Power of Suppliers
- 4.7.2 Bargaining Power of Buyers
- 4.7.3 Threat of New Entrants
- 4.7.4 Threat of Substitutes
- 4.7.5 Competitive Rivalry
5 Market Size and Growth Forecasts (Value (USD) and Volume (Units))
- 5.1 By Type
- 5.1.1 Towable RVs
- 5.1.1.1 Travel Trailers
- 5.1.1.2 Fifth-Wheel Trailers
- 5.1.1.3 Folding Camp Trailers
- 5.1.1.4 Truck Campers
- 5.1.2 Motorhomes
- 5.1.2.1 Class A
- 5.1.2.2 Class B (Camper Vans)
- 5.1.2.3 Class C
- 5.1.1 Towable RVs
- 5.2 By Application
- 5.2.1 Domestic/Personal Use
- 5.2.2 Commercial (Rental Fleets, Mobile Offices, Events)
- 5.3 By Propulsion
- 5.3.1 Internal-Combustion Engine (ICE)
- 5.3.2 Hybrid
- 5.3.3 Battery-Electric RVs
- 5.4 By Length Category
- 5.4.1 Below 20 feet
- 5.4.2 20 to 30 feet
- 5.4.3 Above 30 feet
- 5.5 By Geography
- 5.5.1 North America
- 5.5.1.1 United States
- 5.5.1.2 Canada
- 5.5.1.3 Rest of North America
- 5.5.2 South America
- 5.5.2.1 Brazil
- 5.5.2.2 Argentina
- 5.5.2.3 Rest of South America
- 5.5.3 Europe
- 5.5.3.1 Germany
- 5.5.3.2 United Kingdom
- 5.5.3.3 France
- 5.5.3.4 Spain
- 5.5.3.5 Italy
- 5.5.3.6 Netherlands
- 5.5.3.7 Rest of Europe
- 5.5.4 Asia-Pacific
- 5.5.4.1 China
- 5.5.4.2 Japan
- 5.5.4.3 India
- 5.5.4.4 South Korea
- 5.5.4.5 Australia and New Zealand
- 5.5.4.6 Rest of Asia-Pacific
- 5.5.5 Middle East and Africa
- 5.5.5.1 GCC
- 5.5.5.2 Turkey
- 5.5.5.3 South Africa
- 5.5.5.4 Nigeria
- 5.5.5.5 Kenya
- 5.5.5.6 Rest of Middle East and Africa
- 5.5.1 North America
6 Competitive Landscape
- 6.1 Market Concentration
- 6.2 Strategic Moves
- 6.3 Market Share Analysis
- 6.4 Company Profiles (Includes Global level Overview, Market level Overview, Core Segments, Financials as available, Strategic Information, Market Rank/Share for key companies, Products and Services, Recent Developments)
- 6.4.1 Thor Industries Inc.
- 6.4.2 Forest River Inc.
- 6.4.3 Winnebago Industries Inc.
- 6.4.4 REV Group Inc.
- 6.4.5 Trigano SA
- 6.4.6 Knaus Tabbert AG
- 6.4.7 Jayco Inc.
- 6.4.8 Grand Design RV Co.
- 6.4.9 Keystone RV Co.
- 6.4.10 Airstream Inc.
- 6.4.11 Hymer GmbH
- 6.4.12 Burstner GmbH
- 6.4.13 Dethleffs GmbH
- 6.4.14 Hobby-Wohnwagenwerk
- 6.4.15 Adria Mobil d.o.o
- 6.4.16 Triple E Recreational Vehicles
- 6.4.17 Tiffin Motorhomes Inc.
- 6.4.18 Coachmen RV
- 6.4.19 Gulf Stream Coach Inc.
- 6.4.20 Leisure Travel Vans
7 Market Opportunities and Future Outlook

 休閒車市場-2026-2032年全球市場預測
 休閒車市場分析及預測(至2035年):類型、產品類型、服務、技術、組件、應用、材料類型、最終用戶、安裝配置
 休閒車市場機會、成長要素、產業趨勢分析及2026-2035年預測
 全球休閒車市場
 2026-2030年全球休閒車(RV)市場
 露營車(RV)市場規模、佔有率、成長及全球產業分析:按類型、應用和地區的洞察,2026-2034年的預測
 休閒車市場規模、佔有率和成長分析(按地區分類)-2026-2033年產業預測
 北美休閒車市場:市場佔有率分析、產業趨勢與統計、成長預測(2026-2031)歐洲休閒車:市場佔有率分析、產業趨勢與統計、成長預測(2026-2031)
 全球休閒車市場:依類型、應用和地區劃分 - 市場規模、行業趨勢、機會分析和預測(2025-2033 年)