


 |
市場調查報告書
商品編碼
1906981
北美休閒車市場:市場佔有率分析、產業趨勢與統計、成長預測(2026-2031)North America Recreational Vehicle - Market Share Analysis, Industry Trends & Statistics, Growth Forecasts (2026 - 2031) |
||||||
※ 本網頁內容可能與最新版本有所差異。詳細情況請與我們聯繫。
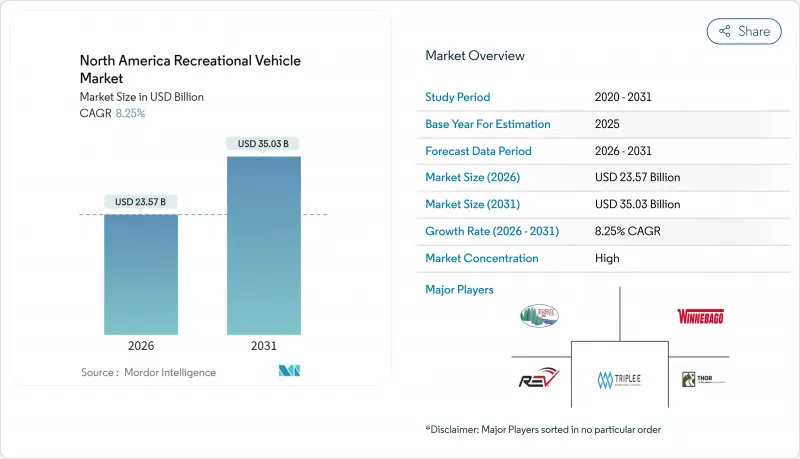
預計到 2025 年,北美休閒車市場價值將達到 217.7 億美元,到 2026 年將成長至 235.7 億美元,到 2031 年將成長至 350.3 億美元,在預測期(2026-2031 年)內複合年成長率為 8.25%。
遠距辦公的柔軟性正在加速房車需求,房車正從週末度假工具轉變為實用的長期生活空間,而不斷上升的家庭房車擁有率也擴大了消費群。年輕買家數量不斷成長,產品設計也朝著更互聯、科技感十足的方向發展。隨著製造商加大對混合動力汽車動力和電池式電動車的投入,電動驅動系統正蓬勃發展。同時,點對點租賃的同步成長提供了新的使用管道,與擁有房車形成互補,提高了車輛的利用率。儘管宏觀經濟波動,但主要供應商的寡占格局正在加速創新週期,並緩解供應鏈衝擊。
北美休閒車市場趨勢與洞察
電動和混合動力房車車型的成長
純電動和混合動力傳動系統代表了北美休閒車市場正在發生的最具創新性的產品變革。 Thor Industries推出了一款A級混合動力房車,配備140度電池組和汽油增程器,總續航里程可達500英里。這種設計消除了里程焦慮,並符合新的低排放氣體法規。電力扭力提升了爬坡性能,更安靜的運作也提高了露營舒適度。製造商透過將大容量電池組與車頂太陽能板結合,強調了離訊息能力,使房車停放時也能為住宅提供輔助電源。 Thor自2019年以來在範圍1和範圍2排放方面取得的減排成果,以及其永續發展理念,增強了該品牌對具有環保意識的買家的吸引力。隨著充電基礎設施的擴展,電動房車的普及門檻也不斷降低。
新冠疫情後國內自駕遊旅遊增加
即使邊境限制放寬,國內公路旅行仍然是國際旅行的主要替代方案。大約有810萬美國家庭擁有房車,預計未來五年這一數字將成長至1690萬。平均年使用天數將從2021年的20天增加到2025年的30天,顯示房車已深度融入人們的生活方式。 50歲以下的年輕消費者是新購屋的主導,這支撐了長期更換需求的持續性。品牌忠誠度很高,超過80%的疫情期間購屋者表示有意再次購買同一品牌,這為主要製造商帶來了可預測的重複銷售。即使旅遊業恢復正常,人們對本地體驗和社交距離的休閒的偏好也支撐著持續的需求。
燃油價格波動推高了旅遊成本。
2024年美國汽油平均價格將為每加侖3.30美元,比2023年下降20美分。 A級旅居車每行駛6-10英里消耗1加侖汽油,兩週的行程可能耗費1000美元的燃油費用,因此旅行計畫對汽油價格波動非常敏感。柴油車的價格波動模式則有所不同,使得商用車隊的預算編制更加複雜。持續高成本重新激發了消費者對混合動力系統和輕質複合材料的興趣,這些材料能夠提高燃油經濟性。電氣化是一種結構性解決方案,但由於充電基礎設施建設需要大量投資,因此預計其廣泛普及還需要數年時間。
細分市場分析
至2025年,拖曳式房車將佔北美休閒車市場的63.52%,而旅居車預計將成為北美房車市場的主要成長引擎,年複合成長率將達到12.93%。高階A型房車擁有媲美住宅的內裝、拓展艙以及可減少排放氣體並延長續航里程的混合動力傳動系統。 B型露營車的目標客群是注重出行便利性和隱密露營體驗的都市區白領。 C型房車則強調價格與生活空間的平衡,因此更受家庭用戶的青睞。製造商正採用模組化生產方式來滿足多樣化的需求,並透過在不同車型之間靈活切換來保持規模經濟效益。
由於購置成本低廉且皮卡車型普遍普及,拖曳式房車仍保持著市場地位。旅行拖車憑藉其靈活多樣的佈局和易於維護的特點,在該類別中佔據主導地位。第五輪拖曳式房車提供多層佈局和住宅,適合季節性旅行(例如候鳥族)。折疊式露營車和皮卡露營車分別迎合了入門預算市場和越野愛好者的需求。這種多功能性使得拖曳式房車的銷售量保持強勁,即使越來越多的富裕消費者轉向旅居車車。
到2025年,個人用途將佔北美休閒車市場的69.48%,這反映了該行業的休閒起源。然而,預計到2031年,商業用途將以9.22%的複合年成長率成長,超過北美休閒車市場的整體成長率。企業正在使用客製化休閒車作為移動指揮中心、臨時展示室或遠端計劃的臨時員工住所。醫療系統正在使用自主型診所來擴大農村地區的醫療覆蓋範圍。住宿公司正在開發豪華露營地,將豪華單位改造為高階住宿設施並收取高價。
商務旅行和休閒旅遊界線的模糊化推動了雙用途採購的興起,使得相關支出既可以歸入個人預算,也可以歸入商用預算。某些州提供的稅收優惠也進一步促進了商用車隊的組成。如今,汽車製造商提供符合企業規格的工廠預裝辦公艙、衛星連接和發電機組。
其他福利:
- Excel格式的市場預測(ME)表
- 3個月的分析師支持
目錄
第1章 引言
- 研究假設和市場定義
- 調查範圍
第2章調查方法
第3章執行摘要
第4章 市場情勢
- 市場概覽
- 市場促進因素
- 電動和混合動力房車車型的成長
- 新冠疫情後國內自駕遊旅遊增加
- 遠距辦公的日益普及使得長期房車生活成為可能。
- 透過先進的連結性和物聯網技術提升使用者體驗
- P2P房車共享平台的擴展
- 州政府對旅居車所有權提供優惠的稅收優惠政策獎勵措施
- 市場限制
- 燃油價格波動導致差旅成本增加
- 利率上升影響貸款負擔能力
- 由於營地容量不足,使用受到限制
- 房車租賃平台的興起
- 價值/供應鏈分析
- 監管環境
- 技術展望
- 波特五力模型
- 供應商的議價能力
- 買方/消費者的議價能力
- 新進入者的威脅
- 替代品的威脅
- 競爭對手之間的競爭
第5章 市場規模及成長預測(價值(美元)及銷售量(單位))
- 按類型
- 拖曳式房車
- 旅行拖車
- 第五輪拖車
- 折疊式露營拖車
- 卡車露營車
- 旅居車
- A型
- B型
- C型
- 拖曳式房車
- 透過使用
- 對於個人
- 商業的
- 按燃料類型
- 汽油
- 柴油引擎
- 混合
- 電池式電動車
- 按銷售管道
- 新房車銷售
- 二手房車銷售
- 按國家/地區
- 美國
- 加拿大
- 北美其他地區
第6章 競爭情勢
- 市場集中度
- 策略趨勢
- 市佔率分析
- 公司簡介
- Thor Industries Inc.
- Forest River Inc.
- Winnebago Industries Inc.
- REV Group
- Tiffin Motorhomes Inc.
- Entegra Coach Inc.
- NeXus RV
- Cruiser RV
- Triple E Recreational Vehicles
- Newmar Corporation
- Jayco Inc.
- Airstream Inc.
- Lance Camper Manufacturing Corp.
- Pleasure-Way Industries
- Keystone RV Company
- Coachmen RV
- Grand Design RV
- Roadtrek Inc.
- Fleetwood RV
- Holiday Rambler
第7章 市場機會與未來展望
The North America RV market was valued at USD 21.77 billion in 2025 and estimated to grow from USD 23.57 billion in 2026 to reach USD 35.03 billion by 2031, at a CAGR of 8.25% during the forecast period (2026-2031).
Demand accelerates as remote work flexibility converts RVs from weekend escapes into viable long-term living spaces, while rising household ownership broadens the consumer base. Younger buyers represent a growing share of purchases, nudging product design toward connected, tech-rich floor plans. Electrified drivetrains gather momentum, helped by manufacturer commitments to hybrid and battery-electric models. Parallel growth in peer-to-peer rentals adds an access alternative that complements ownership and increases vehicle utilization. Despite macro-economic swings, the oligopolistic structure of leading suppliers speeds innovation cycles and cushions supply-chain shocks.
North America Recreational Vehicle Market Trends and Insights
Growth in Electrified & Hybrid RV Models
Battery-electric and hybrid powertrains represent the most disruptive product shift underway in the North America recreational vehicle market. Thor Industries unveiled a hybrid Class A coach featuring a 140-kWh battery pack and a gasoline range extender that delivers a 500-mile total range. The design answers range anxiety and qualifies for emerging low-emission regulations. Electric torque improves hill-climbing performance, while silent operation raises campsite comfort. Manufacturers highlight off-grid capability by pairing large battery packs with roof solar arrays, enabling auxiliary power for residential needs when parked. Sustainability messaging aligns with the Scope 1 and 2 emissions cut Thor achieved since 2019, sharpening brand appeal to eco-conscious buyers. As charging infrastructure grows, electric RV ownership barriers continue to fall.
Increased Domestic Road-Trip Tourism Post-COVID
Domestic road travel remains the preferred alternative to international trips even after border restrictions eased. Approximately 8.1 million American households own an RV, and 16.9 million are expected to own an RV in the coming five years. Average annual usage days jumped from 20 in 2021 to 30 in 2025, signaling deeper lifestyle integration. Younger cohorts under 50 now dominate new purchases, reinforcing a long replacement-demand runway. With high brand loyalty, more than 80% of pandemic-era buyers intend to repurchase the same marque, which creates predictable repeat sales for leading OEMs. The shift toward localized experiences and socially distanced recreation underpins persistent demand even as broader tourism normalizes.
Volatile Fuel Prices Increasing Trip Costs
Average U.S. gasoline prices averaged USD 3.30 per gallon in 2024, down 20 cents from 2023. Class A motorhomes consume 1 gallon every 6-10 miles, so a two-week tour can require USD 1,000 in fuel, making travel decisions sensitive to pump swings. Diesel variants face separate volatility patterns that complicate budgeting for commercial fleets. Persistently high costs have revived consumer interest in hybrid drivetrains and lighter composite materials that improve mileage. Electrification provides a structural hedge but will take years to scale due to charging-site investments.
Other drivers and restraints analyzed in the detailed report include:
- Rising Popularity of Remote Work Enabling Long-Term RV Living
- Advanced Connectivity & IoT Enhancing User Experience
- Rising Interest Rates Impacting Financing Affordability
For complete list of drivers and restraints, kindly check the Table Of Contents.
Segment Analysis
Towable RVs held 63.52% of the North American Recreational Vehicle market share in 2025, while Motorhomes are forecast to log a 12.93% CAGR, positioning it as the principal growth engine for the North America RV market. Premium Type A models add residential finishes, slide-outs, and hybrid powertrains that reduce emissions and extend range. Type B camper vans target urban professionals who value maneuverability and stealth camping. Type C units balance price and livable space, widening appeal to families. Manufacturers deploy modular production that flexes between classes, preserving scale advantages while accommodating varied demand.
Towables retain relevance due to lower acquisition costs and the widespread availability of pickup trucks capable of towing. Travel trailers lead the category thanks to versatile floorplans and modest maintenance needs. Fifth-wheels add multi-level layouts and residential appliances suited for seasonal snowbird migration. Folding campers and truck campers serve entry-level budgets and off-road niches, respectively. This diversity keeps towable volume robust even as affluent cohorts shift into motorized products.
Private use captured 69.48% of the North American Recreational Vehicle market share in 2025, reflecting the recreational origins of the sector. Commercial usage, however, is forecast to compound at a 9.22% CAGR through 2031, outpacing the overall North America RV market size. Corporations deploy customized RVs as mobile command centers, pop-up showrooms, or temporary workforce housing on remote projects. Healthcare systems leverage self-contained clinics to expand rural reach. Hospitality firms outfit luxury units for glamping sites that command premium nightly rates.
The blurring of business and leisure travel fuels dual-use purchasing, allowing owners to classify expenses across personal and professional budgets. Tax advantages available in certain states further encourage commercial fleet formation. OEMs now offer factory-installed office pods, satellite connectivity, and generator packages that meet enterprise specifications.
The North America RV Market Report is Segmented by Type (Towable RVs and Motorhomes), Application (Private and Commercial), Fuel Type (Gasoline, Diesel, Hybrid, and Battery-Electric), Sales Channel (New RV Sales and Used RV Sales), and Geography (United States, Canada, and Rest of North America). The Market Forecasts are Provided in Terms of Value (USD) and Volume (Units).
List of Companies Covered in this Report:
- Thor Industries Inc.
- Forest River Inc.
- Winnebago Industries Inc.
- REV Group
- Tiffin Motorhomes Inc.
- Entegra Coach Inc.
- NeXus RV
- Cruiser RV
- Triple E Recreational Vehicles
- Newmar Corporation
- Jayco Inc.
- Airstream Inc.
- Lance Camper Manufacturing Corp.
- Pleasure-Way Industries
- Keystone RV Company
- Coachmen RV
- Grand Design RV
- Roadtrek Inc.
- Fleetwood RV
- Holiday Rambler
Additional Benefits:
- The market estimate (ME) sheet in Excel format
- 3 months of analyst support
TABLE OF CONTENTS
1 Introduction
- 1.1 Study Assumptions and Market Definition
- 1.2 Scope of the Study
2 Research Methodology
3 Executive Summary
4 Market Landscape
- 4.1 Market Overview
- 4.2 Market Drivers
- 4.2.1 Growth In Electrified and Hybrid RV Models
- 4.2.2 Increased Domestic Road-Trip Tourism Post-COVID
- 4.2.3 Rising Popularity Of Remote Work Enabling Long-Term RV Living
- 4.2.4 Advanced Connectivity and IoT Enhancing User Experience
- 4.2.5 Expansion Of RV-Sharing Peer-To-Peer Platforms
- 4.2.6 Favorable State Tax Incentives For Motorhome Ownership
- 4.3 Market Restraints
- 4.3.1 Volatile Fuel Prices Increasing Trip Costs
- 4.3.2 Rising Interest Rates Impacting Financing Affordability
- 4.3.3 Campground Capacity Shortages Limiting Usage
- 4.3.4 Proliferation Of RV Rental Platforms
- 4.4 Value / Supply-Chain Analysis
- 4.5 Regulatory Landscape
- 4.6 Technological Outlook
- 4.7 Porter's Five Forces
- 4.7.1 Bargaining Power of Suppliers
- 4.7.2 Bargaining Power of Buyers/Consumers
- 4.7.3 Threat of New Entrants
- 4.7.4 Threat of Substitute Products
- 4.7.5 Intensity of Competitive Rivalry
5 Market Size and Growth Forecasts (Value (USD) and Volume (Units))
- 5.1 By Type
- 5.1.1 Towable RVs
- 5.1.1.1 Travel Trailers
- 5.1.1.2 Fifth Wheel Trailers
- 5.1.1.3 Folding Camp Trailers
- 5.1.1.4 Truck Campers
- 5.1.2 Motorhomes
- 5.1.2.1 Type A
- 5.1.2.2 Type B
- 5.1.2.3 Type C
- 5.1.1 Towable RVs
- 5.2 By Application
- 5.2.1 Private
- 5.2.2 Commercial
- 5.3 By Fuel Type
- 5.3.1 Gasoline
- 5.3.2 Diesel
- 5.3.3 Hybrid
- 5.3.4 Battery-Electric
- 5.4 By Sales Channel
- 5.4.1 New RV Sales
- 5.4.2 Used RV Sales
- 5.5 By Country
- 5.5.1 United States
- 5.5.2 Canada
- 5.5.3 Rest of North America
6 Competitive Landscape
- 6.1 Market Concentration
- 6.2 Strategic Moves
- 6.3 Market Share Analysis
- 6.4 Company Profiles (includes Global level Overview, Market level overview, Core Segments, Financials as available, Strategic Information, Market Rank/Share for key companies, Products & Services, and Recent Developments)
- 6.4.1 Thor Industries Inc.
- 6.4.2 Forest River Inc.
- 6.4.3 Winnebago Industries Inc.
- 6.4.4 REV Group
- 6.4.5 Tiffin Motorhomes Inc.
- 6.4.6 Entegra Coach Inc.
- 6.4.7 NeXus RV
- 6.4.8 Cruiser RV
- 6.4.9 Triple E Recreational Vehicles
- 6.4.10 Newmar Corporation
- 6.4.11 Jayco Inc.
- 6.4.12 Airstream Inc.
- 6.4.13 Lance Camper Manufacturing Corp.
- 6.4.14 Pleasure-Way Industries
- 6.4.15 Keystone RV Company
- 6.4.16 Coachmen RV
- 6.4.17 Grand Design RV
- 6.4.18 Roadtrek Inc.
- 6.4.19 Fleetwood RV
- 6.4.20 Holiday Rambler
7 Market Opportunities and Future Outlook
- 7.1 Autonomous RVs to transform caravanning experience
- 7.2 Subscription-based RV ownership models
 休閒車市場-2026-2032年全球市場預測
 休閒車市場分析及預測(至2035年):類型、產品類型、服務、技術、組件、應用、材料類型、最終用戶、安裝配置
 休閒車市場機會、成長要素、產業趨勢分析及2026-2035年預測
 全球休閒車市場
 休閒車輛:市場佔有率分析、產業趨勢與統計、成長預測(2026-2031)
 2026-2030年全球休閒車(RV)市場
 露營車(RV)市場規模、佔有率、成長及全球產業分析:按類型、應用和地區的洞察,2026-2034年的預測
 休閒車市場規模、佔有率和成長分析(按地區分類)-2026-2033年產業預測歐洲休閒車:市場佔有率分析、產業趨勢與統計、成長預測(2026-2031)
 全球休閒車市場:依類型、應用和地區劃分 - 市場規模、行業趨勢、機會分析和預測(2025-2033 年)