


 |
市場調查報告書
商品編碼
2044104
亞太地區資料中心冷卻:市場佔有率分析、產業趨勢與統計及成長預測(2026-2031)Asia-Pacific Data Center Cooling - Market Share Analysis, Industry Trends & Statistics, Growth Forecasts (2026 - 2031) |
||||||

※ 本網頁內容可能與最新版本有所差異。詳細情況請與我們聯繫。
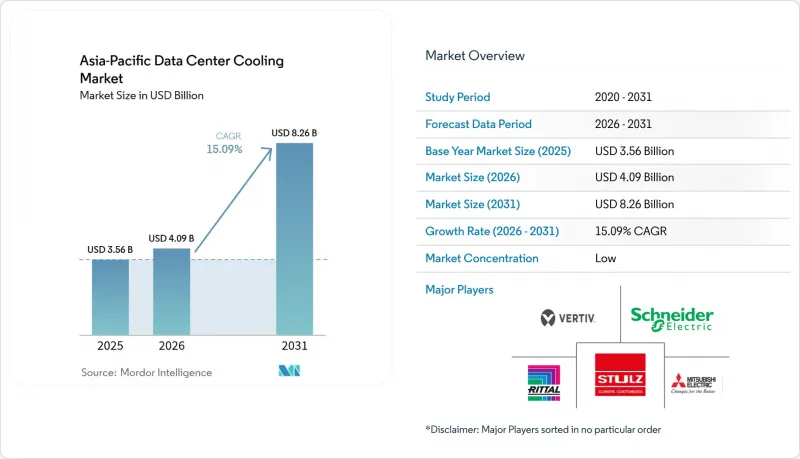
預計亞太地區資料中心冷卻市場將從 2025 年的 35.6 億美元成長到 2026 年的 40.9 億美元,到 2031 年達到 82.6 億美元,2026 年至 2031 年的複合年成長率為 15.09%。
人工智慧伺服器部署的加速、中國PUE值低於1.3的規定和新加坡SS 715:2025標準等能源效率法規的強制實施,以及微軟、谷歌、阿里巴巴和騰訊等公司超大規模資料中心的擴張,都推動了對高效能溫度控管系統的需求成長。隨著風冷在每機架30kW以上的應用場景中逐漸達到經濟和技術極限,液冷架構正受到越來越多的關注,但在現有設施和30kW以下的部署中,風冷解決方案仍然佔據主導地位。隨著營運商將建設週期從18個月縮短至6個月,能夠將硬體、軟體和快速預製技術相結合的供應商正在贏得訂單。儘管在2024年鋼鐵和半導體供不應求緩解後,供應鏈風險有所緩解,但東南亞地區熟練的暖通空調(HVAC)技術人員短缺仍然是一個短期瓶頸。
亞太地區資料中心冷卻市場趨勢及洞察。
AI/生成式 AI 驅動的機架功率密度提升正在加速向液冷技術的轉變。
隨著人工智慧叢集的興起,機架密度正從8-12kW提升至40-60kW,此時風冷系統在成本和散熱裕度方面都已接近極限。聯想的「Neptune」直連晶片平台於2025年部署在NTT東京園區,在支援50kW機架的同時,實現了40%的節能。此外,中國2024年標準規定,超過8kW的機櫃必須採用液冷。新加坡修訂後的SS 715標準要求高密度機房的PUE值低於1.2。在密度超過30kW的情況下,浸沒式冷卻設計無需冷卻器,可降低高達30%的總擁有成本,但由於OEM保固條款的限制以及缺乏熟悉絕緣液安全性的工程師,其普及速度緩慢。因此,亞太地區資料中心冷卻市場正在增加對液冷迴路泵、板片和熱交換器模組的投資。
主要雲端服務供應商的超大規模擴張是需求的基礎。
微軟在印度投資175億美元的計畫和谷歌在安得拉邦投資150億美元的園區,各自都需要200-300兆瓦的IT負荷,到2027年將消耗該地區15-20%的冷卻器產能。Oracle的多國區域專案模組化機械模組的交付週期為六個月,這加速了Vertiv和Schneider Electric的訂單成長。中國巨頭阿里巴巴和騰訊計畫在2025年新增180兆瓦的裝置容量,吸引它們的是廣東省和江蘇省的土地補貼政策,這些政策要求它們使用50%的可再生能源。這波超大規模浪潮正在使供應商市場兩極化,擁有高流動性智慧財產權和雄厚財務基礎(能夠提供供應商融資)的供應商從中受益。
不斷上漲的電力和土地成本給利潤率帶來了壓力。
預計到2025年,新加坡的電費將上漲至每千瓦時0.35新元(0.26美元),而該市土地短缺意味著到2030年僅能分配300兆瓦的新增IT容量,導致面積超過1000平方英尺(695平方英尺)的地塊價格飆升。在東京市中心,地價超過每平方公尺15,000美元,儘管延遲會帶來負面影響,但仍促使部分容量轉移到大阪。雪梨和香港也面臨類似的壓力,導致建設轉移到郊區和廣東省,但電網和光纖的短缺阻礙了快速擴張。空氣冷卻佔設施電力成本的40%,而水冷僅佔15%,因此成本上升正迫使現有營運商,即使是那些擁有棕地資產的營運商,也維修到直接晶片冷卻迴路。
細分市場分析
到2025年,風冷系統將佔銷售額的59.96%,這得益於成熟的營運經驗和豐富的成功案例。然而,隨著新一代人工智慧機架的功耗超過40kW,後門式熱交換器和浸沒式冷卻槽的密度將超過風扇驅動的精密空調機組,預計亞太地區資料中心冷卻市場液冷架構的市場規模將以16.13%的複合冷卻器成長。吉寶資料中心採用浸沒式冷卻系統後,PUE值達到1.03,與風冷基準相比,資本支出(Capex)降低了25%,營運成本(OpEx)降低了40%,並且完全省去了冰水機組。 CoolIT的晶片級直冷迴路實現了日本和澳洲資料中心機房50kW的改裝,使資產壽命延長了7年。
儘管液冷發展勢頭強勁,但在30kW以下的製冷量環境、自然冷卻時間較長的氣候條件以及印尼和越南等絕緣液技術欠缺的市場,風冷仍保持著戰術性優勢。大金的磁浮冷卻器在東京實現了每噸0.45kW的製冷量,即使在因用水限制而無法安裝冷卻塔的地區,風冷依然具有效用。在亞太資料中心冷卻市場,低密度區域採用風機盤管、高密度區域採用泵送液冷的混合配置方案仍備受青睞,這使得謹慎的業者更容易完成轉型。
到2025年,電腦室空氣處理機組仍將維持41.55%的市場佔有率,但市場需求正轉向控制液循環的幫浦、閥門和板式熱交換器。格蘭富和賽萊姆已與微軟和谷歌在印度簽訂契約,為其提供可處理35至60°C水溫的變速泵。阿法拉伐的CompaBlock板式熱交換器在浸沒式殼體內可實現95%的熱交換效率,並因此獲得了來自新加坡和東京的數兆瓦級訂單。
冷卻器正朝著高效能磁浮機組(用於空調機房)和緊湊型撬裝式熱交換器(用於液體循環區域)的方向發展。監控軟體市場目前成長最快,複合年成長率約17%,Schneider Electric的「EcoStruxure IT」和Vertiv的「Trellis」透過基於機器學習的設定點控制,可將能耗降低10-15%。隨著液冷技術的日益普及,在亞太地區的資料中心冷卻市場,精確的流量控制硬體將比大容量風扇更為重要。
其他好處:
- Excel格式的市場預測(ME)表
- 3個月的分析師支持
目錄
第1章:引言
- 研究假設和市場定義
- 調查範圍
第2章:調查方法
第3章執行摘要
第4章 市場狀況
- 市場概覽
- 市場促進因素
- 提高人工智慧/通用人工智慧的機架功率密度
- 美國和中國領先雲端公司超大規模部署
- 5G微區域的邊緣資料中心
- 公司為實現淨零排放和 RE100 所做的努力
- 模組化預製冷卻塊
- 區域供冷一體化試點計畫(新加坡模式)
- 市場限制因素
- 亞太地區主要城市的電力和土地成本不斷上漲
- 新興東南亞地區暖通空調認證技術人員短缺
- 印度和澳洲等易受乾旱影響的地區實施用水限制
- 環境許可核准過程漫長,當地社區反對
- 產業供應鏈分析
- 監理情勢
- 宏觀經濟因素對市場的影響
- 波特五力分析
- 新進入者的威脅
- 買方的議價能力
- 供應商的議價能力
- 替代品的威脅
- 競爭公司之間的競爭
第5章:亞太地區資料中心目前規模分析
- 資料中心 IT 負載容量(兆瓦)和面積(平方英尺)分析(2019-2031 年)
- 亞太地區主要資料中心集群分析
- 亞太地區未來重點超大規模設施的分析。
第6章 市場規模與成長預測
- 按類型分類的冷卻技術
- 空冷式
- CRAH
- 冷卻器和節熱器
- 冷卻塔(直冷式、間接式、兩級式)
- 其他
- 液冷
- 浸沒式冷卻
- 直接冷卻至尖端
- 後門熱交換器
- 空冷式
- 透過冷卻部件
- 電腦房空調機組(CRAH/CRAC)
- 冷卻器和熱交換器
- 冷卻塔和乾式冷卻器
- 泵浦和閥門
- 控制和監控軟體
- 層級類型
- 一級和二級
- 三級
- 第四級
- 按資料中心規模
- 小規模資料中心
- 中型資料中心
- 大型資料中心
- 超大規模資料中心
- 依資料中心類型
- 託管資料中心
- 超大規模資料中心業者資料中心/雲端服務供應商
- 企業和邊緣資料中心
- 國家
- 中國
- 日本
- 印度
- 韓國
- 澳洲和紐西蘭
- 亞太其他地區
第7章 競爭情勢
- 市佔率分析
- 公司簡介
- Vertiv Group Corp.
- Schneider Electric SE
- STULZ GmbH
- Huawei Digital Power Technologies Co., Ltd.
- Johnson Controls International plc
- Rittal GmbH & Co. KG
- Daikin Applied(Daikin Industries, Ltd.)
- Fujitsu General Limited
- Mitsubishi Electric Corporation
- Hitachi Cooling and Heating(Johnson Controls-Hitachi Air Conditioning)
- Baltimore Aircoil Company
- Nortek Air Solutions LLC
- Delta Electronics, Inc.
- Grundfos Holding A/S
- CoolIT Systems, Inc.
- Submer Technologies, SL
- Iceotope Technologies Ltd.
- Alfa Laval AB
- Trane Technologies plc
- NTT Facilities, Inc.
- Xylem Inc.
- Refrion Srl
- Green Revolution Cooling, Inc.
- Munters AB
第8章 市場機會與未來展望
- 評估未開發的領域和未滿足的需求
The Asia-Pacific data center cooling market size is expected to increase from USD 3.56 billion in 2025 to USD 4.09 billion in 2026 and reach USD 8.26 billion by 2031, growing at a CAGR of 15.09% over 2026-2031.
Accelerating adoption of generative-AI servers, mandatory efficiency codes such as China's PUE <= 1.3 rule and Singapore's SS 715:2025 standard, and hyperscale build-outs by Microsoft, Google, Alibaba, and Tencent are expanding demand for high-performance thermal systems. Liquid architectures are gaining traction because air-based cooling reaches economic and technical limits above 30 kW per rack, yet air solutions still dominate legacy estates and sub-30 kW deployments. Vendors that combine hardware, software, and rapid prefabrication are winning contracts as operators compress build schedules from 18 months to six. Supply-chain risk is easing after 2024 steel and semiconductor shortages, but HVAC-skilled labor gaps in Southeast Asia remain a near-term bottleneck.
Asia-Pacific Data Center Cooling Market Trends and Insights
AI/Gen-AI Rack Power Densification Drives Liquid Pivot
Generative-AI clusters are lifting rack densities from 8-12 kW toward 40-60 kW, where air systems lose both cost and thermal headroom. Lenovo's Neptune direct-to-chip platform installed at NTT's Tokyo campus in 2025 saved 40% energy while supporting 50 kW racks, and China's 2024 code now obliges liquid cooling above 8 kW per cabinet. Singapore's updated SS 715 demands PUE < 1.2 for high-density halls.At densities beyond 30 kW, immersion designs eliminate chillers and cut total cost of ownership by up to 30%, although uptake is moderated by OEM warranty terms and a shortage of technicians versed in dielectric-fluid safety. The Asia-Pacific data center cooling market is therefore shifting capital toward pumps, plates, and heat-exchanger modules that underpin liquid loops.
Hyperscale Build-Outs by Cloud Majors Anchor Demand
Microsoft's USD 17.5 billion India program and Google's USD 15 billion Andhra Pradesh campus each require 200-300 MW of IT load, absorbing 15-20% of regional chiller output through 2027. Oracle's multi-country region specified six-month delivery of modular mechanical blocks, accelerating orders for Vertiv and Schneider Electric. Chinese giants Alibaba and Tencent added 180 MW in 2025, drawn by land subsidies in Guangdong and Jiangsu that are conditional on 50% renewable sourcing. The hyperscale wave bifurcates the vendor field, rewarding suppliers with liquid IP and balance-sheet strength capable of vendor financing.
Rising Electricity and Land Costs Compress Margins
Singapore's tariff climbed to SGD 0.35/kWh in 2025 (USD 0.26/kWh) and the city's land scarcity allocates only 300 MW of extra IT load through 2030, inflating plots above SGD 1,000 ft2 (USD 695 ft2). Tokyo inner districts exceed USD 15,000 m2, triggering capacity shifts to Osaka despite latency penalties. Similar pressures in Sydney and Hong Kong redirect builds toward outer suburbs or Guangdong, but grid and fiber gaps undermine quick scaling. Because air cooling can represent 40% of a facility's power bill versus 15% for liquid, cost inflation is nudging incumbents to retrofit direct-to-chip loops even on brownfield assets.
Other drivers and restraints analyzed in the detailed report include:
- Edge Data Centers at 5G Micro-Regions Need Compact Cooling
- Corporate Net-Zero and RE100 Pledges Elevate Efficiency
- Water-Use Restrictions Squeeze Evaporative Architectures
For complete list of drivers and restraints, kindly check the Table Of Contents.
Segment Analysis
Air-based systems delivered 59.96% revenue in 2025, supported by entrenched operational know-how and a vast installed base. Yet the Asia-Pacific data center cooling market size for liquid architectures is forecast to expand at a 16.13% CAGR as generative-AI racks exceed 40 kW, a density where rear-door exchangers and immersion tanks outrun fan-driven CRAC units. Immersion deployments at Keppel Data Centres achieved PUE 1.03 and removed chillers entirely, proving a 25% capex and 40% opex cut over air baselines. Direct-to-chip loops from CoolIT allowed 50 kW retrofits in Japanese and Australian halls, adding seven years to asset life.
Despite liquid's momentum, air cooling preserves tactical advantages below 30 kW, in climates with extended free-cooling windows, and in markets short on dielectric-fluid skills such as Indonesia and Vietnam. Daikin's magnetic-bearing chillers reached 0.45 kW per ton in Tokyo, sustaining air's relevance where water limits prohibit towers. The Asia-Pacific data center cooling market continues to reward hybrid estates that blend fan coils for low-density rows with pumped liquid loops for AI zones, easing migration paths for cautious operators.
Computer-room air handlers maintained 41.55% share in 2025, but demand is tilting toward pumps, valves, and plate heat exchangers that orchestrate liquid loops. Grundfos and Xylem introduced variable-speed pumps tailored to 35-60 °C water, securing Microsoft and Google contracts in India. Alfa Laval's Compabloc plates hit 95% heat-transfer efficiency inside immersion shells, driving multi-megawatt orders from Singapore and Tokyo.
Chillers bifurcate between high-efficiency magnetic-bearing units for air halls and compact skid exchangers for liquid districts. Monitoring software now grows fastest at roughly 17% CAGR, with Schneider Electric EcoStruxure IT and Vertiv Trellis trimming energy 10-15% via machine-learning set-point control. As liquid penetration deepens, the Asia-Pacific data center cooling market will progressively prize precision flow hardware over bulk air movers.
The Asia Pacific Data Center Cooling Market Report is Segmented by Cooling Technology (Air-Based, and Liquid-Based), Cooling Component (CRAH/CRAC, Chillers and Heat Exchangers, Cooling Towers and Dry Coolers, and More), Tier Type (Tier 1 and 2, and Tier 4), Data Center Size (Small, Medium, Large, and Hyperscale), Data Center Type (Colocation, and More), and Country. The Market Forecasts are Provided in Terms of Value (USD).
List of Companies Covered in this Report:
- Vertiv Group Corp.
- Schneider Electric SE
- STULZ GmbH
- Huawei Digital Power Technologies Co., Ltd.
- Johnson Controls International plc
- Rittal GmbH & Co. KG
- Daikin Applied (Daikin Industries, Ltd.)
- Fujitsu General Limited
- Mitsubishi Electric Corporation
- Hitachi Cooling and Heating (Johnson Controls-Hitachi Air Conditioning)
- Baltimore Aircoil Company
- Nortek Air Solutions LLC
- Delta Electronics, Inc.
- Grundfos Holding A/S
- CoolIT Systems, Inc.
- Submer Technologies, S.L.
- Iceotope Technologies Ltd.
- Alfa Laval AB
- Trane Technologies plc
- NTT Facilities, Inc.
- Xylem Inc.
- Refrion S.r.l.
- Green Revolution Cooling, Inc.
- Munters AB
Additional Benefits:
- The market estimate (ME) sheet in Excel format
- 3 months of analyst support
TABLE OF CONTENTS
1 INTRODUCTION
- 1.1 Study Assumptions and Market Definition
- 1.2 Scope of the Study
2 RESEARCH METHODOLOGY
3 EXECUTIVE SUMMARY
4 MARKET LANDSCAPE
- 4.1 Market Overview
- 4.2 Market Drivers
- 4.2.1 AI/Gen-AI Rack Power Densification
- 4.2.2 Hyperscale Build-Outs by US and Chinese Cloud Majors
- 4.2.3 Edge Data Centers at 5G Micro-Regions
- 4.2.4 Corporate Net-Zero and RE100 Pledges
- 4.2.5 Modular Prefabricated Cooling Blocks
- 4.2.6 District-Cooling Integration Pilots (Singapore-Style)
- 4.3 Market Restraints
- 4.3.1 Rising Electricity and Land Costs in Tier-1 APAC Cities
- 4.3.2 Scarcity of HVAC-Certified Labor in Emerging Southeast Asia
- 4.3.3 Water-Use Restrictions in Drought-Prone India and Australia
- 4.3.4 Lengthy Environmental Permitting and Community Pushback
- 4.4 Industry Supply-Chain Analysis
- 4.5 Regulatory Landscape
- 4.6 Impact of Macroeconomic Factors on the Market
- 4.7 Porter's Five Forces Analysis
- 4.7.1 Threat of New Entrants
- 4.7.2 Bargaining Power of Buyers
- 4.7.3 Bargaining Power of Suppliers
- 4.7.4 Threat of Substitute Products
- 4.7.5 Intensity of Competitive Rivalry
5 ANALYSIS OF THE CURRENT DATA CENTER FOOTPRINT IN ASIA-PACIFIC
- 5.1 Analysis of IT Load Capacity (MW) and Area footprint (Sq. Ft.) of Data Centers (for the Period of 2019-2031)
- 5.2 Analysis of Major Data Center Hotspots in Asia-Pacific
- 5.3 Analysis of Major Upcoming Hyperscale Facilities in Asia-Pacific
6 MARKET SIZE AND GROWTH FORECASTS (VALUE)
- 6.1 By Cooling Technology
- 6.1.1 Air-Based Cooling
- 6.1.1.1 CRAH
- 6.1.1.2 Chiller and Economizer
- 6.1.1.3 Cooling Tower (Direct, Indirect, Two-Stage)
- 6.1.1.4 Others
- 6.1.2 Liquid-Based Cooling
- 6.1.2.1 Immersion Cooling
- 6.1.2.2 Direct-to-Chip Cooling
- 6.1.2.3 Rear-Door Heat Exchanger
- 6.1.1 Air-Based Cooling
- 6.2 By Cooling Component
- 6.2.1 Computer-Room Air Handlers (CRAH/CRAC)
- 6.2.2 Chillers and Heat-Exchanger Units
- 6.2.3 Cooling Towers and Dry Coolers
- 6.2.4 Pumps and Valves
- 6.2.5 Control and Monitoring Software
- 6.3 By Tier Type
- 6.3.1 Tier 1 and 2
- 6.3.2 Tier 3
- 6.3.3 Tier 4
- 6.4 By Data Center Size
- 6.4.1 Small Data Center
- 6.4.2 Medium Data Center
- 6.4.3 Large Data Center
- 6.4.4 Hyperscale Data Center
- 6.5 By Data Center Type
- 6.5.1 Colocation Data Center
- 6.5.2 Hyperscalers Data Center/CSPs
- 6.5.3 Enterprise and Edge Data Center
- 6.6 By Country
- 6.6.1 China
- 6.6.2 Japan
- 6.6.3 India
- 6.6.4 South-Korea
- 6.6.5 Australia and New Zealand
- 6.6.6 Rest of Asia-Pacific
7 COMPETITIVE LANDSCAPE
- 7.1 Market Share Analysis
- 7.2 Company Profiles (Includes Global Level Overview, Market Level Overview, Core Segments, Financials as Available, Strategic Information, Market Rank/Share, Products and Services, and Recent Developments)
- 7.2.1 Vertiv Group Corp.
- 7.2.2 Schneider Electric SE
- 7.2.3 STULZ GmbH
- 7.2.4 Huawei Digital Power Technologies Co., Ltd.
- 7.2.5 Johnson Controls International plc
- 7.2.6 Rittal GmbH & Co. KG
- 7.2.7 Daikin Applied (Daikin Industries, Ltd.)
- 7.2.8 Fujitsu General Limited
- 7.2.9 Mitsubishi Electric Corporation
- 7.2.10 Hitachi Cooling and Heating (Johnson Controls-Hitachi Air Conditioning)
- 7.2.11 Baltimore Aircoil Company
- 7.2.12 Nortek Air Solutions LLC
- 7.2.13 Delta Electronics, Inc.
- 7.2.14 Grundfos Holding A/S
- 7.2.15 CoolIT Systems, Inc.
- 7.2.16 Submer Technologies, S.L.
- 7.2.17 Iceotope Technologies Ltd.
- 7.2.18 Alfa Laval AB
- 7.2.19 Trane Technologies plc
- 7.2.20 NTT Facilities, Inc.
- 7.2.21 Xylem Inc.
- 7.2.22 Refrion S.r.l.
- 7.2.23 Green Revolution Cooling, Inc.
- 7.2.24 Munters AB
8 MARKET OPPORTUNITIES AND FUTURE OUTLOOK
- 8.1 White-Space and Unmet-Need Assessment

 全球資料中心晶片直接冷卻市場(至2032年):按類型、冷卻劑類型、最終用戶和地區分類
 資料中心冷媒的市場機會、成長要素、產業趨勢與預測(2026-2035 年)。資料中心冷卻器市場商機、成長要素、產業趨勢分析及2026-2035年預測。
 資料中心冷卻市場:2026-2032年全球市場預測(以交付方式、系統整合、冷卻方式、額定功率、資料中心類型、最終用戶和部署模式分類)
 全球資料中心冷卻系統市場規模、佔有率、趨勢和成長分析報告(2026-2034年)
 2026年航太港資料中心冷卻全球市場報告
 全球資料中心管道市場:按管道類型、管道材質、應用、資料中心類型和地區分類-預測至2032年英洛冷凍市場:依產品類型、冷凍方式、安裝方式、冷氣量和最終用戶分類-2026-2032年全球預測
 北美資料中心冷卻:市場佔有率分析、產業趨勢與統計及成長預測(2026-2031 年)
 資料中心冷卻市場分析及預測(至2035年):按類型、產品、服務、技術、組件、應用、部署、最終用戶、設備及解決方案分類