


 |
市場調查報告書
商品編碼
1940798
東南亞數位戶外(DOOH):市場佔有率分析、產業趨勢與統計、成長預測(2026-2031)South East Asia Digital Out-of-Home (DooH) - Market Share Analysis, Industry Trends & Statistics, Growth Forecasts (2026 - 2031) |
||||||
※ 本網頁內容可能與最新版本有所差異。詳細情況請與我們聯繫。
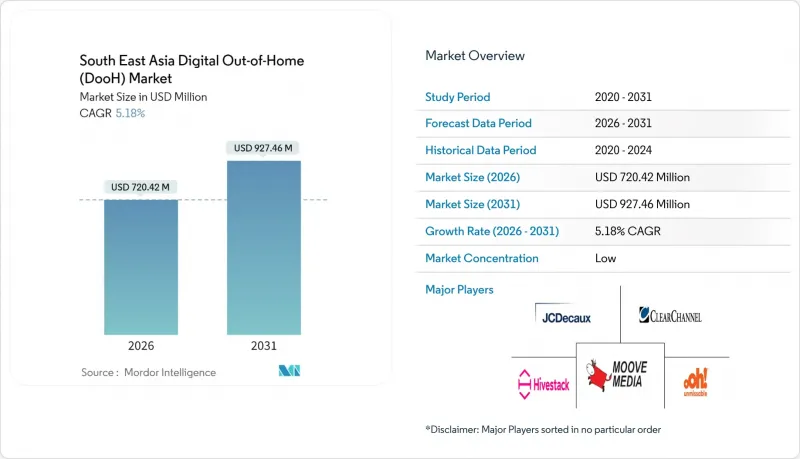
預計東南亞數位戶外(DOOH) 市場將從 2025 年的 6.8493 億美元成長到 2026 年的 7.2042 億美元,到 2031 年將達到 9.2746 億美元,2026 年至 2031 年的複合年成長率為 5.18%。
這一成長反映了隨著快速都市化、政府智慧城市預算和超級應用廣告生態系統在全部區域的融合,廣告形式正從靜態展示廣告穩步轉向數據驅動的程序化廣告。公共交通走廊沿線通勤客流量的增加,加上購物中心數位化計劃和零售媒體網路的推廣,正在擴大優質螢幕的覆蓋範圍,並推動單一螢幕平均收入的成長。品牌方看重這種廣告形式的高可見度和與購買路徑的相關性,廣告代理商也擴大將第一方資料疊加到動態創新中,以提高宣傳活動的有效性。競爭優勢將取決於能否獲得黃金地段、LED供應鏈的效率,以及營運商部署滿足即時最佳化需求的程式化廣告管道的速度。
東南亞數位戶外(DOOH)市場趨勢與洞察
快速的都市化和交通樞紐遊客數量的激增
人口持續從農村向大都會圈遷移,導致公共交通客流量和停留時間不斷增加,創造了大量高價值的螢幕廣告空間。泰國計劃在2030年前投資1,800億泰銖(約51億美元)用於105個城市的數位化改造,以實現交通樞紐的數位化。印尼的努桑塔拉計畫也包括為其新首都建造智慧基礎設施。馬來西亞檳城島計劃在2027年前投資23億馬幣(約5.06億美元)開發綜合導覽系統和收益分成廣告網路。通勤者平均每天花費42.9分鐘搭乘公共運輸工具,這為高額CPM(每千次展示成本)提供了支撐。新加坡地鐵和吉隆坡鐵路樞紐的數位廣告看板月租金已超過1.5萬美元,充分展現了其巨大的商業價值。
政府主導的智慧城市數位電子看板投資
國家數位化計畫將廣告支援的螢幕引入交通、醫療和市政設施,並向媒體業者提供長期特許經營合約。泰國數位經濟總體規劃強制要求在新國家設施中數位電子看板,以促進規模化和技術標準化。印尼320億美元的「努桑塔拉」計畫預算包含一個覆蓋全城的物聯網網路,重點是開放式和程式化介面。馬來西亞數位經濟藍圖的目標是到2030年數位產業對GDP的貢獻達到25.5%,並鼓勵地方政府實施廣告支援的基礎建設。明確的採購規則縮短了銷售週期,統一的技術規格降低了營運商和廣告商的整合成本。
高昂的資本投入和持續的維護成本
全動態LED顯示器需要大量的初始投資和持續的維護,這給依賴進口管道的小規模企業帶來了障礙。在新興市場,融資成本仍然很高,利率通常超過兩位數,投資回收期往往超過五年。此外,外匯波動也會推高以美元計價的組件成本。本地電力供應、冷卻和光纖連接等持續性支出會擠壓廣告價格較低的區域性城市的利潤空間。資金負擔限制了擴張速度,延緩了現代化改造週期,從而減少了庫存累積。
細分市場分析
到2025年,戶外廣告看板收入將佔總收入的34.78%,這印證了品牌對沿著主要公路(例如新加坡的烏節路和馬來西亞的聯邦大道)大尺寸廣告看板的持續青睞。隨著各國政府將LED廣告看板融入城市景觀,東南亞數位戶外(DOOH)市場的廣告看板規模預計將穩定擴大。然而,預計成長最快的將是3D變形廣告牌,其複合年成長率(CAGR)將達到6.12%,因為身臨其境型視覺效果能夠推動社交媒體的普及,並使高額的CPM(廣告曝光率成本)成為合理選擇。
由於智慧城市政策將導向功能與廣告空間結合,包括公車候車亭和路燈面板在內的街道設施正日益成為市政收入的穩定來源。儘管基於場所的媒體廣告目前仍佔比最小,但在機場、電影院和醫療機構等人們停留時間更長、受眾品質更高的場所,其需求正在成長。像Shining這樣的LED供應商正在開發用於公車的防震顯示器和支援GPS定位的定向技術,以推動基於路線的商業化。
到2025年,室內環境將佔據39.25%的市場佔有率,到2031年將達到5.68%的最高複合年成長率。購物中心業主正在改造液晶電視牆和電梯螢幕,以將客流量轉化為廣告收入,同時改善消費者的購物體驗。在新加坡樟宜機場,支援VIOOH(戶外影片廣告)的面板將航班數據與動態創新排播相結合,以投放與情境相關的訊息。
戶外螢幕透過路邊廣告看板和政府基礎設施預算資助的交通候車亭等設施,覆蓋範圍廣泛。整合的QR碼和NFC標籤將實體螢幕與行動商務連接起來,使品牌能夠即時衡量轉換率。透過將室內精準投放與戶外規模化投放相結合,營運商能夠更好地在東南亞數位戶外(DOOH)市場實現全通路行銷目標。
其他福利:
- Excel格式的市場預測(ME)表
- 3個月的分析師支持
目錄
第1章 引言
- 研究假設和市場定義
- 調查範圍
第2章調查方法
第3章執行摘要
第4章 市場情勢
- 市場概覽
- 市場促進因素
- 快速的都市化和交通樞紐人流量的快速成長
- 政府智慧城市投資數位電子看板
- 程序化數位戶外廣告購買平台的激增
- 全通路零售和不斷成長的消費者品牌廣告支出
- 利用3D變形標誌推廣優質庫存
- 超級應用零售媒體與戶外數位媒體整合
- 市場限制
- 高昂的資本投入和持續的維護成本
- 供應分散限制了統一測量。
- 國家/地區特定的亮度和內容限制
- 熟練的LED/IoT工程師短缺
- 宏觀經濟因素的影響
- 監管環境
- 技術展望
- 波特五力分析
- 供應商的議價能力
- 買方的議價能力
- 新進入者的威脅
- 替代品的威脅
- 競爭對手之間的競爭
- 產業生態系分析
第5章 市場規模與成長預測
- 按格式
- 廣告看板
- 街道家具
- 交通廣告
- 基於位置的媒體
- 透過使用
- 戶外數位戶外(DOOH)
- 室內數位戶外(DOOH)
- 按最終用戶行業分類
- 零售
- 車
- 娛樂與媒體
- 食品/飲料
- 溝通
- BFSI
- 其他終端用戶產業
- 透過技術
- 程式化數位戶外廣告
- 非程式化數位戶外廣告
- 按地區
- 新加坡
- 馬來西亞
- 泰國
- 印尼
- 菲律賓
- 越南
- 東南亞及其他地區
第6章 競爭情勢
- 市場集中度
- 策略趨勢
- 市佔率分析
- 公司簡介
- JCDecaux Singapore Pte Ltd
- Clear Channel Singapore Pte Ltd
- oOh!media Limited
- Hivestack Inc.
- Moove Media Pte Ltd
- SPHMBO Pte Ltd(Singapore Press Holdings)
- Vistar Media Inc.
- Talon Outdoor Ltd
- Mediatech Services Pte Ltd
- Daktronics Inc.
- Neosys Documail(S)Pte Ltd
- TAC Media Sdn Bhd
- Moving Walls Pte Ltd
- Pi Interactive Sdn Bhd
- Plan B Media Public Co Ltd
- VGI Public Co Ltd
- Big Tree Outdoor Sdn Bhd
- City Vision Outdoor Advertising PT
- Redberry Media Sdn Bhd
- SEAtronics Inc.
第7章 市場機會與未來展望
The South East Asia Digital Out-of-Home market is expected to grow from USD 684.93 million in 2025 to USD 720.42 million in 2026 and is forecast to reach USD 927.46 million by 2031 at 5.18% CAGR over 2026-2031.
This growth reflects the steady migration from static displays toward data-driven, programmatic inventory as rapid urbanization, government smart-city budgets, and super-app advertising ecosystems converge across the region. Rising commuter volumes in mass-transit corridors, coupled with shopping-mall digitization projects and retail-media network rollouts, are expanding premium screen locations and lifting average yields per panel. Brands value the format's high viewability and path-to-purchase relevance, and agencies increasingly layer first-party data onto dynamic creative to improve campaign lift. Competition hinges on access to grade-A locations, LED supply-chain efficiencies, and the speed at which each operator can deploy programmatic pipes that meet real-time optimization demands.
South East Asia Digital Out-of-Home (DooH) Market Trends and Insights
Rapid Urbanization and Transit-Hub Footfall Surge
Continued migration from rural areas to metropolitan corridors raises daily ridership on mass-transit systems, lifting dwell times and creating concentrated, high-value screen real estate. Thailand's 105-city initiative allocates THB 180 billion (USD 5.1 billion) through 2030 to digitize transport terminals, while Indonesia's Nusantara project earmarks smart infrastructure for its new capital. On Penang Island, Malaysia committed MYR 2.3 billion (USD 506 million) through 2027 for integrated way-finding and revenue-share ad networks. Commuters spend 42.9 minutes per day onboard public transport, a captive interval that supports premium CPMs. Singapore's MRT and Kuala Lumpur's rail hubs already price digital panels above USD 15,000 per month, validating the monetization upside.
Government Smart-City Investments in Digital Signage
National digitization plans embed advertising-ready screens into transport, healthcare, and municipal facilities, providing long-term concession contracts for media owners. Thailand's Digital Economy masterplan mandates digital signage in new state buildings, encouraging scale and technical standardization. Indonesia's USD 32 billion Nusantara budget includes city-wide IoT networks that favor open, programmatic interfaces. Malaysia's Digital Economy Blueprint targets a 25.5% GDP contribution from digital sectors by 2030, pushing local councils to adopt ad-funded infrastructure. Clear procurement rules shorten selling cycles, while uniform technical specs reduce integration costs for operators and advertisers.
High Capex and Ongoing Maintenance Costs
Full-motion LED billboards require substantial upfront spend and continual servicing, a hurdle for small operators that rely on syndicated import channels. Financing terms remain expensive in emerging markets where interest rates exceed double digits, stretching payback periods beyond five years. In addition, fluctuating foreign-exchange rates inflate component costs indexed in USD. On-site power, cooling, and fiber connectivity add recurring overhead, squeezing margins in secondary cities where ad rates are lower. The capital burden limits fleet expansion and slows modernization cycles, curbing inventory growth.
Other drivers and restraints analyzed in the detailed report include:
- Explosion of Programmatic DOOH Buying Platforms
- Omnichannel Retail and Consumer-Brand Ad-Spend Uptick
- Fragmented Supply Limiting Unified Measurement
For complete list of drivers and restraints, kindly check the Table Of Contents.
Segment Analysis
Billboards accounted for 34.78% of 2025 revenue, underscoring enduring brand preference for large-format reach along arterial roads such as Singapore's Orchard Road and Malaysia's Federal Highway. The South East Asia Digital Out-of-Home market size for billboard formats is forecast to expand at a steady clip as governments integrate LED structures into urban streetscapes. Yet the fastest acceleration comes from 3D anamorphic sites, projected at a 6.12% CAGR, because immersive visuals drive social-media amplification and justify premium CPMs.
Street furniture, including bus shelters and lamp-post panels, gains from smart-city mandates that bundle way-finding with ad inventory, providing predictable municipal revenue. Place-based media remains the smallest slice but sees rising demand in airports, cinemas, and healthcare facilities where dwell times boost audience quality. LED suppliers like Shining develop anti-vibration bus displays and GPS-enabled targeting to advance route-based monetization.
Indoor environments captured 39.25% share in 2025, and this slice registers the highest 5.68% CAGR through 2031. Shopping-mall owners retrofit LCD videowalls and elevator screens to convert footfall into advertising revenue while enhancing shopper navigation. At Singapore's Changi Airport, VIOOH-enabled panels marry flight data with dynamic creative scheduling, delivering contextually relevant messaging.
Outdoor screens retain broad reach via roadside billboards and transit shelters funded by government infrastructure budgets. Integrated QR codes and NFC tags bridge physical screens to mobile commerce, letting brands measure conversions in real time. The blend of indoor precision and outdoor scale positions operators to serve full-funnel marketing objectives across the South East Asia Digital Out-of-Home market.
The South East Asia Digital Out-Of-Home Market Report is Segmented by Format (Billboards, Street Furniture, Transit, and Place-Based Media), Application (Outdoor DOOH, and Indoor DOOH), End-User Industry (Retail, Automotive, Entertainment and Media, Food and Beverages, Telecom, BFSI, and More), Technology (Programmatic DOOH, and Non-Programmatic DOOH), and Geography. The Market Forecasts are Provided in Terms of Value (USD).
List of Companies Covered in this Report:
- JCDecaux Singapore Pte Ltd
- Clear Channel Singapore Pte Ltd
- oOh!media Limited
- Hivestack Inc.
- Moove Media Pte Ltd
- SPHMBO Pte Ltd (Singapore Press Holdings)
- Vistar Media Inc.
- Talon Outdoor Ltd
- Mediatech Services Pte Ltd
- Daktronics Inc.
- Neosys Documail (S) Pte Ltd
- TAC Media Sdn Bhd
- Moving Walls Pte Ltd
- Pi Interactive Sdn Bhd
- Plan B Media Public Co Ltd
- VGI Public Co Ltd
- Big Tree Outdoor Sdn Bhd
- City Vision Outdoor Advertising PT
- Redberry Media Sdn Bhd
- SEAtronics Inc.
Additional Benefits:
- The market estimate (ME) sheet in Excel format
- 3 months of analyst support
TABLE OF CONTENTS
1 INTRODUCTION
- 1.1 Study Assumptions and Market Definition
- 1.2 Scope of the Study
2 RESEARCH METHODOLOGY
3 EXECUTIVE SUMMARY
4 MARKET LANDSCAPE
- 4.1 Market Overview
- 4.2 Market Drivers
- 4.2.1 Rapid urbanisation and transit-hub footfall surge
- 4.2.2 Government smart-city investments in digital signage
- 4.2.3 Explosion of programmatic DOOH buying platforms
- 4.2.4 Omnichannel retail and consumer-brand ad spend uptick
- 4.2.5 3D anamorphic billboards driving premium inventory
- 4.2.6 Super-app retail-media integration with DOOH
- 4.3 Market Restraints
- 4.3.1 High capex and ongoing maintenance costs
- 4.3.2 Fragmented supply limiting unified measurement
- 4.3.3 Country-specific brightness and content limits
- 4.3.4 Shortage of skilled LED/IoT technicians
- 4.4 Impact of Macroeconomic Factors
- 4.5 Regulatory Landscape
- 4.6 Technological Outlook
- 4.7 Porter's Five Forces Analysis
- 4.7.1 Bargaining Power of Suppliers
- 4.7.2 Bargaining Power of Buyers
- 4.7.3 Threat of New Entrants
- 4.7.4 Threat of Substitutes
- 4.7.5 Intensity of Competitive Rivalry
- 4.8 Industry Ecosystem Analysis
5 MARKET SIZE AND GROWTH FORECASTS (VALUE)
- 5.1 By Format
- 5.1.1 Billboards
- 5.1.2 Street Furniture
- 5.1.3 Transit
- 5.1.4 Place-Based Media
- 5.2 By Application
- 5.2.1 Outdoor DOOH
- 5.2.2 Indoor DOOH
- 5.3 By End-User Industry
- 5.3.1 Retail
- 5.3.2 Automotive
- 5.3.3 Entertainment and Media
- 5.3.4 Food and Beverages
- 5.3.5 Telecom
- 5.3.6 BFSI
- 5.3.7 Other End-User Industries
- 5.4 By Technology
- 5.4.1 Programmatic DOOH
- 5.4.2 Non-programmatic DOOH
- 5.5 By Geography
- 5.5.1 Singapore
- 5.5.2 Malaysia
- 5.5.3 Thailand
- 5.5.4 Indonesia
- 5.5.5 Philippines
- 5.5.6 Vietnam
- 5.5.7 Rest of South-East Asia
6 COMPETITIVE LANDSCAPE
- 6.1 Market Concentration
- 6.2 Strategic Moves
- 6.3 Market Share Analysis
- 6.4 Company Profiles (includes Global level overview, Market level overview, Core segments, Financials as available, Strategic information, Market rank/share, Products and Services, Recent developments)
- 6.4.1 JCDecaux Singapore Pte Ltd
- 6.4.2 Clear Channel Singapore Pte Ltd
- 6.4.3 oOh!media Limited
- 6.4.4 Hivestack Inc.
- 6.4.5 Moove Media Pte Ltd
- 6.4.6 SPHMBO Pte Ltd (Singapore Press Holdings)
- 6.4.7 Vistar Media Inc.
- 6.4.8 Talon Outdoor Ltd
- 6.4.9 Mediatech Services Pte Ltd
- 6.4.10 Daktronics Inc.
- 6.4.11 Neosys Documail (S) Pte Ltd
- 6.4.12 TAC Media Sdn Bhd
- 6.4.13 Moving Walls Pte Ltd
- 6.4.14 Pi Interactive Sdn Bhd
- 6.4.15 Plan B Media Public Co Ltd
- 6.4.16 VGI Public Co Ltd
- 6.4.17 Big Tree Outdoor Sdn Bhd
- 6.4.18 City Vision Outdoor Advertising PT
- 6.4.19 Redberry Media Sdn Bhd
- 6.4.20 SEAtronics Inc.
7 MARKET OPPORTUNITIES AND FUTURE OUTLOOK
- 7.1 White-space and unmet-need assessment
 2026年全球程序化戶外廣告平台市場報告
 數位戶外廣告市場:按形式、終端用戶產業、技術、互動性和應用程式分類-全球預測,2026-2032年2026年全球戶外數位廣告市場報告
 數位戶外廣告市場報告:按形式、應用程式、最終用戶和地區分類(2026-2034 年)
 亞太地區數位戶外(DOOH):市場佔有率分析、產業趨勢與統計、成長預測(2026-2031)
 全球數位戶外廣告市場規模、佔有率、趨勢和成長分析報告(2026-2034年)日本戶外廣告和數位戶外廣告:市場佔有率分析、行業趨勢和統計數據以及成長預測(2026-2031 年)全球數位戶外廣告市場:市場規模、佔有率、成長率、產業分析、依類型、應用和地區劃分的分析及預測(2026-2034 年)戶外媒體廣告市場按媒體類型、形式、所有權、應用程式和最終用戶產業分類,全球預測(2026-2032年)中東和非洲數位戶外廣告 (DOOH) - 市場佔有率分析、行業趨勢、統計數據和成長預測 (2026-2031)