


 |
市場調查報告書
商品編碼
1937263
電信服務保障:市佔率分析、產業趨勢與統計、成長預測(2026-2031)Telecom Service Assurance - Market Share Analysis, Industry Trends & Statistics, Growth Forecasts (2026 - 2031) |
||||||
※ 本網頁內容可能與最新版本有所差異。詳細情況請與我們聯繫。
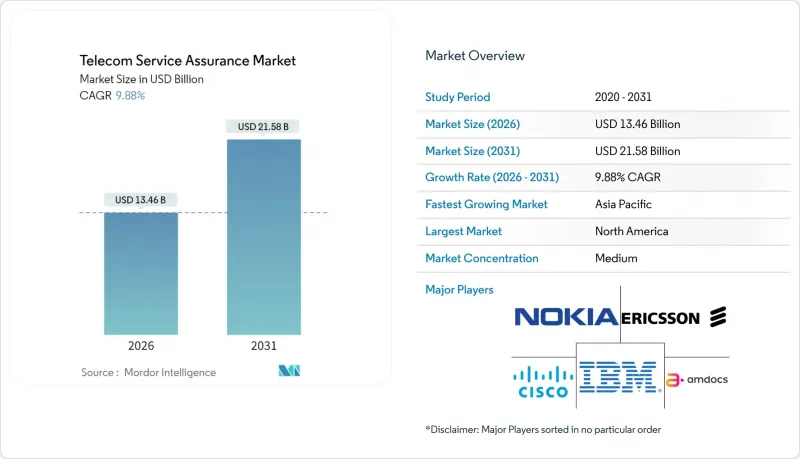
2025 年電信服務保障市場價值為 122.5 億美元,預計到 2031 年將達到 215.8 億美元,高於 2026 年的 134.6 億美元。
預計在預測期(2026-2031 年)內,複合年成長率將達到 9.88%。
隨著通訊業者從被動式網路管理模式向主動式網路管理模式轉型,日益成長的效能監控需求、5G獨立組網部署以及以人工智慧為中心的零接觸運維正在推動近期支出成長。私有網路和物聯網垂直產業用例正在擴大目標市場,而與超大規模資料中心業者的合作則促使保障架構向雲端原生和開放API設計轉型。市場競爭強度仍適中,大型跨國企業正透過收購整合相關能力,以增強其端到端產品組合。預計到2025年,北美仍將主導市場,而亞太地區快速的5G部署和企業數位化將推動該地區實現最快成長。從STIR/SHAKEN到歐盟人工智慧法規,日益嚴格的合規要求進一步鞏固了通訊服務保障市場作為關鍵任務支出類別的地位。
全球電信服務保障市場趨勢與洞察
引入以人工智慧為中心的零接觸操作
從2024年到2025年,通訊業者為實現TM Forum 4-5級自主性目標,以降低營運成本並提升服務質量,大力推動自動化舉措,重塑網路營運模式。愛立信和AWS共同開發的智慧代理AI展示了基於意圖的編配如何減少人工干預並提升客戶滿意度。 TM Forum的經濟模型預測,人工智慧驅動的封閉回路型控制在其成熟階段將為一級營運商平均每年節省8億美元的成本。到2024年底,全球87%的通訊業者已實施至少一項人工智慧應用案例,其中一半營運商表示「資料收集分散」是其面臨的最大障礙,這推動了對統一保障資料湖的需求。監管機構也發揮了推動作用。歐盟人工智慧立法強制要求採用透明且審核的模型,並加強了包含可解釋性的保障平台的採購標準。這些因素共同推動了原生人工智慧保障模組的支出增加,並加速了通訊服務保障市場的成長。
5G SA部署需要即時SLA可見性
到 2024 年,北美、歐洲和亞太主要市場運作商用 5G 獨立組網 (SA),這將帶來前所未有的彈性需求。 NETSCOUT 發布了其虛擬分流技術,能夠收集 100Gbps 的流量流,並在雲端化核心網路中進行微秒分析。 Spirent 的主動保障探針產生合成流量,在影響客戶之前檢驗切片效能,從而改變了傳統的被動式營運模式。服務供應商優先考慮切片感知分析,將傳輸、核心網和無線接取網路 (RAN) 指標整合到統一的儀錶板中——這是傳統 OSS/BSS 解決方案所缺乏的。標準化組織 TM Forum 和 3GPP 最終確定了切片特定的 KPI,促使供應商將其原生整合到自身產品中。企業對服務等級協定 (SLA) 的期望不斷提高,尤其是在機器人和擴增實境 (AR) 領域,這進一步將即時保障從可選功能提升為合約要求。
一級行動網路營運商資本支出凍結(2024-2025 年)
由於預計5G無線設備建設將在2024年達到峰值,且宏觀經濟的不確定性導致通訊業者資本支出大幅收縮,Dell'Oro的研究預測,整個產業的資本支出將同比下降8%,並在2027年之前保持2%的複合年成長率。一家美國大型通訊業者已將上年度的預算削減了約50%,並推遲了非必要的軟體升級。保障供應商面臨更長的銷售週期和更嚴格的投資回報率審查,但他們利用預測性維護和能源最佳化等成本投資收益優勢,成功留在了採購候選名單上。分析師預測,隨著5G接取網路計畫的成熟,預算將在2025年底前逐步恢復,保障支出預計將隨著無線接取網路(RAN)的重道密集化而同步復甦。
細分市場分析
2025年,效能監控和分析業務將佔總收入的34.78%,為大型網路現代化專案提供支援。該業務的高佔有率反映了對無線、傳輸和核心網即時可見性的迫切需求。思科的AI增強型遙測流就是一個很好的例子,它展示了營運商如何從基於閾值的警告轉向預測分析,從而主動預防網路擁塞。隨著支援網路切片的指標不斷擴展,與效能監控相關的通訊服務保障市場規模預計將保持穩健的中等個位數複合年成長率。
自動化根本原因識別和修復已成為一個高成長的細分市場,預計到2031年將以11.02%的複合年成長率成長,這主要得益於電信管理論壇(TM Forum)提出的4級自主目標。通訊業者正在尋求封閉回路型回饋,以便在幾秒鐘內自我修復劣化的網路切片,從而將平均修復時間(MTTR)縮短高達60%。供應商正在將機器學習策略引擎與產品捆綁銷售,這些引擎可以關聯數十億個事件並提案修復腳本,從而減少故障排除人員的工作量。到2025年,已有超過30家全球通訊業者發布了根本原因人工智慧模組的招標書,顯示該技術正從試點階段走向主流應用。
截至2025年,本地部署平台仍維持50.62%的市場佔有率,反映出通訊業者希望嚴格管理敏感的核心數據。然而,在容器化和CI/CD管線普及的推動下,電信服務保障市場的雲端原生解決方案年增率達12.08%。 Red 紅帽公司基於Kubernetes的開放原始碼參考堆疊透過彈性擴充和託管服務展現了成本優勢。同時,Infovista的KLERITY以SaaS模式為企業客戶提供廠商無關的保障和多租戶功能。
混合模式正逐漸成為標準架構,它將大規模資料包代理和合法攔截工作負載保留在本地,同時將人工智慧訓練和長期分析遷移到公共雲端。這種雙架構使企業能夠在遵守資料主權要求的同時,利用超大規模資料中心業者的GPU進行模型訓練。預計2031年,採用混合架構的電信服務保障市場規模將達到102.9億美元,複合年成長率與整體市場保持一致。
區域分析
北美地區預計到2025年將維持31.88%的市場佔有率,這主要得益於STIR/SHAKEN合規的最後期限以及獨立核心網路技術的早期商業化。 AT&T和Verizon等業者已試行實施了4級能源最佳化用例,可將基地台電力消耗降低5%。與AWS和谷歌雲端的整合正在加速該地區向規範化保障的過渡。預計到2031年,北美相關通訊服務保障市場規模將達到71.8億美元,維持個位數的溫和成長,主要得益於私有5G舉措的擴展。
亞太地區已成為關鍵成長引擎,預計到2031年將實現12.12%的複合年成長率,這主要得益於印度、泰國和澳洲全國範圍內的5G網路覆蓋範圍。惠譽評等觀察到亞太地區許多通訊業者的信用指標保持穩定,因此能夠持續投資於保障現代化。企業級5G和主要製造地區的大規模物聯網部署推動了對基於網路切片和以設備為中心的監控的需求,使得平均合約規模比LTE時代加倍。
在歐洲,如何平衡GDPR合規負擔和即將訂定的歐盟人工智慧立法,同時實現開放式無線接取網路(RAN)多元化,仍然是一個巨大的機會。通訊業者尋求能夠整合多個無線接取網/分散式單元(RU/DU)供應商的廠商中立控制面板,這提升了分散式保障方案的吸引力。在中東和非洲地區,Comarch的多域OSS部署與政府的數位經濟計畫相契合,推動了市場成長。拉丁美洲正處於5G普及的關鍵時刻,GSMA預測2030年5G滲透率將達到60%。這項轉型需要基於雲端的保障解決方案來彌補有限的資本支出預算。
其他福利:
- Excel格式的市場預測(ME)表
- 3個月的分析師支持
目錄
第1章 引言
- 研究假設和市場定義
- 調查範圍
第2章調查方法
第3章執行摘要
第4章 市場情勢
- 市場概覽
- 市場促進因素
- 面對面商務旅行預算迅速恢復
- 企業永續性政策轉向碳中和活動
- 利用技術,透過混合模式擴大參與者群體。
- 新興經濟體的目的地行銷獎勵
- Z世代/千禧世代員工對體驗式設計的需求
- 海灣和東協市場的大規模基礎設施開發
- 市場限制
- 機票和住宿費用波動;
- 地緣政治不確定性與簽證限制
- 混合活動中的資料隱私和網路安全成本
- 加強對活動相關碳足跡的ESG審查
- 產業價值鏈分析
- 監管環境
- 技術展望
- 波特五力分析
- 新進入者的威脅
- 買方的議價能力
- 供應商的議價能力
- 替代品的威脅
- 競爭對手之間的競爭
第5章 市場規模與成長預測
- 按事件類型
- 會議
- 獎勵
- 會議
- 展覽
- 混合/虛擬活動
- 按服務類型
- 活動企劃與管理
- 場地租賃
- 運輸/物流
- 住宿設施
- 食品和餐飲
- 視聽和技術服務
- 其他服務類型
- 依場地類型
- 會議中心
- 飯店和度假村
- 戶外/非傳統場地
- 公司自有設施
- 按行業
- 資訊科技/通訊
- 醫療和藥品
- 銀行、金融服務和保險(BFSI)
- 汽車/製造業
- 飯店和旅遊業
- 政府/公共部門
- 其他行業
- 按地區
- 北美洲
- 美國
- 加拿大
- 墨西哥
- 南美洲
- 巴西
- 阿根廷
- 南美洲其他地區
- 歐洲
- 德國
- 英國
- 法國
- 義大利
- 西班牙
- 俄羅斯
- 其他歐洲
- 亞太地區
- 中國
- 日本
- 印度
- 韓國
- 澳洲
- 亞太其他地區
- 中東和非洲
- 中東
- 阿拉伯聯合大公國
- 沙烏地阿拉伯
- 土耳其
- 其他中東地區
- 非洲
- 南非
- 奈及利亞
- 肯亞
- 其他非洲地區
- 中東
- 北美洲
第6章 競爭情勢
- 市場集中度
- 策略趨勢
- 市佔率分析
- 公司簡介
- ASM Global
- Informa PLC
- Messe Frankfurt GmbH
- Reed Exhibitions(RX Global)
- Maritz Global Events Inc.
- MCI Group
- Cvent Holding Corp.
- GL Events SA
- Comexposium
- Fiera Milano SpA
- Koelnmesse GmbH
- Tarsus Group
- SMG(merged into ASM Global)
- Clarion Events Ltd.
- Viad Corp(GES)
- Emerald Holding Inc.
- Hyve Group plc
- dmg events
- Freeman Company
- Itochu Corp(Congrex)
第7章 市場機會與未來展望
The telecom service assurance market was valued at USD 12.25 billion in 2025 and estimated to grow from USD 13.46 billion in 2026 to reach USD 21.58 billion by 2031, at a CAGR of 9.88% during the forecast period (2026-2031).
Heightened performance-monitoring needs, 5G standalone adoption, and AI-centric zero-touch operations have boosted near-term spending as operators transition from reactive to proactive network management paradigms. Private-network and IoT vertical use cases are widening the addressable base, while hyperscaler partnerships are redirecting assurance architectures toward cloud-native, open-API designs. Competitive intensity has remained moderate; large multinationals are consolidating adjacent capabilities through acquisitions to strengthen end-to-end portfolios. North America continued to dominate in 2025, yet Asia Pacific's swift 5G rollout and enterprise digitalization yielded the fastest regional growth. Multiplying compliance mandates-from STIR/SHAKEN to the EU AI Act-have further entrenched the telecom service assurance market as a mission-critical spend category.
Global Telecom Service Assurance Market Trends and Insights
AI-centric Zero-touch Operations Adoption
Widespread automation initiatives reshaped network operations in 2024-2025 as operators pursued TM Forum Level 4-5 autonomy to curb operating expenses and sharpen service quality. Ericsson's joint work with AWS on Agentic AI proved that intent-based orchestration can cut manual interventions and lift customer satisfaction. TM Forum economic modelling estimated average annual savings of USD 800 million per tier-1 operator once AI-driven closed-loop control matures. Eighty-seven percent of global carriers had at least one production AI use case by late-2024, yet half cited fragmented data collection as the top barrier, spurring demand for unified assurance data lakes. Regulators added momentum: the EU AI Act requires transparent and auditable models, strengthening procurement criteria for assurance platforms that embed explainability. These forces collectively enlarged spending allocations to AI-native assurance modules, reinforcing growth in the telecom service assurance market.
5G SA Roll-out Demanding Real-time SLA Visibility
Commercial 5G standalone networks ran at scale in North America, Europe, and key Asia Pacific markets during 2024, triggering unprecedented resiliency requirements. NETSCOUT released virtual tap technology to ingest 100 Gbps traffic streams for microsecond-level analytics across cloudified cores. Spirent's active-assurance probes generated synthetic traffic to validate slice performance before customer impact, reversing long-standing reactive operating models. Service providers prioritized slice-aware analytics that tie transport, core, and RAN metrics into unified dashboards, a gap that traditional OSS/BSS could not cover. Standards groups TM Forum and 3GPP finalized slice-specific KPIs, propelling vendors to embed them natively. Heightened enterprise SLA expectations-especially for robotics and AR-further elevated real-time assurance from an optional feature to a contractual necessity.
Capex Freezes by Tier-1 MNOs 2024-25
Carrier capex contracted sharply in 2024 as 5G radio builds peaked and macroeconomic uncertainty rose. Dell'Oro's tracking placed industry capex 8% lower year-over-year, with projections for a 2% CAGR decline through 2027. Large United States operators reduced infrastructure outlays by roughly 50% versus prior budgets, delaying non-essential software expansions. Assurance vendors faced extended sales cycles and heightened ROI scrutiny; however, they leveraged cost-savings narratives-predictive maintenance and energy optimization-to remain on procurement short lists. Analysts expect budgets to thaw in late-2025 once 5G monetization initiatives mature, positioning assurance spending to rebound alongside renewed RAN densification.
Other drivers and restraints analyzed in the detailed report include:
- Compliance Pressure (STIR/SHAKEN, GDPR, EU AI Act)
- Telco API Monetization Needs End-to-end Quality
- Legacy OSS/BSS Integration Complexity
For complete list of drivers and restraints, kindly check the Table Of Contents.
Segment Analysis
Performance Monitoring and Analytics captured 34.78% revenue in 2025, underpinning every major network-modernization program. The segment's high share reflected urgent needs to visualize radio, transport, and core domains in real time. Cisco's AI-augmented telemetry streams exemplified how operators pivoted from threshold-based alarms to predictive analytics that pre-empt congestion. The telecom service assurance market size tied to Performance Monitoring is projected to maintain a robust mid-single-digit CAGR as slice-aware metrics expand.
Automated Root-Cause and Remediation rose as the high-growth niche, forecast at 11.02% CAGR through 2031, propelled by TM Forum Level-4 autonomy targets. Carriers demanded closed-loop feedback that self-heals degraded slices within seconds, slashing MTTR by up to 60%. Vendors bundled machine-learning policy engines that correlate billions of events and recommend remediation scripts, compressing troubleshooting head-counts. Over 30 global operators issued RFPs for root-cause AI modules during 2025, signaling a maturation path from pilot to mainstream adoption.
On-premises platforms still held 50.62% share in 2025 as operators sought tight control over sensitive core data. However, cloud-native instances of telecom service assurance market solutions expanded 12.08% annually, enabled by containerization and CI/CD pipelines. Red Hat's Kubernetes-based OSS reference stack showcased cost benefits from elastic scaling and managed services. Simultaneously, Infovista's KLERITY delivered vendor-agnostic assurance with multi-tenancy to serve enterprise customers in SaaS mode.
Hybrid mode is emerging as the default architecture: heavy packet brokering and lawful-intercept workloads remain on-premises, while AI training and long-term analytics shift to public clouds. This duality addresses data-sovereignty directives yet harnesses hyperscaler GPUs for model training. The telecom service assurance market size for hybrid architectures is forecast at USD 10.29 billion by 2031, advancing on par with overall market CAGR.
The Telecom Service Assurance Market Report is Segmented by Solution Type (Fault and Event Management, Performance Monitoring and Analytics, and More), Deployment Mode (On-Premises, Cloud-Native, and Hybrid), Operator Type (Mobile Network Operators, Fixed and Cable Operators, and More), Application Domain (5G RAN Assurance, Core and Edge Assurance, and More), and Geography. The Market Forecasts are Provided in Terms of Value (USD).
Geography Analysis
North America sustained 31.88% share in 2025, fueled by STIR/SHAKEN compliance deadlines and early standalone-core commercialization. Operators such as AT&T and Verizon piloted Level-4 energy-optimization use cases that trimmed cell-site power by 5%. Integration with AWS and Google Cloud advanced the regional shift toward assurance-as-code pipelines. The telecom service assurance market size tied to North America is projected at USD 7.18 billion by 2031, maintaining mid-single-digit growth as private-5G initiatives scale.
Asia Pacific rose as the primary growth engine, logging a 12.12% CAGR through 2031 on the back of nationwide 5G coverage in India, Thailand, and Australia. Fitch Ratings affirmed stable credit metrics for many Asia-Pacific telcos, enabling sustained investments in assurance modernization. Enterprise 5G and massive IoT deployments across manufacturing corridors spurred demand for slice-aware and device-centric monitoring, doubling average deal sizes compared with LTE-era contracts.
Europe retained significant opportunity, balancing GDPR and impending EU AI Act compliance burdens with open-RAN diversification. Operators sought vendor-neutral dashboards that reconcile multiple RU/DU suppliers, elevating the appeal of disaggregated assurance. Middle East and Africa gained traction through Comarch's multi-domain OSS rollouts, which align with government digital-economy blueprints. Latin America approached the tipping point for 5G dominance, with GSMA projecting 60% 5G penetration by 2030. This transition necessitates cloud-hosted assurance to offset constrained capex budgets.
- ASM Global
- Informa PLC
- Messe Frankfurt GmbH
- Reed Exhibitions (RX Global)
- Maritz Global Events Inc.
- MCI Group
- Cvent Holding Corp.
- GL Events SA
- Comexposium
- Fiera Milano SpA
- Koelnmesse GmbH
- Tarsus Group
- SMG (merged into ASM Global)
- Clarion Events Ltd.
- Viad Corp (GES)
- Emerald Holding Inc.
- Hyve Group plc
- dmg events
- Freeman Company
- Itochu Corp (Congrex)
Additional Benefits:
- The market estimate (ME) sheet in Excel format
- 3 months of analyst support
TABLE OF CONTENTS
1 INTRODUCTION
- 1.1 Study Assumptions and Market Definition
- 1.2 Scope of the Study
2 RESEARCH METHODOLOGY
3 EXECUTIVE SUMMARY
4 MARKET LANDSCAPE
- 4.1 Market Overview
- 4.2 Market Drivers
- 4.2.1 Rapid rebound of in-person business travel budgets
- 4.2.2 Corporate sustainability mandates shifting toward carbon-neutral events
- 4.2.3 Technology-enabled hybrid formats expanding attendee reach
- 4.2.4 Destination marketing incentives in emerging economies
- 4.2.5 Experiential design demand from Gen-Z/Millennial workforces
- 4.2.6 Large-scale infrastructure build-outs in Gulf and ASEAN markets
- 4.3 Market Restraints
- 4.3.1 Volatile air-travel and accommodation pricing
- 4.3.2 Geopolitical uncertainty and visa restrictions
- 4.3.3 Data-privacy and cybersecurity compliance costs for hybrid events
- 4.3.4 Rising ESG scrutiny on event-related carbon footprints
- 4.4 Industry Value Chain Analysis
- 4.5 Regulatory Landscape
- 4.6 Technological Outlook
- 4.7 Porter's Five Forces Analysis
- 4.7.1 Threat of New Entrants
- 4.7.2 Bargaining Power of Buyers
- 4.7.3 Bargaining Power of Suppliers
- 4.7.4 Threat of Substitutes
- 4.7.5 Competitive Rivalry
5 MARKET SIZE AND GROWTH FORECASTS (VALUE)
- 5.1 By Event Type
- 5.1.1 Meetings
- 5.1.2 Incentives
- 5.1.3 Conferences
- 5.1.4 Exhibitions
- 5.1.5 Hybrid/Virtual Events
- 5.2 By Service Type
- 5.2.1 Event Planning and Management
- 5.2.2 Venue Rental
- 5.2.3 Transportation and Logistics
- 5.2.4 Accommodation
- 5.2.5 Food and Catering
- 5.2.6 Audio-Visual and Technology Services
- 5.2.7 Other Service Types
- 5.3 By Venue Type
- 5.3.1 Convention Centers
- 5.3.2 Hotels and Resorts
- 5.3.3 Outdoor / Unconventional Venues
- 5.3.4 Corporate Owned Facilities
- 5.4 By Industry Vertical
- 5.4.1 IT and Telecom
- 5.4.2 Healthcare and Pharmaceuticals
- 5.4.3 Banking, Financial Services and Insurance (BFSI)
- 5.4.4 Automotive and Manufacturing
- 5.4.5 Hospitality and Tourism
- 5.4.6 Government and Public Sector
- 5.4.7 Other Industry Verticals
- 5.5 By Geography
- 5.5.1 North America
- 5.5.1.1 United States
- 5.5.1.2 Canada
- 5.5.1.3 Mexico
- 5.5.2 South America
- 5.5.2.1 Brazil
- 5.5.2.2 Argentina
- 5.5.2.3 Rest of South America
- 5.5.3 Europe
- 5.5.3.1 Germany
- 5.5.3.2 United Kingdom
- 5.5.3.3 France
- 5.5.3.4 Italy
- 5.5.3.5 Spain
- 5.5.3.6 Russia
- 5.5.3.7 Rest of Europe
- 5.5.4 Asia Pacific
- 5.5.4.1 China
- 5.5.4.2 Japan
- 5.5.4.3 India
- 5.5.4.4 South Korea
- 5.5.4.5 Australia
- 5.5.4.6 Rest of Asia Pacific
- 5.5.5 Middle East and Africa
- 5.5.5.1 Middle East
- 5.5.5.1.1 United Arab Emirates
- 5.5.5.1.2 Saudi Arabia
- 5.5.5.1.3 Turkey
- 5.5.5.1.4 Rest of Middle East
- 5.5.5.2 Africa
- 5.5.5.2.1 South Africa
- 5.5.5.2.2 Nigeria
- 5.5.5.2.3 Kenya
- 5.5.5.2.4 Rest of Africa
- 5.5.5.1 Middle East
- 5.5.1 North America
6 COMPETITIVE LANDSCAPE
- 6.1 Market Concentration
- 6.2 Strategic Moves
- 6.3 Market Share Analysis
- 6.4 Company Profiles (includes Global level Overview, Market level overview, Core Segments, Financials as available, Strategic Information, Market Rank/Share for key companies, Products and Services, and Recent Developments)
- 6.4.1 ASM Global
- 6.4.2 Informa PLC
- 6.4.3 Messe Frankfurt GmbH
- 6.4.4 Reed Exhibitions (RX Global)
- 6.4.5 Maritz Global Events Inc.
- 6.4.6 MCI Group
- 6.4.7 Cvent Holding Corp.
- 6.4.8 GL Events SA
- 6.4.9 Comexposium
- 6.4.10 Fiera Milano SpA
- 6.4.11 Koelnmesse GmbH
- 6.4.12 Tarsus Group
- 6.4.13 SMG (merged into ASM Global)
- 6.4.14 Clarion Events Ltd.
- 6.4.15 Viad Corp (GES)
- 6.4.16 Emerald Holding Inc.
- 6.4.17 Hyve Group plc
- 6.4.18 dmg events
- 6.4.19 Freeman Company
- 6.4.20 Itochu Corp (Congrex)
7 MARKET OPPORTUNITIES AND FUTURE OUTLOOK
- 7.1 White-space and Unmet-Need Assessment
 通訊服務擔保市場-2026-2032年全球市場預測
 2026-2030年全球通訊服務保證市場
 通訊服務保障市場預測至2034年-按組件、部署模式、組織規模、網路類型、應用、最終用戶和地區分類的全球分析
 通訊服務保障市場分析及預測(至2035年):按類型、產品、服務、技術、組件、應用、部署、最終用戶及解決方案分類
 2026年全球電信服務擔保市場報告
 電信服務保障市場報告:按營運商、解決方案、部署類型、組織規模和地區分類(2026-2034 年)
 電信服務保障市場-全球產業規模、佔有率、趨勢、機會與預測:按部署方式、營運商類型、組織規模、服務、系統、地區和競爭格局分類,2021-2031年日本電信服務保障市場報告(依營運商(固網、行動)、解決方案(軟體、服務)、部署方式(本地部署、雲端部署)、企業規模(中小企業、大型企業)和地區分類,2026-2034 年)
 2026 年至 2032 年通訊服務保障市場(依部署模式、營運商類型、最終用戶和地區分類)
 通訊服務保障市場規模、佔有率和成長分析(按組件、營運商類型、部署方法、組織規模和地區):產業預測(2024-2031)