


 |
市場調查報告書
商品編碼
1934833
越南電信行動網路業者:市場佔有率分析、產業趨勢與統計、成長預測(2026-2031)Vietnam Telecom MNO - Market Share Analysis, Industry Trends & Statistics, Growth Forecasts (2026 - 2031) |
||||||
※ 本網頁內容可能與最新版本有所差異。詳細情況請與我們聯繫。
預計到 2026 年,越南電信行動網路營運商 (MNO) 市場的規模將達到 75.2 億美元。
預計該產業規模將從 2025 年的 72.2 億美元成長到 2031 年的 92.1 億美元,2026 年至 2031 年的複合年成長率為 4.15%。
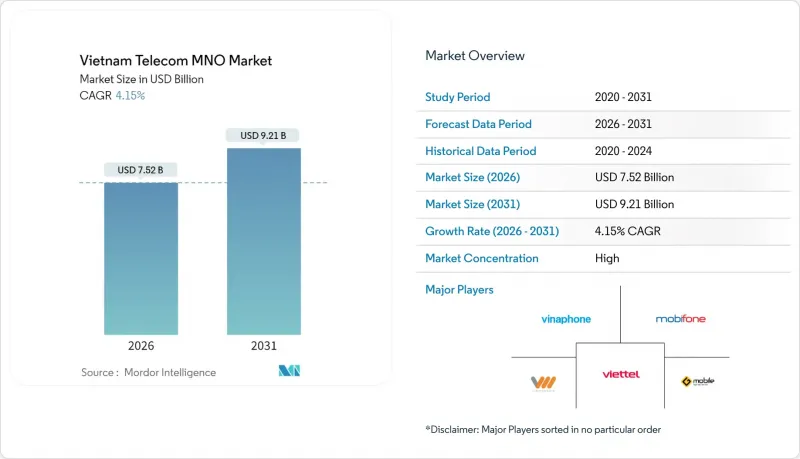
不斷成長的數據消費、全國範圍內的5G網路部署以及政府的支持性政策正在推動越南電信服務從語音轉型為數位服務。同時,通訊業者正利用高階企業服務來應對語音收入的下滑。對邊緣運算、私人5G網路和衛星農村接入的投資正在擴大目標用戶群體,並支撐越南電信行動網路營運商(MNO)市場的穩定收入成長。儘管價格競爭仍然激烈,但嚴格的基礎設施共用有效控制了營運成本和資本支出,從而維持了營運利潤率。高度集中的市場格局——三家國有通訊業者佔據了超過95%的用戶佔有率——為快速的技術升級提供了必要的規模,並保護了越南電信行動網路營運商市場免受新進入者的衝擊。
越南電信行動網路營運商市場趨勢與洞察
4G和5G的快速部署將推動行動數據需求的激增。
2025年4月進行的早期5G試驗實現了364.43 Mbps的平均速度,加速了對高頻寬服務的需求。隨著2G服務在2026年和3G服務在2028年強制終止,用戶正在遷移到更高價值的4G和5G套餐,這自然提高了每位用戶平均收入(ARPU)。 Viettel在短短幾個月內就獲得了400萬5G用戶,其中70%的用戶體驗到了超過1.5 Gbps的速度,這證明消費者願意為高性能支付更高的價格。基礎設施共用降低了部署成本,並實現了全國63個省份的覆蓋。快速成長的流量推動了邊緣運算節點和內容分發網路(CDN)的發展,通訊業者正在向越南電信行動網路營運商(MNO)市場中更廣泛的數位基礎設施公司轉型。
國家數位轉型計畫加速寬頻普及
政府的目標是到2024年10月達到82.4%的家庭光纖覆蓋,這一目標已提前於2025年實現。 2024年發放的2,000萬張電子ID卡增加了可靠寬頻接取電子政府服務的需求。一個處理了13億次查詢的人口資料庫表明,數位活動的規模之大需要強大的網路支援。 48個智慧城市計劃和峴港市的半導體投資為通訊業者帶來了可預測的流量。新的數位服務進一步推動了對網路連接的需求,形成良性循環,確保越南電信行動網路營運商(MNO)市場的收入持續成長。
日益激烈的價格競爭對每位用戶平均收入(ARPU)帶來壓力。
諸如FPT Telecom計劃於2025年4月將住宅寬頻速度翻倍頻寬升級方案,加速了每兆位元成本的下降。 VNPT和Viettel也採取了類似策略,隨著OTT應用在通訊佔據主導地位,語音和簡訊收入有所下降。儘管通訊業者尋求透過網路共用提高成本效益,但持續的ARPU(每用戶平均收入)壓力正迫使越南電信行動網路營運商(MNO)市場轉向企業級和垂直整合解決方案。
細分市場分析
到2025年,數據和網際網路服務將佔越南電信行動網路營運商(MNO)市場48.62%的佔有率,這印證了越南電信市場正經歷從語音到數位連接的結構性轉變。物聯網/機器對機器(IoT/M2M)領域已呈現4.32%的年複合成長率(CAGR)的最快成長勢頭,隨著工廠自動化和城市智慧基礎設施平台的普及,其市場規模預計將迅速擴張。語音和簡訊服務已被OTT通訊和通話服務所取代,延續了長期下滑的趨勢。付費電視和捆綁式OTT影片服務則受益於不斷擴展的光纖網路而蓬勃發展,推動了家庭平均每用戶收入(ARPU)的成長。
5G 能夠支援邊緣運算、AR/VR 和網路切片,為通訊業者提供以具成本效益價格提供高速網路和低延遲服務的途徑。針對超大規模資料中心的批發回程回程傳輸能夠帶來高收益客戶,而數位錢包等附加價值服務(VAS) 則能提升交叉銷售收入。雖然這些相鄰的收入來源能夠緩解傳統現金流下滑的風險,但升級越南電信行動網路營運商 (MNO) 市場的客戶體驗平台對於成功收購至關重要。
越南電信行動網路營運商 (MNO) 市場按服務類型(語音服務、數據及網際網路服務、通訊服務、物聯網及機器對機器 (IoT & M2M) 服務、OTT 及付費電視服務、其他服務)及最終用戶(企業、消費者)進行細分。市場預測以價值(美元)和用戶數量(用戶數)為單位。
其他福利:
- Excel格式的市場預測(ME)表
- 3個月的分析師支持
目錄
第1章 引言
- 研究假設和市場定義
- 調查範圍
第2章調查方法
第3章執行摘要
第4章 市場情勢
- 市場概覽
- 監理與政策框架
- 頻譜環境與競爭格局
- 通訊業生態系統
- 宏觀經濟與外在因素
- 波特五力模型
- 競爭對手之間的競爭
- 新進入者的威脅
- 供應商的議價能力
- 買方的議價能力
- 替代品的威脅
- 領先行動網路營運商的關鍵績效指標(2020-2025)
- 獨立行動用戶和滲透率
- 行動網路使用者數量和普及率
- 按接入技術分類的SIM卡連線數和滲透率
- 蜂巢式物聯網/M2M連接
- 寬頻連線(移動和固定)
- ARPU(每位用戶平均收入)
- 用戶平均每月數據使用量(GB/月)
- 市場促進因素
- 4G和5G的快速部署將推動行動數據需求的激增。
- 國家數位轉型計畫加速寬頻普及
- 智慧型手機價格親民,推動了數據流量消耗。
- 資料中心擴張正在推動對批發光纖的需求。
- 在製造地部署私有 5G/IoT
- 光纖付費電視方案提升家庭平均每用戶收入
- 市場限制
- 日益激烈的價格競爭對每位用戶平均收入(ARPU)帶來壓力。
- 頻譜高成本且重複使用延遲
- 山區通行權成本較高,導致遍遠地區的光纖安裝工程停滯不前。
- 缺乏對新成立的虛擬營運商(MVNO)的監管,阻礙了服務創新。
- 技術展望
- 電信業主要經營模式分析
- 定價模式和定價分析
第5章 市場規模與成長預測
- 通訊總收入和每位用戶平均收入
- 服務類型
- 語音服務
- 數據和網際網路服務
- 通訊服務
- 物聯網和機器對機器服務
- OTT和付費電視服務
- 其他服務(附加價值服務、漫遊和國際服務、企業和批發服務等)
- 最終用戶
- 公司
- 一般消費者
第6章 競爭情勢
- 市場集中度
- 主要供應商的策略與投資動向(2023-2025)
- 2024年行動網路營運商市場佔有率分析
- Product Benchmarking Analysis for mobile network services
- MNO snapshot(subscribers, churn rate, ARPU, etc.)
- 行動網路營運商公司簡介*
- Viettel Group
- Vinaphone
- Mobifone Corporation
- Vietnamobile
- Gmobile
第7章 市場機會與未來展望
Vietnam Telecom MNO Market size in 2026 is estimated at USD 7.52 billion, growing from 2025 value of USD 7.22 billion with 2031 projections showing USD 9.21 billion, growing at 4.15% CAGR over 2026-2031.
Heightened data consumption, the nationwide 5G roll-out, and supportive government policies are steering the transition from voice to digital services while operators exploit premium enterprise offerings to counter falling voice revenue. Investments in edge computing, private 5G, and satellite-enabled rural access are broadening the addressable user base and underpinning steady top-line expansion across the Vietnam telecom MNO market. Price competition remains intense, yet disciplined infrastructure sharing contains opex and capex, preserving operating margins. A high concentration ratio-three state-backed carriers hold more than 95% of subscriptions-creates the scale needed for rapid technology upgrades and shields the Vietnam telecom MNO market from disruptive entrants.
Vietnam Telecom MNO Market Trends and Insights
Rapid 4G and 5G rollout drives mobile-data surge
Early 5G tests delivered median speeds of 364.43 Mbps in April 2025, propelling user demand for high-bandwidth services. The mandated sunset of 2G in 2026 and 3G in 2028 channels subscribers onto higher-value 4G and 5G plans, naturally lifting ARPU. Viettel captured 4 million 5G users within months, with 70% experiencing speeds above 1.5 Gbps, proving consumers will pay premiums for performance. Infrastructure sharing reduced deployment costs and enabled coverage in all 63 provinces. Surging traffic is spurring edge-computing nodes and CDNs, so carriers evolve into broader digital-infrastructure firms inside the Vietnam telecom MNO market.
National Digital Transformation programme accelerates broadband uptake
Government targets pushed fiber penetration to 82.4% of households by October 2024, already above the 2025 goal. Issuance of 20 million electronic ID cards in 2024 amplified demand for reliable broadband to access e-government services. A population database that handled 1.3 billion queries proves the scale of digital activity requiring sturdy networks. Forty-eight smart-city projects and Da Nang's semiconductor investments are transferring predictable traffic to carriers. Positive network effects emerge as each new digital service spurs further connectivity demand, assuring durable revenue expansion across the Vietnam telecom MNO market.
Intensifying price wars compress ARPU
Bandwidth upgrades at unchanged prices-FPT Telecom doubled speeds for residential users in April 2025-accelerated the decline in price-per-megabit. VNPT and Viettel replicated the strategy, pushing voice and SMS income lower as OTT apps dominate messaging. Operators chase cost efficiencies through network sharing, but sustained ARPU pressure forces a pivot toward enterprise and vertical solutions within the Vietnam telecom MNO market.
Other drivers and restraints analyzed in the detailed report include:
- Data-centre build-outs elevate wholesale fibre demand
- Private 5G/IoT adoption in manufacturing parks
- High spectrum costs and slow refarming
For complete list of drivers and restraints, kindly check the Table Of Contents.
Segment Analysis
Data and internet offerings captured 48.62% of Vietnam telecom MNO market share in 2025, confirming the structural pivot from voice to digital connectivity. IoT and M2M already produce the fastest 4.32% CAGR, and the Vietnam telecom MNO market size for that niche is projected to scale rapidly as factories automate and cities deploy smart-infrastructure platforms. Voice and SMS continue their secular decline, displaced by OTT messaging and calling. Pay-TV and bundled OTT video ride on expanded fibre footprints, accelerating household ARPU growth.
5G unlocks edge computing, AR/VR, and network slicing, giving carriers tools to price premium speeds and latency guarantees. Wholesale backhaul to hyperscale data centers adds high-margin accounts, while VAS such as digital wallets broaden cross-sell revenue. These adjacent income streams de-risk falling legacy cash flows, yet successful capture hinges on upgrading customer-experience platforms across the Vietnam telecom MNO market.
The Vietnam Telecom MNO Market is Segmented by Service Type (Voice Services, Data and Internet Services, Messaging Services, Iot and M2M Services, OTT and PayTV Services, Other Services), End User (Enterprises, Consumers). The Market Forecasts are Provided in Terms of Value (USD) and Volume (Subscribers).
List of Companies Covered in this Report:
- Viettel Group
- Vinaphone
- Mobifone Corporation
- Vietnamobile
- Gmobile
Additional Benefits:
- The market estimate (ME) sheet in Excel format
- 3 months of analyst support
TABLE OF CONTENTS
1 INTRODUCTION
- 1.1 Study Assumptions and Market Definition
- 1.2 Scope of the Study
2 RESEARCH METHODOLOGY
3 EXECUTIVE SUMMARY
4 MARKET LANDSCAPE
- 4.1 Market Overview
- 4.2 Regulatory and Policy Framework
- 4.3 Spectrum Landscape and Competitive Holdings
- 4.4 Telecom Industry Ecosystem
- 4.5 Macroeconomic and External Drivers
- 4.6 Porter's Five Forces
- 4.6.1 Competitive Rivalry
- 4.6.2 Threat of New Entrants
- 4.6.3 Bargaining Power of Suppliers
- 4.6.4 Bargaining Power of Buyers
- 4.6.5 Threat of Substitutes
- 4.7 Key MNO KPIs (2020-2025)
- 4.7.1 Unique Mobile Subscribers and Penetration Rate
- 4.7.2 Mobile Internet Users and Penetration Rate
- 4.7.3 SIM Connections by Access Technology and Penetration
- 4.7.4 Cellular IoT / M2M Connections
- 4.7.5 Broadband Connections (Mobile and Fixed)
- 4.7.6 ARPU (Average Revenue Per User)
- 4.7.7 Average Data Usage per Subscription (GB/month)
- 4.8 Market Drivers
- 4.8.1 Rapid 4G and 5G rollout drives mobile-data surge
- 4.8.2 National Digital Transformation programme accelerates broadband uptake
- 4.8.3 Smartphone affordability boosts data consumption
- 4.8.4 Data-centre build-outs elevate wholesale fibre demand
- 4.8.5 Private 5G/IoT adoption in manufacturing parks
- 4.8.6 Pay-TV fibre bundles lift household ARPU
- 4.9 Market Restraints
- 4.9.1 Intensifying price wars compress ARPU
- 4.9.2 High spectrum costs and slow refarming
- 4.9.3 Mountainous right-of-way costs stall rural fibre
- 4.9.4 Nascent MVNO rules delay service innovation
- 4.10 Technological Outlook
- 4.11 Analysis of key business models in Telecom
- 4.12 Analysis of Pricing Models and Pricing
5 MARKET SIZE AND GROWTH FORECASTS (VALUE)
- 5.1 Overall Telecom Revenue and ARPU
- 5.2 Service Type
- 5.2.1 Voice Services
- 5.2.2 Data and Internet Services
- 5.2.3 Messaging Services
- 5.2.4 IoT and M2M Services
- 5.2.5 OTT and PayTV Services
- 5.2.6 Other Services (VAS, Roaming and International Services, Enterprise and Wholesale Services, etc.)
- 5.3 End-User
- 5.3.1 Enterprises
- 5.3.2 Consumer
6 COMPETITIVE LANDSCAPE
- 6.1 Market Concentration
- 6.2 Strategic Moves and Investments by key vendors, 2023-2025
- 6.3 Market share analysis for MNOs, 2024
- 6.4 Product Benchmarking Analysis for mobile network services
- 6.5 MNO snapshot (subscribers, churn rate, ARPU, etc.)
- 6.6 Company Profiles* of MNOs (Includes Business Overview | Service Portfolio | Financials | Business Strategy and Recent Developments | SWOT Analysis)
- 6.6.1 Viettel Group
- 6.6.2 Vinaphone
- 6.6.3 Mobifone Corporation
- 6.6.4 Vietnamobile
- 6.6.5 Gmobile
7 MARKET OPPORTUNITIES AND FUTURE OUTLOOK
- 7.1 White-space and Unmet-Need Assessment
 5G MVNO市場:按套餐類型、最終用戶、設備類型、銷售管道、產業和網路類型分類-2026-2032年全球市場預測
 2026年全球行動虛擬網路營運商(MVNO)市場報告
 行動虛擬網路營運商 (MVNO) 市場規模、佔有率、趨勢和預測:按類型、商業模式、服務類型、用戶數量和地區分類,2026-2034 年
 行動虛擬網路營運商 (MVNO) 市場分析及預測(至 2035 年):按類型、產品類型、服務、技術、組件、應用、部署類型、最終用戶、解決方案和功能分類
 亞太地區行動虛擬網路營運商(MVNO):市場佔有率分析、產業趨勢與統計、成長預測(2026-2031)新加坡電信行動網路業者:市場佔有率分析、產業趨勢與統計、成長預測(2026-2031)東協行動虛擬網路營運商(MVNO):市場佔有率分析、產業趨勢與統計、成長預測(2026-2031)泰國電信行動網路營運商:市場佔有率分析、產業趨勢與統計數據、成長預測(2026-2031)美國行動虛擬網路營運商:市場佔有率分析、行業趨勢和統計數據、成長預測(2026-2031 年)美國電信行動網路營運商:市場佔有率分析、產業趨勢與統計數據、成長預測(2026-2031 年)