


 |
市場調查報告書
商品編碼
1937405
泰國電信行動網路營運商:市場佔有率分析、產業趨勢與統計數據、成長預測(2026-2031)Thailand Telecom MNO - Market Share Analysis, Industry Trends & Statistics, Growth Forecasts (2026 - 2031) |
||||||
※ 本網頁內容可能與最新版本有所差異。詳細情況請與我們聯繫。
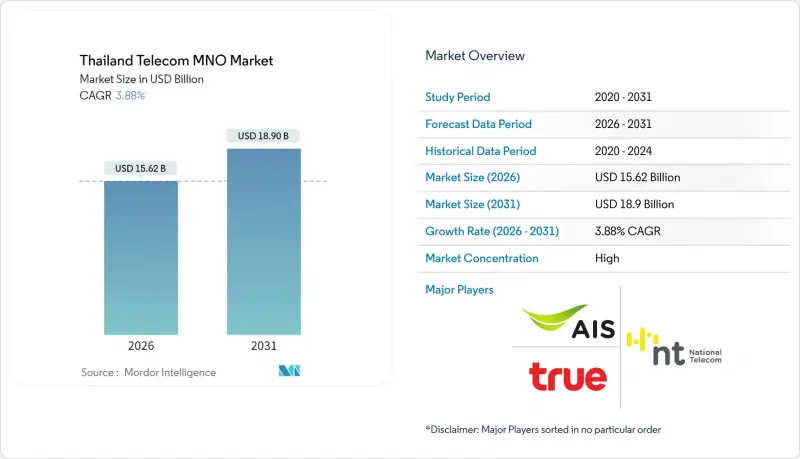
2025年泰國電信行動網路營運商市場價值150.4億美元,預計到2031年將達到189億美元,高於2026年的156.2億美元。
預計在預測期(2026-2031 年)內,複合年成長率將達到 3.88%。
這一成長軌跡表明,在包括AIS-True-dtac雙寡頭壟斷格局、5G加速部署以及向企業主導的專用網路轉型等結構性變化中,營收仍保持穩定成長。數據和網際網路服務已佔收入的約三分之二,物聯網連接正在全國範圍內的NB-IoT基礎設施中快速擴展。同時,東部經濟走廊的智慧產業計劃正在推動對超低延遲連接的大規模投資,而農村地區智慧型手機普及率的提高也擴大了潛在用戶群體。在監管方面,頻譜價格上漲給營運商的財務狀況帶來了壓力,而數位經濟支持目標和普遍服務義務基金則為網路擴展開闢了新的途徑。因此,競爭格局正在從單純的價格競爭轉向技術領先、服務品質和企業解決方案的深度。
泰國電信行動網路營運商市場趨勢與洞察
全國範圍內的 5G 部署加速了行動數據貨幣化
到2024年,5G網路將覆蓋泰國95%的人口,為通訊業者實現比4G快24倍的速度奠定基礎,並支持推出高階定價模式。 AIS總合獲得超過1460MHz的頻譜資源,涵蓋低頻、中頻和高頻頻寬,並取得了泰國最高的118.84Mbps速度評分。除了面向消費者的eMBB服務外,該基礎設施還將支援邊緣運算架構,並為企業開闢新的收入來源。 True Corporation正在透過2.6GHz頻段的動態頻譜共用來提高頻譜效率,使其能夠同時支援4G和5G流量。在泰國美的工廠等地的私人5G部署,已實現了15-20%的效率提升和30%的營運成本節約,這表明企業願意為有保障的吞吐量付費。根據政府預測,到 2035 年,5G 預計將為國內生產總值) 增加 93 億美元,進一步鞏固泰國通訊業者市場的數據驅動型成長地位。
OTT影片和遊戲流量的快速成長推動了ARPU值的成長
OTT影片和雲端遊戲平台的普及導致行動數據消耗激增,推動了用戶向高階套餐的轉變,尤其是在都市區千禧世代。提供包含加值內容、服務品質保證和無限資料通訊的業者發現,5G用戶的平均每用戶收入(ARPU)比4G用戶高出10-15%。雲端遊戲對延遲的敏感度使得5G獨立組網(SA)模式更具優勢,從而能夠提供差異化的服務,降低曼谷競爭激烈的後付費市場中的客戶流失率。在全國範圍內,55%的亞太地區通訊業者預計2024年ARPU將實現成長,泰國通訊業者也正順應這一趨勢,採用基於使用量的分級收費系統。全高清和4K影片串流媒體是最大的流量類別,因此需要在人口密集地區持續增加無線接取網路的密度。
全球最高的頻譜授權費對營運商的財務狀況造成壓力
泰國2023年的頻譜競標籌集了32億美元,使其成為全球人均頻譜使用費最高的國家。經濟模擬顯示,若牌照費超過2,000億泰銖,五年內5G普及率將降至50%,低於低成本情境的70%。 True Corporation公佈季度虧損,部分原因是頻譜相關債務的高利率。泰國國家電信公司對700MHz頻譜的343億泰銖投資也同樣拖累了現金流,凸顯了未來網路投資預算面臨的結構性壓力。高昂的維修成本可能延緩遍遠地區的5G部署,並限制先進獨立組網(SA)能力的研發。
細分市場分析
預計到2025年,數據和網路收入將佔泰國電信行動網路營運商(MNO)市場佔有率的63.78%,並在2031年之前保持領先地位,這主要得益於影片串流、雲端遊戲和遠端辦公應用的興起。語音流量持續長期下降,隨著即時通訊應用取代傳統短信,其在泰國電信MNO市場規模中的佔比已降至10.00%以下。物聯網(IoT)和機器對機器(M2M)目前收入佔比不高,但其複合年成長率(CAGR)高達4.00%,是成長最快的領域,這主要得益於全國範圍內的窄帶物聯網(NB-IoT)覆蓋和工業級5G獨立組網(SA)切片技術的應用,後者支持性部署、物流和維護。通訊業者正將連接服務與設備管理平台和分析儀錶板結合,以實現遠高於基本數據費率的平均每連接收入(ARPC)。 OTT和付費電視服務提供了交叉銷售機會:True利用其內容庫,而AIS則與全球串流媒體品牌合作,透過零費率優惠來鼓勵用戶升級資料方案。
泰國差異化的頻譜擁有情形正在重塑服務經濟格局。 AIS 新增的 700 MHz頻寬提升了資訊服務的室內覆蓋範圍,而 True 的 2.6 GHz DSS 則提高了峰值容量。兩家業者都在試點網路切片概念驗證,為工廠、醫院和 AGV 車隊提供有保障的延遲服務。全球預測顯示,到 2029 年,蜂巢式物聯網連接數將達到 64 億,泰國通訊業者正致力於透過產業客製化解決方案搶佔這一市場的重要佔有率。附加價值服務(VAS) 和漫遊服務目前仍處於小眾市場,但隨著泰國旅遊業需求的復甦,其重要性日益凸顯。與區域合作夥伴達成的無縫 5G漫遊協定,使通訊業者能夠吸引高消費遊客。
泰國電信行動網路業者 (MNO) 市場按服務類型(語音服務、數據及網際網路服務、通訊服務、物聯網及機器對機器 (IoT & M2M) 服務、OTT 及付費電視服務、其他服務)及最終用戶(企業、消費者)進行細分。市場預測以價值(美元)和用戶數量(用戶數)為單位。
其他福利:
- Excel格式的市場預測(ME)表
- 3個月的分析師支持
目錄
第1章 引言
- 研究假設和市場定義
- 調查範圍
第2章調查方法
第3章執行摘要
第4章 市場情勢
- 市場概覽
- 監理與政策框架
- 頻譜環境與競爭格局
- 通訊業生態系統
- 宏觀經濟與外在因素
- 波特五力分析
- 競爭對手之間的競爭
- 新進入者的威脅
- 供應商的議價能力
- 買方的議價能力
- 替代品的威脅
- 領先行動網路營運商的關鍵績效指標(2020-2025)
- 獨立行動用戶和滲透率
- 行動網路使用者數量和普及率
- 按接入技術分類的SIM卡連線數和滲透率
- 蜂巢式物聯網/M2M連接
- 寬頻連線(移動和固定)
- ARPU(每位用戶平均收入)
- 每用戶平均數據使用量(GB/月)
- 市場促進因素
- 全國範圍內的 5G 部署加速了行動數據貨幣化
- OTT影片和遊戲流量的快速成長推動了ARPU值的成長
- 企業數位轉型推動專用LTE和5G SA的需求
- 智慧型手機在農村地區的普及率飆升
- 東部經濟走廊(EEC)智慧產業計劃需要超低延遲連接
- 普遍服務義務(USO)基金對遠距基地台的補貼
- 市場限制
- 全球最高的頻譜牌照費對營運商的財務狀況帶來了壓力。
- True-dtac合併後採取的紓困措施加劇了價格競爭。
- 國家數位身分實施的延遲限制了先進的金融科技和電信捆綁業務的發展
- 高密度5G基地台網路將推高電費
- 技術展望
- 電信業主要經營模式分析
- 定價模式和定價分析
第5章 市場規模與成長預測
- 通訊總收入和每位用戶平均收入
- 按服務類型
- 語音服務
- 數據和網際網路服務
- 通訊服務
- 物聯網和機器對機器服務
- OTT和付費電視服務
- 其他服務(附加價值服務、漫遊和國際服務、企業和批發服務等)
- 最終用戶
- 公司
- 一般消費者
第6章 競爭情勢
- 市場集中度
- 主要供應商的策略與投資動向(2023-2025)
- 2024年行動網路營運商市場佔有率分析
- Product Benchmarking Analysis for mobile network services
- MNO snapshot(subscribers, churn rate, ARPU, etc.)
- 行動網路營運商公司簡介*
- Advanced Info Service(AIS)
- True Corporation Public Company Limited
- National Telecom(NT)
第7章 市場機會與未來展望
The Thailand Telecom MNO Market was valued at USD 15.04 billion in 2025 and estimated to grow from USD 15.62 billion in 2026 to reach USD 18.9 billion by 2031, at a CAGR of 3.88% during the forecast period (2026-2031).
That trajectory reflects measured topline expansion even as the sector undergoes deep structural change driven by the AIS-True-dtac duopoly, accelerated 5G rollouts, and an enterprise-led push toward private networks. Data and Internet services already account for almost two-thirds of revenue, while IoT connections scale quickly on nationwide NB-IoT infrastructure. At the same time, the Eastern Economic Corridor's smart-industry projects anchor large investments in ultra-low-latency connectivity, and rising rural smartphone adoption broadens the addressable subscriber base. On the regulatory front, high spectrum prices weigh on operator finances, yet supportive digital-economy targets and the Universal Service Obligation Fund open further network-expansion avenues. Competitive differentiation, therefore, shifts from pure price plays to technology leadership, quality of service, and enterprise solution depth.
Thailand Telecom MNO Market Trends and Insights
Nationwide 5G rollout accelerating mobile data monetization
5G networks covered 95% of Thailand's population in 2024, giving operators a platform for speed improvements 24 times faster than 4G and enabling premium pricing tiers . AIS holds more than 1,460 MHz across low-, mid-, and high-bands, translating into the country's highest Speed Score of 118.84 . Beyond consumer eMBB services, the same infrastructure supports edge-computing architectures that unlock new enterprise revenue streams. True Corporation improves spectral efficiency through Dynamic Spectrum Sharing on the 2.6 GHz band, a method that concurrently sustains 4G and 5G traffic. Private 5G deployments at factories like Midea Thailand delivered 15-20% efficiency gains and 30% opex savings, validating enterprise willingness to pay for guaranteed throughput. Government projections show 5G could inject USD 9.3 billion into national GDP by 2035, further anchoring the Thailand Telecom MNO market to data-driven growth .
Explosion in OTT video and gaming traffic driving ARPU uplift
Mobile data consumption surged as over-the-top video and cloud-gaming platforms gained traction, prompting a migration to higher-tier plans across urban millennials. Operators that bundle premium content, quality-of-service guarantees, and unlimited data observe ARPU premiums of 10-15% among 5G users versus 4G cohorts. Cloud gaming's sensitivity to latency favors 5G standalone slices, enabling differentiated offers that reduce churn in the highly contested Bangkok post-paid segment. Nationally, 55% of Asia-Pacific operators posted ARPU growth in 2024, and Thai carriers mirror this trend by leveraging data-usage-based pricing ladders. Video streaming in full-HD and 4K constitutes the single largest traffic category, compelling continued radio-access-network densification across populous corridors.
World-leading spectrum license fees straining operator balance sheets
Thailand's 2023 auctions raised USD 3.2 billion, positioning its spectrum fees among the costliest worldwide on a per-capita basis. Economic simulations show that license costs above THB 200 billion reduce five-year 5G adoption to 50%, versus 70% under lower-cost scenarios . True Corporation reported quarterly losses attributable in part to elevated interest expenses on spectrum-related debt. National Telecom's THB 34.3 billion outlay for 700 MHz blocks similarly eroded cash flow, highlighting systemic pressure on future network-investment budgets. High carrying costs risk delaying rural 5G rollouts and curtailing R&D for advanced standalone capabilities.
Other drivers and restraints analyzed in the detailed report include:
- Enterprise digital-transformation boosting private-LTE and 5G SA demand
- Soaring smartphone penetration in rural provinces
- Intensifying price wars following True-dtac merger remedies
For complete list of drivers and restraints, kindly check the Table Of Contents.
Segment Analysis
Data and Internet revenue represented 63.78% of Thailand Telecom MNO market share in 2025 and is projected to retain primacy through 2031 as video streaming, cloud gaming, and remote work applications multiply. Voice traffic continues its secular decline, falling below 10.00% of Thailand Telecom's MNO market size as messaging apps displace traditional SMS. IoT and M2M contribute a modest top-line share today but register the fastest 4.00% CAGR, driven by nationwide NB-IoT availability and industrial-grade 5G SA slices that enable predictive maintenance, logistics tracking, and smart-meter rollouts. Operators bundle connectivity with device-management platforms and analytics dashboards, broadening average revenue per connection well beyond basic data charges. OTT and Pay-TV services present cross-sell upside: True leverages its content library while AIS partners with global streaming brands, using zero-rating to spur data-plan upgrades.
Thailand's differentiated spectrum holdings shape service-type economics. AIS's additional 700 MHz blocks improve in-building coverage for data services, while True's 2.6 GHz DSS boosts peak capacity. Both carriers pilot network-slicing proofs-of-concept that sell guaranteed latency to factories, hospitals, and AGV fleets. Global forecasts place 6.4 billion cellular-IoT connections by 2029, and Thai operators seek an outsized slice of that volume through vertical-specific solutions. VAS and roaming lines remain niche but gain relevance as Thailand reopens tourism flows; seamless 5G roaming agreements with regional partners position carriers to capture high-spending visitors.
The Thailand Telecom MNO Market is Segmented by Service Type (Voice Services, Data and Internet Services, Messaging Services, Iot and M2M Services, OTT and PayTV Services, and Other Services), and End User (Enterprises, Consumer). The Market Forecasts are Provided in Terms of Value (USD) and Volume (Subscribers).
List of Companies Covered in this Report:
- Advanced Info Service (AIS)
- True Corporation Public Company Limited
- National Telecom (NT)
Additional Benefits:
- The market estimate (ME) sheet in Excel format
- 3 months of analyst support
TABLE OF CONTENTS
1 INTRODUCTION
- 1.1 Study Assumptions and Market Definition
- 1.2 Scope of the Study
2 RESEARCH METHODOLOGY
3 EXECUTIVE SUMMARY
4 MARKET LANDSCAPE
- 4.1 Market Overview
- 4.2 Regulatory and Policy Framework
- 4.3 Spectrum Landscape and Competitive Holdings
- 4.4 Telecom Industry Ecosystem
- 4.5 Macroeconomic and External Drivers
- 4.6 Porter's Five Forces Analysis
- 4.6.1 Competitive Rivalry
- 4.6.2 Threat of New Entrants
- 4.6.3 Bargaining Power of Suppliers
- 4.6.4 Bargaining Power of Buyers
- 4.6.5 Threat of Substitutes
- 4.7 Key MNO KPIs (2020-2025)
- 4.7.1 Unique Mobile Subscribers and Penetration Rate
- 4.7.2 Mobile Internet Users and Penetration Rate
- 4.7.3 SIM Connections by Access Technology and Penetration
- 4.7.4 Cellular IoT / M2M Connections
- 4.7.5 Broadband Connections (Mobile and Fixed)
- 4.7.6 ARPU (Average Revenue Per User)
- 4.7.7 Average Data Usage per Subscription (GB/month)
- 4.8 Market Drivers
- 4.8.1 Nationwide 5G rollout accelerating mobile data monetisation
- 4.8.2 Explosion in OTT video and gaming traffic driving ARPU uplift
- 4.8.3 Enterprise digital-transformation boosting private-LTE and 5G SA demand
- 4.8.4 Soaring smartphone penetration in rural provinces
- 4.8.5 Eastern Economic Corridor (EEC) smart-industry projects requiring ultra-low-latency connectivity
- 4.8.6 Universal Service Obligation (USO) Fund subsidies for remote-area base-stations
- 4.9 Market Restraints
- 4.9.1 World-leading spectrum licence fees straining operator balance sheets
- 4.9.2 Intensifying price wars following True-dtac merger remedies
- 4.9.3 Delay in National Digital-ID rollout limiting advanced fintech-telco bundles
- 4.9.4 Rising electricity costs for dense 5G site grids
- 4.10 Technological Outlook
- 4.11 Analysis of key business models in Telecom Sector
- 4.12 Analysis of Pricing Models and Pricing
5 MARKET SIZE AND GROWTH FORECASTS (VALUE)
- 5.1 Overall Telecom Revenue and ARPU
- 5.2 Service Type
- 5.2.1 Voice Services
- 5.2.2 Data and Internet Services
- 5.2.3 Messaging Services
- 5.2.4 IoT and M2M Services
- 5.2.5 OTT and PayTV Services
- 5.2.6 Other Services (VAS, Roaming and International Services, Enterprise and Wholesale Services, etc.)
- 5.3 End-user
- 5.3.1 Enterprises
- 5.3.2 Consumer
6 COMPETITIVE LANDSCAPE
- 6.1 Market Concentration
- 6.2 Strategic Moves and Investments by key vendors, 2023-2025
- 6.3 Market share analysis for MNOs, 2024
- 6.4 Product Benchmarking Analysis for mobile network services
- 6.5 MNO snapshot (subscribers, churn rate, ARPU, etc.)
- 6.6 Company Profiles* of MNOs (Includes Business Overview | Service Portfolio | Financials | Business Strategy and Recent Developments | SWOT Analysis)
- 6.6.1 Advanced Info Service (AIS)
- 6.6.2 True Corporation Public Company Limited
- 6.6.3 National Telecom (NT)
7 MARKET OPPORTUNITIES AND FUTURE OUTLOOK
- 7.1 White-space and Unmet-Need Assessment
 行動虛擬網路營運商 (MVNO) 市場:2026-2032 年全球市場預測(按服務類型、費率方案、銷售管道、最終用戶產業和應用程式分類)5G MVNO市場:按套餐類型、最終用戶、設備類型、銷售管道、產業和網路類型分類-2026-2032年全球市場預測
 2026年全球行動虛擬網路營運商(MVNO)市場報告
 行動虛擬網路營運商 (MVNO) 市場規模、佔有率、趨勢和預測:按類型、商業模式、服務類型、用戶數量和地區分類,2026-2034 年
 行動虛擬網路營運商 (MVNO) 市場分析及預測(至 2035 年):按類型、產品類型、服務、技術、組件、應用、部署類型、最終用戶、解決方案和功能分類
 亞太地區行動虛擬網路營運商(MVNO):市場佔有率分析、產業趨勢與統計、成長預測(2026-2031)新加坡電信行動網路業者:市場佔有率分析、產業趨勢與統計、成長預測(2026-2031)東協行動虛擬網路營運商(MVNO):市場佔有率分析、產業趨勢與統計、成長預測(2026-2031)美國行動虛擬網路營運商:市場佔有率分析、行業趨勢和統計數據、成長預測(2026-2031 年)美國電信行動網路營運商:市場佔有率分析、產業趨勢與統計數據、成長預測(2026-2031 年)