


 |
市場調查報告書
商品編碼
1934695
美國金融科技市場:市場佔有率分析、產業趨勢與統計及成長預測(2026-2031年)United States Fintech - Market Share Analysis, Industry Trends & Statistics, Growth Forecasts (2026 - 2031) |
||||||
※ 本網頁內容可能與最新版本有所差異。詳細情況請與我們聯繫。
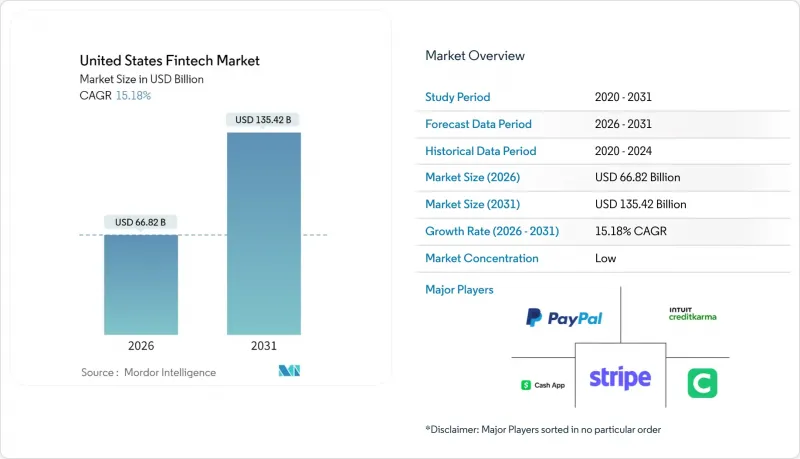
預計到 2026 年,美國金融科技市場規模將達到 668.2 億美元,高於 2025 年的 580.1 億美元。
預計到 2031 年將達到 1,354.2 億美元,2026 年至 2031 年的複合年成長率為 15.18%。
全國即時支付基礎設施、廣泛應用的嵌入式金融以及人工智慧驅動的風險管理工具的結合,正在重塑客戶預期,並迫使現有金融機構進行現代化轉型。儘管創業投資已開始從2024年的低迷期中復甦,但監管機構對銀行與金融科技公司合作的審查依然嚴格,影響著新產品的上市速度。從地區來看,美國金融科技市場持續受惠於西部地區的科技生態系統,而南部地區則由於營運成本低廉和州政府的支持政策,成長速度最快。市場競爭適中,沒有一家企業的市佔率超過兩位數,這為垂直整合的專業機構和區域銀行平台的發展留下了空間。
美國金融科技市場趨勢與洞察
即時支付的引入將加速數位化進程。
截至2024年8月,FedNow的參與銀行已從最初的35家擴展到1300多家金融機構,這表明公共基礎設施可以克服網路效應障礙。其50萬美元的交易限額吸引了先前依賴電匯的商業交易。同時,清算所的RTP網路在2024年第三季處理了8,700萬筆支付,總額達690億美元,較上一季成長約17%。金融科技公司正利用這項基礎設施,透過提供即時帳單支付和預支薪資等服務來擴大其每日有效用戶群。然而,多種即時支付方案的激增帶來了互通性挑戰,這使得能夠為社區銀行簡化支付流程的編配平台更具優勢。
引進基於垂直產業SaaS平台的嵌入式金融
隨著支付和貸款成為內建功能,垂直產業軟體供應商的收入成長了3-4倍,其策略重點也從授權轉向交易經濟效益。銀行即服務 (BaaS)仲介業者正在填補監管空白,但美國貨幣監理署 (OCC) 和聯邦存款保險公司 (FDIC) 於2024年7月發布的新指南增加了發起銀行的實質審查成本。像 Temenos 這樣的現有核心銀行系統供應商已收購美國 BaaS 營運商的少數股權,以加快產品上市速度,而不是從零開始建立技術堆疊。德賓修正條款的互換費率上限激勵小規模的區域性銀行與 SaaS 平台合作,在分散其與發卡機構關係的同時,拓寬其服務範圍。 ISO 20022 資料標準將進一步增強這些垂直整合生態系中內建的對帳模組和動態定價功能。
聯邦和州級法規的碎片化增加了合規負擔。
金融科技公司必須遵守美國50個州的匯款監管規定以及重疊的聯邦監管,這增加了法律成本並延緩了產品發布。 2024年7月,美國貨幣監理署(OCC)和聯邦存款保險公司(FDIC)聯合發布的指導意見對銀行即服務(BaaS)銀行施加了更嚴格的供應商管理規則,導致一些金融科技發起人暫停新客戶註冊,以加強其內部控制。早期Start-Ups可能需要將營運預算的20%用於反洗錢/了解你的客戶(AML/KYC)要求,這限制了其進行創新嘗試,並有利於資金雄厚的現有企業。消費者金融保護局(CFPB)可能就詐騙損失責任分配採取的行動,進一步增加了不確定性。所有這些因素綜合起來,可能會限制美國金融科技市場在短期內的擴張。
細分市場分析
到2025年,數位支付將占美國金融科技市場的46.78%,反映出銀行卡、電子錢包和帳戶間轉帳等支付方式在廣大消費者和商家中的廣泛應用。儘管目前規模較小,但受分店經營模式降低服務成本以及提案免手續費儲蓄帳戶等因素的推動,預計到2031年,新銀行業務將以21.05%的複合年成長率成長。因此,美國新銀行金融科技市場的規模預計將顯著擴大,即使在資本市場趨緊的情況下,也能吸引投資者的目光。
交叉銷售正在擴張:支付SaaS供應商正在整合短期貸款和財務管理工具,將多種服務整合到單一工作流程中。數位貸款和融資保持著26.92%的健康市場佔有率,這主要得益於人工智慧篩選,它可以更快地審查信用記錄不良的借款人。由於股本監管的限制,保險科技的市場佔有率保持在7.36%,但基於使用量的汽車保險和嵌入式旅遊保險表明,它們已與支付管道整合。數位投資佔比4.89%,在高盛退出純粹的智慧投顧業務後,該領域正在整合。現有企業正在利用全通路分銷來保住資產。這種重疊表明,所有提案最終都在爭奪美國金融科技市場的佔有率。
其他福利:
- Excel格式的市場預測(ME)表
- 分析師支持(3個月)
目錄
第1章 引言
- 研究假設和市場定義
- 調查範圍
第2章調查方法
第3章執行摘要
第4章 市場情勢
- 市場概覽
- 市場促進因素
- 即時支付(FedNow、RTP)的引入將有助於加速數位化。
- 垂直SaaS平台中嵌入式金融的普遍性
- 行動錢包和非接觸式支付在各年齡層的普及
- 透過基於人工智慧/機器學習的信用和詐欺檢測模型改善風險經濟學
- 「金融基礎設施即程式碼」開放原始碼堆疊顯著縮短了產品上市時間
- 美國兆豐銀行試行代幣化存款和可程式設計貨幣
- 市場限制
- 聯邦和州級法規的碎片化增加了合規負擔。
- 即時支付系統中的詐騙和網路安全成本飆升
- 從2022年起,資金籌措和估值壓縮將持續存在
- 加強OCC/FDIC對發起銀行附屬機構的監管
- 價值/供應鏈分析
- 監管環境
- 技術展望
- 波特五力模型
- 新進入者的威脅
- 供應商的議價能力
- 買方的議價能力
- 替代品的威脅
- 競爭對手之間的競爭
第5章 市場規模與成長預測
- 透過服務提案
- 數位支付
- 數字借貸和資金籌措
- 數位投資
- 保險科技
- 新銀行
- 最終用戶
- 零售
- 公司
- 透過使用者介面
- 行動應用
- 網頁/瀏覽器
- POS/物聯網設備
- 按地區
- 東北
- 中西部
- 南部
- 西
第6章 競爭情勢
- 市場集中度
- 策略趨勢
- 市佔率分析
- 公司簡介
- PayPal
- Stripe
- Block(Square & Cash App)
- Intuit(QuickBooks/Credit Karma)
- Chime
- SoFi
- Affirm
- Coinbase
- Robinhood
- Fiserv
- FIS
- Plaid
- Adyen
- Wise
- Klarna
- Varo Bank
- Upgrade
- Marqeta
- Navy Federal Credit Union(digital lending)
- Green Dot
第7章 市場機會與未來展望
The United States fintech market size in 2026 is estimated at USD 66.82 billion, growing from 2025 value of USD 58.01 billion with 2031 projections showing USD 135.42 billion, growing at 15.18% CAGR over 2026-2031.
A combination of nationwide real-time payment infrastructure, embedded finance adoption, and artificial-intelligence-driven risk tools is reshaping customer expectations and forcing incumbents to modernize. Venture capital investment has begun to recover from the 2024 trough, yet regulatory scrutiny of bank-fintech partnerships remains intense, influencing how quickly new products reach the market. Regionally, the United States fintech market continues to benefit from the West's technology ecosystem, even as the South records the fastest growth due to lower operating costs and supportive state policies. Competitive intensity is moderate because no single firm exceeds a double-digit share, leaving space for vertical specialists and community-bank-backed platforms to thrive.
United States Fintech Market Trends and Insights
Real-Time Payments Rollout Accelerates Digital Adoption
FedNow expanded from 35 launch banks to more than 1,300 institutions by August 2024, illustrating how public infrastructure can overcome network-effect barriers. The USD 500,000 transaction ceiling attracts commercial flows that once relied on wires. Concurrently, The Clearing House's RTP network processed 87 million transfers worth USD 69 billion in Q3 2024, growing about 17% quarter-over-quarter. Fintech providers leverage these rails to offer instant bill pay and earned-wage access, boosting daily active users. Yet the proliferation of multiple instant-payment schemes raises interoperability challenges that favor orchestration platforms able to abstract settlement complexity for community banks.
Embedded Finance Uptake by Vertical SaaS Platforms
Vertical software vendors now generate three-to-four times more revenue once payments and lending become embedded features, shifting their strategic focus from licensing fees to transaction economics. Banking-as-a-Service (BaaS) intermediaries fill regulatory gaps, though new OCC and FDIC guidance issued in July 2024 elevates due-diligence costs for sponsor banks. Established core-banking providers such as Temenos took minority stakes in U.S. BaaS players to accelerate time-to-market instead of rebuilding tech stacks from scratch. Interchange caps under the Durbin Amendment incentivize smaller community banks to partner with SaaS platforms, fragmenting issuer relationships but broadening service reach. ISO 20022 data standards further enhance reconciliation and dynamic pricing modules embedded within these vertical ecosystems.
Fragmented Federal & State Regulation Raises Compliance Burden
Fintech firms must navigate 50 state money-transmitter regimes plus overlapping federal oversight, which increases legal costs and lengthens product launches. The July 2024 OCC-FDIC guidance imposed stronger vendor-management rules on BaaS banks, prompting several fintech sponsors to pause onboarding while they upgrade controls. Early-stage startups may spend 20% of operating budgets on AML/KYC requirements, limiting experimentation and favoring well-capitalized incumbents. Potential CFPB action on liability sharing for scam losses adds another layer of uncertainty. Collectively, these factors moderate the near-term expansion pace of the United States fintech market.
Other drivers and restraints analyzed in the detailed report include:
- Mobile Wallet & Contactless Penetration Across Demographics
- AI/ML-Driven Credit & Fraud Models Improve Risk Economics
- Escalating Fraud & Cybersecurity Costs in Real-Time Rails
For complete list of drivers and restraints, kindly check the Table Of Contents.
Segment Analysis
Digital Payments controlled 46.78% of the United States fintech market in 2025, reflecting broad consumer and merchant acceptance across cards, wallets, and account-to-account rails. Neobanking, while smaller, is projected to grow at a 21.05% CAGR through 2031, underpinned by branch-free models that reduce cost-to-serve and enable fee-free checking propositions. The United States fintech market size for Neobanking is therefore expected to widen considerably, attracting investors despite tighter capital markets.
Cross-selling is increasing: payment-facilitating SaaS vendors now embed short-term lending and treasury tools, weaving multiple propositions into a single workflow. Digital Lending & Financing maintains a healthy 26.92% share, aided by AI underwriting that speeds decisions for thin-file borrowers. Insurtech accounts for only 7.36% because of capital adequacy rules, yet its usage-based auto and embedded travel policies illustrate convergence with payment channels. Digital Investments, at 4.89%, is consolidating after Goldman Sachs exited pure robo-advice; incumbents leverage omnichannel distribution to hold assets. These overlaps illustrate how every proposition ultimately competes for wallet share within the United States fintech market.
The United States Fintech Market Report is Segmented by Service Proposition (Digital Payments, Digital Lending & Financing, Digital Investments, Insurtech, Neobanking), End-User (Retail, Businesses), User Interface (Mobile Applications, Web/Browser, POS/IoT Devices), and Geography (Northeast, Midwest, South, West). The Market Forecasts are Provided in Terms of Value (USD).
List of Companies Covered in this Report:
- PayPal
- Stripe
- Block (Square & Cash App)
- Intuit (QuickBooks / Credit Karma)
- Chime
- SoFi
- Affirm
- Coinbase
- Robinhood
- Fiserv
- FIS
- Plaid
- Adyen
- Wise
- Klarna
- Varo Bank
- Upgrade
- Marqeta
- Navy Federal Credit Union (digital lending)
- Green Dot
Additional Benefits:
- The market estimate (ME) sheet in Excel format
- 3 months of analyst support
TABLE OF CONTENTS
1 Introduction
- 1.1 Study Assumptions & Market Definition
- 1.2 Scope of the Study
2 Research Methodology
3 Executive Summary
4 Market Landscape
- 4.1 Market Overview
- 4.2 Market Drivers
- 4.2.1 Real-time payments (FedNow, RTP) rollout accelerates digital adoption
- 4.2.2 Embedded finance uptake by vertical SaaS platforms
- 4.2.3 Mobile wallet & contactless penetration across demographics
- 4.2.4 AI/ML-driven credit & fraud models improve risk economics
- 4.2.5 "Fin-infra-as-code" open-source stacks slash go-to-market time
- 4.2.6 Tokenised deposits & programmable money pilots by U.S. megabanks
- 4.3 Market Restraints
- 4.3.1 Fragmented federal & state regulation raises compliance burden
- 4.3.2 Escalating fraud & cybersecurity costs in real-time rails
- 4.3.3 Funding pull-back & valuation compression post-2022
- 4.3.4 Heightened OCC/FDIC scrutiny of sponsor-bank partnerships
- 4.4 Value / Supply-Chain Analysis
- 4.5 Regulatory Landscape
- 4.6 Technological Outlook
- 4.7 Porter's Five Forces
- 4.7.1 Threat of New Entrants
- 4.7.2 Bargaining Power of Suppliers
- 4.7.3 Bargaining Power of Buyers
- 4.7.4 Threat of Substitutes
- 4.7.5 Competitive Rivalry
5 Market Size & Growth Forecasts
- 5.1 By Service Proposition
- 5.1.1 Digital Payments
- 5.1.2 Digital Lending & Financing
- 5.1.3 Digital Investments
- 5.1.4 Insurtech
- 5.1.5 Neobanking
- 5.2 By End-User
- 5.2.1 Retail
- 5.2.2 Businesses
- 5.3 By User Interface
- 5.3.1 Mobile Applications
- 5.3.2 Web / Browser
- 5.3.3 POS / IoT Devices
- 5.4 By Geography
- 5.4.1 Northeast
- 5.4.2 Midwest
- 5.4.3 South
- 5.4.4 West
6 Competitive Landscape
- 6.1 Market Concentration
- 6.2 Strategic Moves
- 6.3 Market Share Analysis
- 6.4 Company Profiles (includes Global level Overview, Market level overview, Core Segments, Financials as available, Strategic Information, Market Rank/Share, Products & Services, Recent Developments)
- 6.4.1 PayPal
- 6.4.2 Stripe
- 6.4.3 Block (Square & Cash App)
- 6.4.4 Intuit (QuickBooks / Credit Karma)
- 6.4.5 Chime
- 6.4.6 SoFi
- 6.4.7 Affirm
- 6.4.8 Coinbase
- 6.4.9 Robinhood
- 6.4.10 Fiserv
- 6.4.11 FIS
- 6.4.12 Plaid
- 6.4.13 Adyen
- 6.4.14 Wise
- 6.4.15 Klarna
- 6.4.16 Varo Bank
- 6.4.17 Upgrade
- 6.4.18 Marqeta
- 6.4.19 Navy Federal Credit Union (digital lending)
- 6.4.20 Green Dot
7 Market Opportunities & Future Outlook
- 7.1 SME real-time treasury & payables orchestration platforms
- 7.2 Shared synthetic-identity sandbox for secure bank-fintech data exchange
 金融科技市場商業分析及預測(至2035年):類型、產品類型、服務、技術、組件、應用、部署模式、最終用戶、解決方案
 2026年金融科技多重雲端全球市場報告
 金融科技市場規模、佔有率、趨勢和預測:按部署類型、技術、應用、最終用戶和地區分類,2026-2034 年
 2026-2030年全球金融科技市場金融科技市場分析及預測(至2035年):依類型、產品類型、服務、技術、組件、應用、部署類型、最終用戶及功能分類
 英國金融科技:市場佔有率分析、產業趨勢與統計、成長預測(2026-2031)
 全球金融科技即服務 (FaaS) 市場規模、佔有率、趨勢和成長分析報告,2026-2034 年金融科技市場規模、佔有率、成長及全球產業分析:按類型、應用和地區的洞察,2026-2034年預測日本金融科技市場報告:依採用類型、技術、應用、最終用戶和地區分類(2026-2034年)
 金融科技領域生成式人工智慧市場-全球產業規模、佔有率、趨勢、機會及預測(按組件、部署、應用、地區和競爭格局分類,2021-2031年)