


 |
市場調查報告書
商品編碼
1911758
馬來西亞資料中心:市場佔有率分析、產業趨勢與統計、成長預測(2026-2031)Malaysia Data Center - Market Share Analysis, Industry Trends & Statistics, Growth Forecasts (2026 - 2031) |
||||||
※ 本網頁內容可能與最新版本有所差異。詳細情況請與我們聯繫。
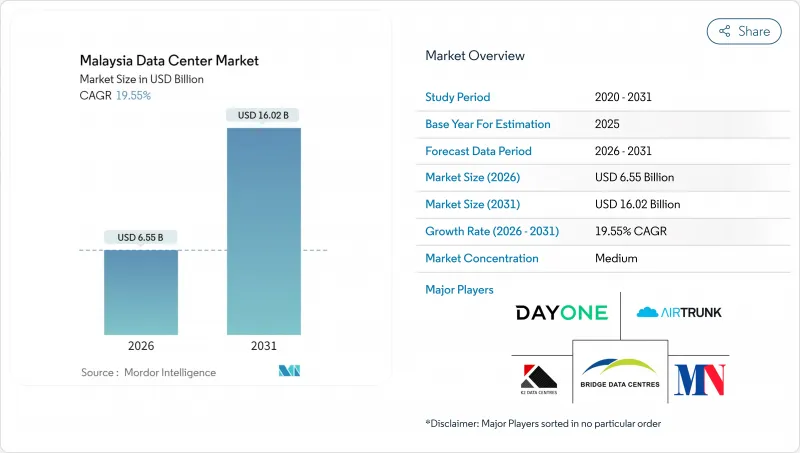
馬來西亞資料中心市場在 2025 年的價值為 54.8 億美元,預計到 2031 年將達到 160.2 億美元,高於 2026 年的 65.5 億美元。
預計在預測期(2026-2031 年)內,複合年成長率將達到 19.55%。
電力需求將成長得更快,IT負載容量預計將從1.53吉瓦飆升至6.43吉瓦,複合年成長率高達33.24%,主要得益於人工智慧工作負載推動的機架密度增加。市場佔有率和估計值均以兆瓦(MW)為單位計算和報告。政府激勵措施、超大規模資料中心業者資料中心902億馬幣(203億美元)的投資承諾以及海底電纜的增加,正在鞏固馬來西亞作為東南亞新興數位中心的地位。新山正在吸收新加坡溢出的需求,而賽城則受益於多媒體超級走廊的基礎建設。營運商正面臨電費上漲和供水限制的雙重挑戰,因此必須制定可再生能源籌資策略。
馬來西亞資料中心市場趨勢與洞察
超大規模雲端採用率上升
谷歌斥資20億美元的區域中心、Oracle65億美元的計畫以及微軟22億美元的擴建項目,正透過將機架功率密度推至15kW以上,重新定義容量需求。這些大型企劃需要專用冷卻系統、冗餘變電站和高速互連,而這些在傳統的託管設施中難以實現。楊忠禮集團(YTL)與英偉達(NVIDIA)價值馬幣令吉(約22.5億美元)的合作,標誌著國內業者正向人工智慧賦能的園區轉型。隨著柔佛州和森美蘭州業者對海底電纜直接連接站點的競爭加劇,土地和電力採購週期也日益緊張。建築供應鏈正在擴展以適應超大規模資料中心業者的設計標準,這為本地工程、採購和施工(EPC)公司創造了機會。長期合約也保障了可再生能源的需求,加速了國內太陽能發電設施的擴張。
金融科技和電子商務數位化正在蓬勃發展
Touch 'n Go 電子錢包、DuitNow 以及區域跨境支付方案需要亞毫秒級的處理速度,而傳統銀行資料中心無法滿足這項需求。到 2023 年,數位錢包將佔線上交易的 39%,這將推動對可擴展計算和即時詐欺檢測節點的需求。隨著第三方金融科技應用的激增,開放銀行 API 也進一步推動了流量的激增。吉隆坡和檳城的邊緣設施降低了人口密集城區的延遲,而柔佛州的災害復原節點則確保了符合馬來西亞國家銀行的彈性準則。不斷成長的電子商務基礎正推動企業轉向雲端原生架構,進一步鞏固了馬來西亞資料中心市場的上升趨勢。
電費波動加劇
2024年的收費系統調整導致工業電費上漲14.2%,其中資料中心等超高壓用戶受到的影響最大。取消補貼意味著電價現在與天然氣價格掛鉤,使業者面臨大宗商品市場波動的風險。可再生能源供應難以滿足需求,導致現貨價格居高不下。營運商正透過現場太陽能和電池計劃進行對沖,但資本支出不斷增加,計劃工期也在延長。關於未來電價上漲的合約條款模糊不清,也使超大規模資料中心業者的整體擁有成本(TCO)模型變得更加複雜。
細分市場分析
預計中型資料中心將於2026年投入運營,年複合成長率將達到30.20%,成長超過其他規模的資料中心,因為企業和內容供應商都在尋求邊緣面積友善的資料中心佈局,以支援區域5G網路的部署。大型資料中心佔馬來西亞資料中心市場佔有率的24.18%,主要得益於超大規模資料中心業者資料中心營運商預租20-50兆瓦的電力單元。小規模資料中心將專注於災害復原應用,而超大型和巨型資料中心園區將滿足人工智慧訓練的需求。
馬來西亞資料中心市場青睞模組化建設,允許以4-6兆瓦為單位逐步增加容量,使營運商能夠有效管理資本投資。中型資料中心採用節熱器冷卻技術,將電源使用效率(PUE)降低至1.3,達到綠色稅優惠的閾值。大型資料中心在海底電纜站附近仍有優勢,因為那裡有足夠的土地建造100兆瓦的變電站。電網容量的限制限制著大型資料中心園區的發展,但即將進行的132千伏特電網升級預計將在未來擴大電力供應。
到2025年,三級服務將佔總營收的75.88%,維持34.10%的複合年成長率,成為成長最快的服務商,這印證了企業在無需支付四級服務溢價的情況下,仍能獲得並發維護能力的偏好。隨著中小企業轉向雲端服務和託管平台,一級和二級服務的面積正在萎縮。
營運商正透過增加冗餘配電路徑和柴油旋轉式UPS系統,將二級資料中心維修到三級,從而提高機架容量。金融和電子商務工作負載需要99.982%的可用性,符合三級標準。馬來西亞通訊和多媒體委員會的監管指南強化了這項用於關鍵數據在地化的中級標準。四級資料中心目前仍主要面向核心銀行和國防工作負載,但新建設的成本阻礙了其廣泛應用。
馬來西亞資料中心市場報告按資料中心規模(大型、超大型、中型、巨型、小規模)、等級(Tier 1-2、Tier 3、Tier 4)、資料中心類型(超大規模/自建、企業/邊緣、託管)、最終用戶(銀行、金融服務和保險 (BFSI)、IT 和 ITES、電子商務、政府等)以及賽城熱點(吉隆坡、金融服務等)進行細分。市場預測以 IT 負載容量(兆瓦)為單位。
其他福利:
- Excel格式的市場預測(ME)表
- 3個月的分析師支持
目錄
第1章 引言
- 研究假設和市場定義
- 調查範圍
第2章調查方法
第3章執行摘要
第4章 市場情勢
- 市場概覽
- 市場促進因素
- 超大規模雲端採用率上升
- 金融科技與電子商務數位化浪潮
- 快速部署海底電纜可改善網路連接
- 政府為綠色資訊通訊技術投資提供稅收優惠
- 檳城-柔佛工業走廊的需求優勢
- 規模達100-200兆瓦的領先人工智慧培訓叢集園區
- 市場限制
- 電費波動劇烈
- 漫長的三級/四級審核週期
- 馬來西亞缺乏低碳電力購電協議
- 認證執行時間工程師短缺
- 市場展望
- IT負載能力
- 高架樓層面積
- 託管收入
- 預裝機架
- 機架空間利用率
- 海底電纜
- 主要行業趨勢
- 智慧型手機用戶數量
- 每部智慧型手機的數據流量
- 行動資料通訊速度
- 寬頻資料通訊速度
- 光纖連接網路
- 法律規範
- 價值鍊和通路分析
- 波特五力分析
- 新進入者的威脅
- 供應商的議價能力
- 買方的議價能力
- 替代品的威脅
- 競爭對手之間的競爭
第5章 市場規模及成長預測(兆瓦)
- 按資料中心規模
- 大規模
- 大規模
- 中號
- 百萬
- 小規模
- 依層級類型
- 一級和二級
- 三級
- 第四級
- 依資料中心類型
- 超大規模/內部建設
- 企業/邊緣運算
- 搭配
- 未使用的
- 運作中
- 零售共址
- 批發託管
- 最終用戶
- BFSI
- 資訊科技與資訊科技服務
- 電子商務
- 政府機構
- 製造業
- 媒體與娛樂
- 溝通
- 其他最終用戶
- 透過熱點
- 吉隆坡
- 賽城
- 新山
- 馬來西亞其他地區
第6章 競爭情勢
- 市場集中度
- 策略趨勢
- 市佔率分析
- 公司簡介
- Bridge Data Centers(Chindata Group)
- MN Holdings Bhd(in partnership with Shanghai DC-Science Co Ltd.)
- DayOne(GDS Holdings Ltd.)
- K2 Strategic(Kuok Group)
- AirTrunk Operating Pty Ltd.
- AIMS Data Centre Sdn. Bhd.(DigitalBridge Group, Inc.)
- Telekom Malaysia Berhad
- NTT Ltd.
- CSF Group
- Alibaba Cloud
- Keppel Data Center
- Open DC Sdn Bhd
- SAP SE
- Vantage Data Centers
- Telstra Group Limited
第7章 市場機會與未來展望
The Malaysia data center market was valued at USD 5.48 billion in 2025 and estimated to grow from USD 6.55 billion in 2026 to reach USD 16.02 billion by 2031, at a CAGR of 19.55% during the forecast period (2026-2031).
Power demand rises even faster, with IT load capacity projected to jump from 1.53 GW to 6.43 GW, a 33.24% CAGR, as artificial-intelligence workloads drive higher rack densities. The market segment shares and estimates are calculated and reported in terms of MW. Government incentives, hyperscaler commitments of MYR 90.2 billion (USD 20.3 billion), and submarine-cable additions reinforce Malaysia's status as Southeast Asia's new digital hub. Johor Bahru captures Singapore overflow demand while Cyberjaya benefits from the Multimedia Super Corridor infrastructure. Operators confront rising electricity tariffs and water supply constraints, prompting the need for renewable energy procurement strategies.
Malaysia Data Center Market Trends and Insights
Rising hyperscale cloud deployments
Google's USD 2 billion region, Oracle's USD 6.5 billion plan, and Microsoft's USD 2.2 billion expansion redefine capacity needs by pushing rack power densities beyond 15 kW. These mega-projects require specialized cooling, redundant substations, and high-speed interconnection, which traditional colocation facilities seldom offer. YTL's MYR 10 billion (USD 2.25 billion) NVIDIA alliance signals a shift among domestic players toward AI-ready campuses. Land and power procurement cycles are tightening as operators compete for sites in Johor and Negeri Sembilan with direct submarine cable access. The construction supply chain scales up to meet hyperscaler design standards, opening opportunities for local engineering, procurement, and construction firms. Long-term contracts also lock in renewable energy demand, which accelerates the national solar build-out.
Surge in FinTech and e-commerce digitalization
Touch 'n Go eWallet, DuitNow, and regional cross-border payment schemes require sub-millisecond processing that legacy bank data centers cannot sustain. Digital wallets captured 39% of online-transaction volume in 2023, amplifying demand for scalable compute and real-time fraud analytics nodes. Open-banking APIs further intensify traffic spikes as third-party fintech applications proliferate. Edge facilities in Kuala Lumpur and Penang shorten latency for densely populated urban centers, while disaster-recovery nodes in Johor ensure compliance with Bank Negara Malaysia's resilience guidelines. The expanding e-commerce base is pushing merchants toward cloud-native architectures, reinforcing the upward trend in the Malaysian data center market.
High electricity tariff volatility
Tariff restructuring increased industrial rates by 14.2% in 2024, with ultra-high-voltage users, such as data centers, being hit hardest. Subsidy removal ties prices to natural-gas benchmarks, exposing operators to fluctuations in the commodity market. Renewable supply lags demand, keeping spot prices elevated. Operators hedge through on-site solar and battery-storage projects, but capital expenditure rises and project timelines lengthen. Contract ambiguity around future tariff escalations complicates hyperscaler total-cost-of-ownership models.
Other drivers and restraints analyzed in the detailed report include:
- Rapid submarine-cable landings boosting connectivity
- Shortage of accredited Uptime-qualified engineers
For complete list of drivers and restraints, kindly check the Table Of Contents.
Segment Analysis
Medium facilities are expected to open in 2026 with a 30.20% CAGR forecast, outpacing other tiers as enterprises and content providers seek edge-appropriate footprints that support regional 5G rollouts. Large facilities account for 24.18% of Malaysia's data center market share, driven by hyperscaler pre-lease commitments that secure power blocks of 20-50 MW. Small sites specialize in disaster-recovery niches, while mega and massive campuses cater to AI training needs.
The Malaysian data center market favors modular builds that add capacity in 4-6 MW increments, allowing operators to manage capital deployment effectively. Medium halls integrate economizer cooling, cutting power usage effectiveness to 1.3 and meeting green tax incentive thresholds. Large-site dominance persists near submarine cable stations, where land parcels can accommodate 100 MW substations. Power-grid constraints cap mega-campus growth, but upcoming 132 kV upgrades may unlock future supply.
Tier 3 captured 75.88% of the revenue in 2025 and maintains the top growth rate at a 34.10% CAGR, confirming enterprises' preference for concurrent maintainability without Tier 4 premiums. Tier 1-2 footprints shrink as SMEs migrate to cloud and colocation platforms.
Operators retrofit Tier 2 sites to Tier 3 by adding redundant distribution paths and diesel-rotary UPS systems, unlocking higher rack rates. Financial and e-commerce workloads demand 99.982% availability, aligning with Tier 3 specifications. Regulatory guidance from the Malaysian Communications and Multimedia Commission reinforces this mid-tier standard for the localization of critical data. Tier 4 remains a niche for core banking and defense workloads, but new-build economics deter widespread adoption.
The Malaysia Data Center Market Report is Segmented by Data Center Size (Large, Massive, Medium, Mega, and Small), Tier Type (Tier 1 and 2, Tier 3, and Tier 4), Data Center Type (Hyperscale/Self-built, Enterprise/Edge, and Colocation), End User (BFSI, IT and ITES, E-Commerce, Government, and More), and Hotspot (Kuala Lumpur, Cyberjaya, and More). The Market Forecasts are Provided in Terms of IT Load Capacity (MW).
List of Companies Covered in this Report:
- Bridge Data Centers (Chindata Group)
- MN Holdings Bhd (in partnership with Shanghai DC-Science Co Ltd.)
- DayOne (GDS Holdings Ltd.)
- K2 Strategic (Kuok Group)
- AirTrunk Operating Pty Ltd.
- AIMS Data Centre Sdn. Bhd. (DigitalBridge Group, Inc.)
- Telekom Malaysia Berhad
- NTT Ltd.
- CSF Group
- Alibaba Cloud
- Keppel Data Center
- Open DC Sdn Bhd
- SAP SE
- Vantage Data Centers
- Telstra Group Limited
Additional Benefits:
- The market estimate (ME) sheet in Excel format
- 3 months of analyst support
TABLE OF CONTENTS
1 INTRODUCTION
- 1.1 Study Assumptions and Market Definition
- 1.2 Scope of the Study
2 RESEARCH METHODOLOGY
3 EXECUTIVE SUMMARY
4 MARKET LANDSCAPE
- 4.1 Market Overview
- 4.2 Market Drivers
- 4.2.1 Rising hyperscale cloud deployments
- 4.2.2 Surge in FinTech and e-commerce digitalization
- 4.2.3 Rapid submarine cable landings boosting connectivity
- 4.2.4 Government tax incentives for green ICT investments
- 4.2.5 Penang-Johor industrial corridor edge demand
- 4.2.6 AI training clusters driving 100-200 MW campuses
- 4.3 Market Restraints
- 4.3.1 High electricity tariff volatility
- 4.3.2 Lengthy Tier 3/Tier 4 approval cycles
- 4.3.3 Scarcity of low-carbon power PPAs in Malaysia
- 4.3.4 Shortage of accredited Uptime-qualified engineers
- 4.4 Market Outlook
- 4.4.1 IT Load Capacity
- 4.4.2 Raised Floor Space
- 4.4.3 Colocation Revenue
- 4.4.4 Installed Racks
- 4.4.5 Rack Space Utilization
- 4.4.6 Submarine Cable
- 4.5 Key Industry Trends
- 4.5.1 Smartphone Users
- 4.5.2 Data Traffic Per Smartphone
- 4.5.3 Mobile Data Speed
- 4.5.4 Broadband Data Speed
- 4.5.5 Fiber Connectivity Network
- 4.5.6 Regulatory Framework
- 4.6 Value Chain and Distribution Channel Analysis
- 4.7 Porter's Five Forces Analysis
- 4.7.1 Threat of New Entrants
- 4.7.2 Bargaining Power of Suppliers
- 4.7.3 Bargaining Power of Buyers
- 4.7.4 Threat of Substitutes
- 4.7.5 Competitive Rivalry
5 MARKET SIZE AND GROWTH FORECASTS (MEGAWATT)
- 5.1 By Data Center Size
- 5.1.1 Large
- 5.1.2 Massive
- 5.1.3 Medium
- 5.1.4 Mega
- 5.1.5 Small
- 5.2 By Tier Type
- 5.2.1 Tier 1 and 2
- 5.2.2 Tier 3
- 5.2.3 Tier 4
- 5.3 By Data Center Type
- 5.3.1 Hyperscale/Self-built
- 5.3.2 Enterprise/Edge
- 5.3.3 Colocation
- 5.3.3.1 Non-Utilized
- 5.3.3.2 Utilized
- 5.3.3.2.1 Retail Colocation
- 5.3.3.2.2 Wholesale Colocation
- 5.4 By End User
- 5.4.1 BFSI
- 5.4.2 IT and ITES
- 5.4.3 E-Commerce
- 5.4.4 Government
- 5.4.5 Manufacturing
- 5.4.6 Media and Entertainment
- 5.4.7 Telecom
- 5.4.8 Other End Users
- 5.5 By Hotspot
- 5.5.1 Kuala Lumpur
- 5.5.2 Cyberjaya
- 5.5.3 Johor Bahru
- 5.5.4 Rest of Malaysia
6 COMPETITIVE LANDSCAPE
- 6.1 Market Concentration
- 6.2 Strategic Moves
- 6.3 Market Share Analysis
- 6.4 Company Profiles (includes Global level Overview, Market level overview, Core Segments, Financials as available, Strategic Information, Market Rank/Share for key companies, Products and Services, and Recent Developments)
- 6.4.1 Bridge Data Centers (Chindata Group)
- 6.4.2 MN Holdings Bhd (in partnership with Shanghai DC-Science Co Ltd.)
- 6.4.3 DayOne (GDS Holdings Ltd.)
- 6.4.4 K2 Strategic (Kuok Group)
- 6.4.5 AirTrunk Operating Pty Ltd.
- 6.4.6 AIMS Data Centre Sdn. Bhd. (DigitalBridge Group, Inc.)
- 6.4.7 Telekom Malaysia Berhad
- 6.4.8 NTT Ltd.
- 6.4.9 CSF Group
- 6.4.10 Alibaba Cloud
- 6.4.11 Keppel Data Center
- 6.4.12 Open DC Sdn Bhd
- 6.4.13 SAP SE
- 6.4.14 Vantage Data Centers
- 6.4.15 Telstra Group Limited
7 MARKET OPPORTUNITIES AND FUTURE OUTLOOK
- 7.1 White-space and Unmet-need Assessment
 2026年全球光纖連接服務工具市場報告2026年全球行動雙倍數據速率(DDR)市場報告
 永續資料中心市場預測至2034年-全球分析(按組件、資料中心類型、容量、部署模式、永續發展舉措、冷卻技術、最終用戶和地區分類)
 2026-2030年全球資料中心市場
 全球資料中心市場:市場規模、佔有率、趨勢和成長分析(2026-2034 年)2026年全球智慧客戶資料中心市場報告2026年全球網路資料中心(IDC)市場報告2026年全球資料中心房地產市場報告
 資料中心市場:按組件、資料中心類型、層級、冷卻方式、電源、最終用戶和組織規模分類-2026年至2032年全球市場預測全球在軌資料中心市場預測(至2034年)-按平台、組件、系統、連接類型、應用、最終用戶和地區分類的分析