


 |
市場調查報告書
商品編碼
1911744
電動自行車:市場佔有率分析、產業趨勢與統計、成長預測(2026-2031)E-Bike - Market Share Analysis, Industry Trends & Statistics, Growth Forecasts (2026 - 2031) |
||||||
※ 本網頁內容可能與最新版本有所差異。詳細情況請與我們聯繫。
預計到 2026 年,電動自行車市場價值將達到 394.2 億美元,高於 2025 年的 380.8 億美元。
預計到 2031 年將達到 468.6 億美元,2026 年至 2031 年的複合年成長率為 3.52%。
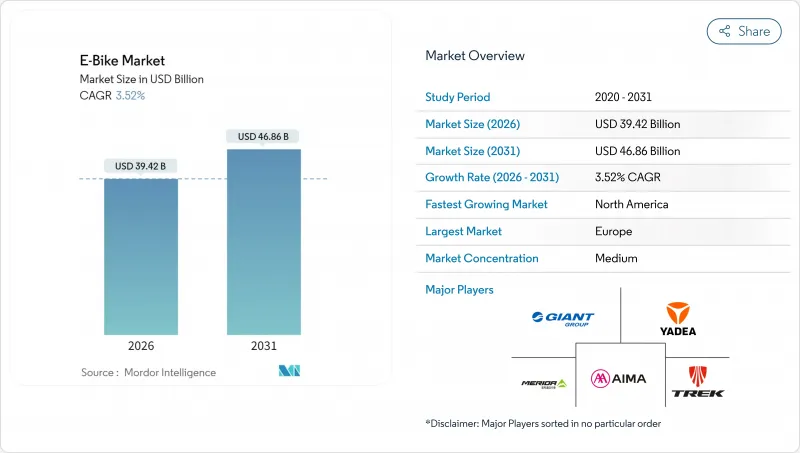
這種穩定擴張反映了自行車市場從早期採用階段向主流應用階段的轉變,主要得益於企業租賃計劃的推動,這些計劃允許員工透過工資扣除的方式租用自行車。市場需求正轉向價格在3500至5999美元之間的高階車型,該價格區間成長最為迅速。同時,諸如法國4,000歐元(約4,622美元)的補貼和波蘭3億波幣(約8,100萬美元)的補貼計畫等定向補貼政策,持續擴大目標客群。電池技術仍然是關鍵,鋰離子電池仍佔據市場主導地位,但鈉離子電池和固體電池正在興起,以降低對中國原料供應的依賴風險。
全球電動自行車市場趨勢與洞察
都市區擁塞推動了微出行
在一線城市,停車位價格高達3萬美元,因此,對於5-15公里的短程通勤(佔都市區出行總量的40%)而言,電動自行車是一種經濟實惠的選擇。倫敦超低排放區(ULEZ)的擴大以及7,000英鎊(約9,319美元)的車輛報廢補貼,促使快遞公司紛紛採用電動自行車。同時,亞馬遜和谷歌等公司也為電動自行車提供月租補貼,以緩解停車難題並實現永續性目標。
鋰離子電池的能量密度和成本降低
自2010年以來,鋰離子電池組的價格已大幅下降,續航里程超過100公里的電動自行車售價現已低於2,000美元。快速充電設計可在30分鐘內充電至80%,為高運轉率的商業車隊部署鋪平了道路。鈉離子電池原型可望在成本降低30%的情況下實現相近的循環壽命,而固態電池技術藍圖的目標是到2028年將能量密度提高一倍。
電池起火和更嚴格的安全標準
2023年,紐約市共發生187起電動車火災,四年損失高達5.186億美元。加州SB 1271法案和UL 2849標準要求使用認證電池組,這將使每輛車的成本增加200至500美元。為了符合相關法規,製造商正在加大對溫度控管技術和遠距離診斷系統的投入。
細分市場分析
預計到2025年,助力型自行車將佔據78.90%的市場佔有率,這主要得益於歐盟法規將其歸類為自行車的有利條件。速度輔助型自行車(最高時速可達45公里/小時)正以4.02%的複合年成長率成長,這主要受人口密集城市通勤者對類似汽車出行速度的需求驅動。
製造商正在將人工智慧演算法整合到馬達控制器中,以便根據地形和騎乘習慣最佳化功率輸出。禧瑪諾即將發布的自動變速傳動系統就是一個很好的例子,它展示了供應商如何將高扭矩馬達與智慧變速箱相結合,以更好地吸引都市區白領。
由於城市自行車通勤輕鬆便捷,到 2025 年將佔據 76.05% 的市場。同時,隨著旅遊業者擴大將電動輔助車輛作為標準配置,旅行/山地車型將繼續以 3.65% 的複合年成長率成長。
業者認為,更廣泛的使用者群體、年齡較大的騎乘者以及不同體能水平的群體是關鍵的成長要素,隨著步道法規的演變,預計這群人將進一步滲透到國家公園和度假區。
到了2025年,鋰離子電池將佔據電動自行車市場98.41%的佔有率,這充分體現其成本競爭力和高能量密度。 「其他」類別(包括鈉離子電池和早期固態電池原型)正以4.32%的複合年成長率成長,因為各品牌都在尋求分散原料風險。
為了降低對中國加工環節的依賴,原始設備製造商(OEM)正同時購買方形和圓柱形電池。如果鈉離子電池在2027年之前實現價格競爭力,這種電池技術可望從傳統電池組中奪取兩位數的市場佔有率。
區域分析
到2025年,歐洲將佔全球電動自行車市場收入的54.80%。光是德國一國,電動自行車保有量就將達到1,570萬輛,2024年銷量預計為210萬輛,主要得益於多名員工的薪資扣除計畫。荷蘭各年齡層的電動自行車普及率已接近飽和,而法國為低收入者提供的4,000歐元(約4,622美元)補貼則持續吸引新用戶。完善的自行車道網路和以自行車為先的城市規劃將使歐洲保持永續的競爭優勢。
北美雖然目前規模較小,但卻是成長最快的地區,年複合成長率達7.19%。加州和紐約州提供的最高可達1,750美元的州政府補貼,加上企業補貼,正在刺激被壓抑的需求。加拿大正在投資4億加幣(約2.86億美元)建設基礎設施,連接電動自行車道和充電樁,為通勤者和外送騎手打造端到端的車隊。
亞太地區市場構成多元化。中國是美國電動自行車進口的主要供應國,並在2024年取得了顯著的出口收入。印度在2024年實現了電動二輪車的廣泛普及,儘管輕型機踏車仍然超過助力車型。日本和韓國專注於高科技產品,瞄準高階市場,而澳洲則利用生態旅遊路線來推動健行的需求。各地區的法規和收入水準決定了銷售管道、定價和規格策略的差異。
其他福利:
- Excel格式的市場預測(ME)表
- 3個月的分析師支持
目錄
第1章 引言
- 研究假設和市場定義
- 調查範圍
第2章調查方法
第3章執行摘要
第4章:主要產業趨勢
- 年度自行車銷售額
- 平均銷售價格和價格範圍構成
- 電動自行車及其零件的跨境貿易(進口/出口)
- 電動自行車佔自行車總銷量的百分比
- 單程通勤距離為 5-15 公里的通勤者比例 (%)
- 自行車/電動式自行車租賃市場規模
- 電動自行車電池組價格
- 電池化學價格比較
- 最後一公里(超本地化)配送量
- 受保護的自行車道(公里)
- 健行和戶外活動的參與率
- 電動自行車電池容量(瓦時)
- 都市交通壅塞指數
- 法律規範
- 電動自行車型式認證與認可
- 進出口和貿易法規
- 分類、道路使用和使用者規定
- 電池、充電器和充電安全
第5章 市場情勢
- 市場概覽
- 市場促進因素
- 都市區擁塞推動了微出行
- 鋰離子電池能量密度與成本降低趨勢
- 政府激勵措施和採購補貼
- 企業員工電動自行車福利計劃
- 貨運電動自行車保險費折扣
- 電動自行車旅遊路線的成長
- 市場限制
- 電池起火和更嚴格的安全標準
- 與傳統自行車相比,初始成本較高
- 發展中地區充電基礎設施不足
- 關鍵礦產供應波動性
- 價值/供應鏈分析
- 監管環境
- 技術展望
- 波特五力模型
- 新進入者的威脅
- 供應商的議價能力
- 買方的議價能力
- 替代品的威脅
- 競爭對手之間的競爭
第6章 市場規模及成長預測(價值及數量)
- 依推進類型
- 踏板輔助
- 速度踏板
- 油門輔助
- 按應用程式類型
- 貨物/多用途
- 城鎮/城市
- 健行/登山
- 依電池類型
- 鉛酸電池
- 鋰離子電池
- 其他
- 按下馬達安裝位置
- 輪轂(前/後)
- 中置馬達
- 透過驅動系統
- 鏈傳動
- 皮帶傳動
- 透過馬達輸出
- 小於250瓦
- 251~350 W
- 351~500 W
- 501~600 W
- 600瓦或以上
- 按價格範圍
- 不到1000美元
- 1,000-1,499 美元
- 1500-2499美元
- 2,500-3,499 美元
- 3,500 美元至 5,999 美元
- 超過6000美元
- 按銷售管道
- 線上
- 離線
- 按最終用途
- 商業航運
- 零售和商品分銷
- 食品和飲料配送
- 服務供應商
- 個人和家庭用途
- 公共利益
- 其他
- 商業航運
- 按地區
- 北美洲
- 美國
- 加拿大
- 北美其他地區
- 南美洲
- 阿根廷
- 巴西
- 南美洲其他地區
- 歐洲
- 德國
- 英國
- 法國
- 義大利
- 西班牙
- 荷蘭
- 奧地利
- 瑞典
- 瑞士
- 其他歐洲
- 亞太地區
- 中國
- 印度
- 日本
- 韓國
- 澳洲
- 紐西蘭
- 亞太其他地區
- 中東和非洲
- 沙烏地阿拉伯
- 阿拉伯聯合大公國
- 南非
- 其他中東和非洲地區
- 北美洲
第7章 競爭情勢
- 市場集中度
- 策略趨勢
- 市佔率分析
- 公司簡介
- Aima Technology Group Co., Ltd.
- Canyon Bicycles GmbH
- Fritzmeier Systems GmbH & Co. KG(M1 Sporttechnik)
- Giant Manufacturing Co., Ltd.
- Jiangsu Xinri E-Vehicle Co., Ltd.
- Luyuan Electric Vehicle Co., Ltd.
- Merida Industry Co., Ltd.
- Myvelo Co., Ltd.
- Rad Power Bikes Inc.
- Riese & Muller GmbH
- Pon Holdings BV
- Samchuly Bicycle
- Specialized Bicycle Components, Inc.
- Dongguan Tailing Electric Vehicle Co., Ltd
- Tianjin Fuji-Ta Bicycle Co., Ltd.
- Trek Bicycle Corporation
- VanMoof BV
- Yadea Group Holdings Ltd.
- Yamaha Motor Co., Ltd.
第8章:市場機會與未來展望
第9章:CEO們需要思考的關鍵策略問題
e-bike market size in 2026 is estimated at USD 39.42 billion, growing from 2025 value of USD 38.08 billion with 2031 projections showing USD 46.86 billion, growing at 3.52% CAGR over 2026-2031.
The measured expansion reflects the transition from early adoption to mainstream use as corporate leasing schemes now give employees access to salary-sacrifice bikes. Demand is tilting toward premium models priced USD 3,500-5,999, the fastest-growing band, while targeted subsidies-France's EUR 4,000 (~USD 4,622) incentive and Poland's PLN 300 million (~USD 81 million) program-continue to widen the addressable base. Battery technology remains a cornerstone; lithium-ion captures a major share, yet sodium-ion and solid-state chemistries are lining up to ease China-centric raw-material risk.
Global E-Bike Market Trends and Insights
Urban Congestion Driving Micro-Mobility
Parking spaces in tier-1 cities cost as high as USD 30,000, making e-bikes a cost-efficient commute tool over 5-15 km trips-the distance that accounts for 40% of urban journeys. London's ULEZ expansion, plus GBP 7,000 (~USD 9,319) scrappage grants, has accelerated uptake among couriers, while companies such as Amazon and Google subsidize monthly e-bike subscriptions to ease parking stress and hit sustainability targets .
Li-ion Battery Energy-Density and Cost Declines
Lithium-ion pack prices have declined significantly since 2010, moving 100+ km range bikes under the USD 2,000 mark. Fast-charge designs now reach 80% in 30 minutes, opening doors for high-utilization commercial fleets. Sodium-ion prototypes promise similar cycle life at 30% reduced cost, while solid-state roadmaps target 2X energy density by 2028.
Battery-Fire Incidents and Stricter Safety Norms
NYC recorded 187 e-mobility fires in 2023, lifting four-year costs to USD 518.6 million. California's SB 1271 and the UL 2849 standard now require certified packs, adding USD 200-500 per unit. Manufacturers are investing in thermal management and remote diagnostics to keep pace.
Other drivers and restraints analyzed in the detailed report include:
- Government Incentives and Purchase Subsidies
- Corporate Employee E-Bike Benefit Programs
- High Upfront Cost vs. Conventional Bikes
For complete list of drivers and restraints, kindly check the Table Of Contents.
Segment Analysis
The market size for pedal-assist models reached a commanding 78.90% share in 2025, benefiting from favorable EU regulations that classify them as bicycles. Speed-pedelec variants, offering assistance up to 45 km/h, are charting a 4.02% CAGR as commuters seek car-like travel times in dense cities.
Manufacturers are layering AI algorithms onto motor controllers to optimize output by terrain and rider habits. Shimano's forthcoming automatic-shift drivetrain illustrates how suppliers bundle smart gearboxes with high-torque motors, strengthening their appeal among urban professionals.
City/urban bikes generated 76.05% of the market share in 2025 as urban riders opted for sweat-free commuting. Trekking/mountain models, however, are advancing at 3.65% CAGR, spurred by tour operators that now default to e-assisted fleets.
Operators see expanded demographics, older cyclists and mixed-fitness groups, as key growth levers. As trail access rules evolve, the segment is poised for further penetration into national parks and resort destinations.
Lithium-ion cells controlled 98.41% of the e-bike market share in 2025, underlining cost leadership and energy density. The "Others" bucket, housing sodium-ion and early solid-state prototypes, is growing at 4.32% CAGR as brands hedge raw-material exposure.
OEMs are dual-sourcing prismatic and cylindrical formats to mitigate China-centric processing. Should sodium-ion hit expected price parity by 2027, the chemistry could siphon double-digit share from legacy packs.
The Global E-Bike Market Report is Segmented by Propulsion Type (Pedal Assisted, Speed Pedelec, and More), Application Type (Cargo/Utility, City/Urban, and More), Battery Type (Lead Acid Battery, Lithium-Ion Battery, and More), Motor Placement (Hub (Front/Rear), Mid-Drive), Drive Systems, Motor Power, Price Band, Sales Channel, End Use, and Geography. The Market Forecasts are Provided in Terms of Value (USD) and Volume (Units).
Geography Analysis
Europe retained 54.80% of the 2025 e-bike market revenue. Germany alone has 15.7 million units in circulation and sold 2.1 million in 2024, helped by salary-sacrifice programs covering several workers . The Netherlands shows saturation traits, with e-bikes normalized across age groups, while France's EUR 4,000 (~USD 4,622) low-income grant keeps funneling new buyers. Continuous path networks and bicycle-first urban planning remain Europe's durable competitive edge.
North America, though smaller today, is the quickest-growing region at 7.19% CAGR. State rebates of up to USD 1,750 in California and New York, alongside corporate stipends, are unlocking latent demand. Canada's CAD 400 million (~USD 286 million) infrastructure rollout links e-bike lanes to charging nodes, creating end-to-end fleets for commuters and delivery riders alike.
Asia-Pacific reflects a tapestry of conditions. China supplies a major share of e-bike imports in the United States and posted notable export receipts in 2024. India crossed a significant electric two-wheeler mark in 2024, though mopeds still outweigh pedal-assist formats. Japan and South Korea cater to premium, tech-heavy niches, while Australia leans on eco-tourism routes to lift trekking sales. Localized regulation and income profiles dictate tailored channel, price, and specification strategies.
- Aima Technology Group Co., Ltd.
- Canyon Bicycles GmbH
- Fritzmeier Systems GmbH & Co. KG (M1 Sporttechnik)
- Giant Manufacturing Co., Ltd.
- Jiangsu Xinri E-Vehicle Co., Ltd.
- Luyuan Electric Vehicle Co., Ltd.
- Merida Industry Co., Ltd.
- Myvelo Co., Ltd.
- Rad Power Bikes Inc.
- Riese & Muller GmbH
- Pon Holdings B.V.
- Samchuly Bicycle
- Specialized Bicycle Components, Inc.
- Dongguan Tailing Electric Vehicle Co., Ltd
- Tianjin Fuji-Ta Bicycle Co., Ltd.
- Trek Bicycle Corporation
- VanMoof BV
- Yadea Group Holdings Ltd.
- Yamaha Motor Co., Ltd.
Additional Benefits:
- The market estimate (ME) sheet in Excel format
- 3 months of analyst support
TABLE OF CONTENTS
1 Introduction
- 1.1 Study Assumptions & Market Definition
- 1.2 Scope of the Study
2 Research Methodology
3 Executive Summary
4 Key Industry Trends
- 4.1 Annual Bicycle Sales
- 4.2 Average Selling Price & Price-Band Mix
- 4.3 Cross-Border Trade in E-Bikes & Parts (Imports/Exports)
- 4.4 E-Bike Share of Total Bicycle Sales
- 4.5 Commuters with 5-15 km One-Way Trips (%)
- 4.6 Bicycle/E-Bike Rental Market Size
- 4.7 E-Bike Battery Pack Price
- 4.8 Battery Chemistry Price Comparison
- 4.9 Last-Mile (Hyper-Local) Delivery Volume
- 4.10 Protected Bicycle Lanes (km)
- 4.11 Trekking/Outdoor Activity Participation
- 4.12 E-Bike Battery Capacity (Wh)
- 4.13 Urban Traffic Congestion Index
- 4.14 Regulatory Framework
- 4.14.1 Homologation and Certification of E-Bicycles
- 4.14.2 Export-Import and Trade Regulation
- 4.14.3 Classification, Road Access and User Rules
- 4.14.4 Battery, Charger and Charging Safety
5 Market Landscape
- 5.1 Market Overview
- 5.2 Market Drivers
- 5.2.1 Urban Congestion Driving Micro-Mobility
- 5.2.2 Li-ion Battery Energy-Density and Cost Declines
- 5.2.3 Government Incentives and Purchase Subsidies
- 5.2.4 Corporate Employee E-Bike Benefit Programs
- 5.2.5 Insurance Discounts for Cargo E-Bikes
- 5.2.6 Growth of E-Bike Tourism Routes
- 5.3 Market Restraints
- 5.3.1 Battery-Fire Incidents and Stricter Safety Norms
- 5.3.2 High Upfront Cost vs. Conventional Bikes
- 5.3.3 Limited Charging Infra in Developing Regions
- 5.3.4 Critical-Mineral Supply Volatility
- 5.4 Value / Supply-Chain Analysis
- 5.5 Regulatory Landscape
- 5.6 Technological Outlook
- 5.7 Porter's Five Forces
- 5.7.1 Threat of New Entrants
- 5.7.2 Bargaining Power of Suppliers
- 5.7.3 Bargaining Power of Buyers
- 5.7.4 Threat of Substitutes
- 5.7.5 Competitive Rivalry
6 Market Size & Growth Forecasts (Value (USD) and Volume (Units))
- 6.1 By Propulsion Type
- 6.1.1 Pedal Assisted
- 6.1.2 Speed Pedelec
- 6.1.3 Throttle Assisted
- 6.2 By Application Type
- 6.2.1 Cargo/Utility
- 6.2.2 City/Urban
- 6.2.3 Trekking/Mountain
- 6.3 By Battery Type
- 6.3.1 Lead Acid Battery
- 6.3.2 Lithium-ion Battery
- 6.3.3 Others
- 6.4 By Motor Placement
- 6.4.1 Hub (Front/Rear)
- 6.4.2 Mid-Drive
- 6.5 By Drive Systems
- 6.5.1 Chain Drive
- 6.5.2 Belt Drive
- 6.6 By Motor Power
- 6.6.1 Below 250 W
- 6.6.2 251-350 W
- 6.6.3 351-500 W
- 6.6.4 501-600 W
- 6.6.5 Above 600 W
- 6.7 By Price Band
- 6.7.1 Up to USD 1,000
- 6.7.2 USD 1,000-1,499
- 6.7.3 USD 1,500-2,499
- 6.7.4 USD 2,500-3,499
- 6.7.5 USD 3,500-5,999
- 6.7.6 Above USD 6,000
- 6.8 By Sales Channel
- 6.8.1 Online
- 6.8.2 Offline
- 6.9 By End Use
- 6.9.1 Commercial Delivery
- 6.9.1.1 Retail and Goods Delivery
- 6.9.1.2 Food and Beverage Delivery
- 6.9.2 Service Providers
- 6.9.3 Personal and Family Use
- 6.9.4 Institutional
- 6.9.5 Others
- 6.9.1 Commercial Delivery
- 6.10 By Geography
- 6.10.1 North America
- 6.10.1.1 United States
- 6.10.1.2 Canada
- 6.10.1.3 Rest of North America
- 6.10.2 South America
- 6.10.2.1 Argentina
- 6.10.2.2 Brazil
- 6.10.2.3 Rest of South America
- 6.10.3 Europe
- 6.10.3.1 Germany
- 6.10.3.2 United Kingdom
- 6.10.3.3 France
- 6.10.3.4 Italy
- 6.10.3.5 Spain
- 6.10.3.6 Netherlands
- 6.10.3.7 Austria
- 6.10.3.8 Sweden
- 6.10.3.9 Switzerland
- 6.10.3.10 Rest of Europe
- 6.10.4 Asia-Pacific
- 6.10.4.1 China
- 6.10.4.2 India
- 6.10.4.3 Japan
- 6.10.4.4 South Korea
- 6.10.4.5 Australia
- 6.10.4.6 New Zealand
- 6.10.4.7 Rest of Asia-Pacific
- 6.10.5 Middle East and Africa
- 6.10.5.1 Saudi Arabia
- 6.10.5.2 United Arab Emirates
- 6.10.5.3 South Africa
- 6.10.5.4 Rest of the Middle East and Africa
- 6.10.1 North America
7 Competitive Landscape
- 7.1 Market Concentration
- 7.2 Strategic Moves
- 7.3 Market Share Analysis
- 7.4 Company Profiles (Includes Global Level Overview, Market Level Overview, Core Segments, Financials as Available, Strategic Information, Market Rank/Share for Key Companies, Products and Services, SWOT Analysis, and Recent Developments)
- 7.4.1 Aima Technology Group Co., Ltd.
- 7.4.2 Canyon Bicycles GmbH
- 7.4.3 Fritzmeier Systems GmbH & Co. KG (M1 Sporttechnik)
- 7.4.4 Giant Manufacturing Co., Ltd.
- 7.4.5 Jiangsu Xinri E-Vehicle Co., Ltd.
- 7.4.6 Luyuan Electric Vehicle Co., Ltd.
- 7.4.7 Merida Industry Co., Ltd.
- 7.4.8 Myvelo Co., Ltd.
- 7.4.9 Rad Power Bikes Inc.
- 7.4.10 Riese & Muller GmbH
- 7.4.11 Pon Holdings B.V.
- 7.4.12 Samchuly Bicycle
- 7.4.13 Specialized Bicycle Components, Inc.
- 7.4.14 Dongguan Tailing Electric Vehicle Co., Ltd
- 7.4.15 Tianjin Fuji-Ta Bicycle Co., Ltd.
- 7.4.16 Trek Bicycle Corporation
- 7.4.17 VanMoof BV
- 7.4.18 Yadea Group Holdings Ltd.
- 7.4.19 Yamaha Motor Co., Ltd.
8 Market Opportunities & Future Outlook
9 Key Strategic Questions for E-Bikes CEOs
 電動自行車市場:2026-2032年全球市場預測(依產品類型、電池類型、驅動系統、功率輸出、速度類型、應用和銷售管道)折疊式電動自行車市場:依使用者類型、馬達功率、驅動系統和銷售管道分類-2026-2032年全球市場預測
 2026-2030年全球折疊式電動自行車市場專業電動自行車市場:依馬達配置、電池容量、價格範圍、應用和分銷管道分類-2026-2032年全球預測高階電動自行車市場:2026 年至 2032 年全球預測,按自行車類型、價格範圍、應用、電池容量、通路和馬達功率分類。腳踏輔助電動自行車市場:按類型、馬達功率、電池容量、輔助等級、價格範圍、分銷管道和應用分類-全球預測,2026-2032年鋰離子電池驅動自行車市場:按型號、驅動系統、電池容量、電池類型、額定輸出功率和推進方式分類-全球預測,2026-2032年
 電動自行車市場規模、佔有率、趨勢和預測:按交通方式、馬達類型、電池類型、等級、設計、應用和地區分類(2026-2034 年)
 電動自行車市場分析及預測(至2035年):依類型、產品類型、技術、組件、應用、最終用戶、功能、安裝類型及模式分類
 電動自行車電池市場規模、佔有率、成長率及全球產業分析:按類型、應用和地區分類,預測2026-2034年