


 |
市場調查報告書
商品編碼
1910948
北美電動自行車市場-佔有率分析、產業趨勢與統計、成長預測(2026-2031)North America E-bike - Market Share Analysis, Industry Trends & Statistics, Growth Forecasts (2026 - 2031) |
||||||
※ 本網頁內容可能與最新版本有所差異。詳細情況請與我們聯繫。
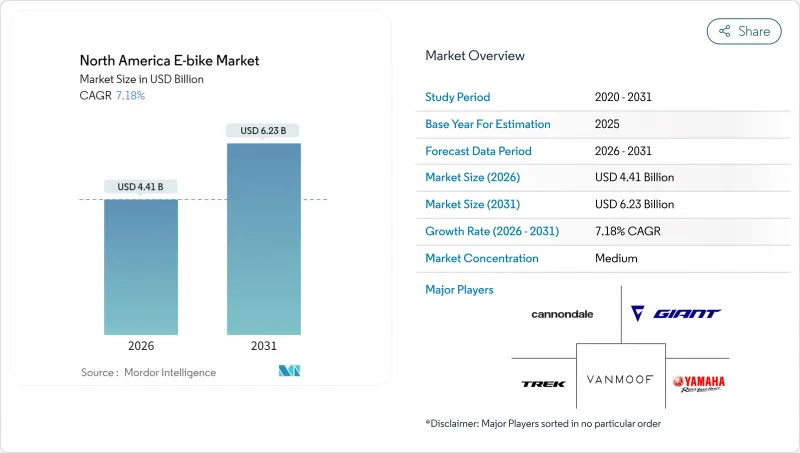
2025 年北美電動自行車市場價值 41.1 億美元,預計從 2026 年的 44.1 億美元成長到 2031 年的 62.3 億美元,在預測期(2026-2031 年)內複合年成長率為 7.18%。
聯邦政府的購買激勵措施、不斷擴大的都市區自行車基礎設施以及通勤者偏好的轉變,共同推動了自行車需求的穩定成長。受保護自行車道的快速發展和雇主贊助的微型旅行計畫的普及,使得目標客戶群不再局限於休閒騎行者。聯邦和州政府的資金投入降低了前期成本,與公共交通卡相比,已經縮短了投資回收期。
北美電動自行車市場趨勢與分析
輕型電動車聯邦稅額扣抵
《電動自行車法案》擴大了聯邦稅額扣抵,為符合條件的每輛電動自行車購買者提供高達 1500 美元的直接消費者獎勵,從根本上改變了中等收入家庭的價格彈性計算方式。這項政策機制借鑒了成功的電動車推廣策略,降低成本,加速了市場滲透,使其超越了早期採用者。這項稅額扣抵特別青睞功率低於 750 瓦的助力型電動自行車,這些車型符合現有的聯邦機動車定義,同時避免了高功率車型相關的複雜監管規定。該政策的實施與加州、科羅拉多和佛蒙特州的州級獎勵計劃重疊,累積節省的費用將使電動自行車的價格與公共交通月票的價格相媲美。
企業微型出行車輛的興起
隨著電動自行車被公認為員工通勤、園區交通和最後一公里配送的理想解決方案,企業車隊採用電動自行車的速度正在加快,其部署成本遠低於傳統車隊。受都市區配送限制和碳中和計劃的推動,包括亞馬遜、UPS 和 DHL 在內的多家大型公司已將其電動貨運自行車項目擴展至 2024 年。車隊營運商報告稱,在人口密集的城市環境中,與基於貨車的配送系統相比,電動自行車可節省 40% 至 60% 的成本,同時在交通尖峰時段時段也能實現更優異的配送性能。這種企業級應用正在形成批量採購的趨勢,並影響製造商的生產計畫和技術開發重點,尤其是在商用級零件和車隊管理軟體整合方面。
北美自由貿易組織(NAFTA)貿易區鋰離子電池供應短缺
北美自由貿易協定(北美自由貿易組織(NAFTA)框架下鋰離子電池供應受限,導致成本壓力和交貨延遲,尤其對那些沒有成熟亞洲供應鏈的電動自行車製造商而言更是如此。貿易政策轉向本地採購要求,這與北美電池目前的產能存在衝突,因為北美生產設施主要供應汽車應用領域,而微出行領域的供應有限。這種供需失衡迫使製造商在高成本的本地採購和進口電池可能面臨的關稅風險之間做出選擇,這可能會壓縮利潤空間並限制產品線的擴展。電池短缺對中階市場的影響尤其顯著,因為成本最佳化是該市場實現大眾化的關鍵。同時,高階製造商則透過多元化的採購策略來保持柔軟性。
細分市場分析
到2025年,腳踏輔助系統將維持78.98%的市場佔有率,這反映出消費者傾向於使用馬達輔助來增強自然的騎乘體驗。高速電動輔助自行車將成為成長最快的細分市場,到2031年複合年成長率將達到17.54%,這主要得益於3級法規的擴展以及郊區通勤者對汽車替代方案的需求。油門輔助系統佔據一個特殊的市場定位,主要用於無障礙出行和商業配送場景,在這些場景中,即時動力輸出具有營運優勢。推進方式的演變反映了交通運輸電氣化的大趨勢,其中,腳踏整合系統在使用者控制和能源效率方面優於純油門系統。
法規結構正在明確不同動力系統之間的區別,北美各地的自行車道和停車法規對輔助自行車給予了優先待遇。高速輔助自行車的成長與專用自行車道基礎設施的建設密切相關,使得高速騎乘成為長途通勤的實用且安全之選。
到2025年,都市區用途將佔據81.10%的市場佔有率,而貨運/實用型自行車則以20.98%的複合年成長率加速成長,這主要得益於電子商務配送經濟模式的轉變,它正在改變最後一公里物流的格局。城市用途自行車充分利用了現有的自行車基礎設施和消費者的出行意識,而貨運用途自行車則開啟了以往由汽車主導的全新應用場景。健行/山地自行車憑藉其專業的地形適應能力,迎合了休閒市場的需求,但季節性的使用模式和小眾消費群體限制了其成長。這種按用途分類的細分反映了交通途徑的替代,而非簡單的自行車市場擴張,這表明都市區出行偏好正在發生根本性的轉變。
尤其是在人口密集的城市環境中,電動自行車在商業貨運領域的應用正在加速成長,因為停車限制和擁塞費使得電動自行車配送系統具有成本優勢。隨著鐵路用地被開發利用以及戶外休閒基礎設施的投資,健行類應用也越來越受歡迎,但季節性需求限制了其全年成長潛力。
鋰離子電池預計在2025年佔據92.10%的市場佔有率,並在2031年之前保持15.98%的複合年成長率,這反映出技術的成熟和供應鏈的最佳化,使得大多數應用無需考慮其他化學體系。雖然鉛酸電池在價格敏感型細分市場仍有一席之地,但不斷縮小的成本差距和性能優勢正在推動鋰離子電池在所有細分市場中的普及。電池化學體系的標準化實現了零件的互通性,並促進了服務網路的建立,從而形成了生態系統效應,即使供應鏈存在一些脆弱性,也能增強鋰離子電池的優勢。
更高的能量密度和更快的充電速度推動了鋰離子電池領域的持續投資,製造商專注於最佳化電池化學成分,而不是其他替代技術。電池管理系統正變得越來越整合,從而實現預測性維護和性能最佳化,延長運作使用壽命並降低整體擁有成本。
其他福利:
- Excel格式的市場預測(ME)表
- 分析師支持(3個月)
目錄
第1章 引言
- 研究假設和市場定義
- 調查範圍
第2章調查方法
第3章執行摘要
第4章:主要產業趨勢
- 年度自行車銷售額
- 平均銷售價格和價格範圍構成
- 電動自行車及其零件的跨境貿易(進口/出口)
- 電動自行車在自行車總銷量中所佔的百分比
- 單程通勤距離 5-15 公里的通勤者 (%)
- 自行車和電動式自行車租賃市場規模
- 電動自行車電池組價格
- 電池化學價格比較
- 最後一公里(超本地化)配送量
- 受保護的自行車道(公里)
- 健行和戶外活動的參與率
- 電動自行車電池容量(瓦時)
- 都市交通壅塞指數
- 法律規範
- 電動自行車型式認證與認可
- 進出口和貿易法規
- 分類、道路使用和使用者規定
- 電池、充電器和充電安全
第5章 市場情勢
- 市場概覽
- 市場促進因素
- 輕型電動車聯邦稅額扣抵
- 企業微型出行車輛的興起
- 互聯遠端資訊處理和OTA更新整合
- 擴大3級(時速28英哩)電動自行車法規
- 利用廢棄鐵路場址發展旅遊走廊
- 電池即服務 (BaaS) 訂閱模式
- 市場限制
- 北美自由貿易協定(北美自由貿易組織(NAFTA))地區鋰離子電池供應短缺
- 商用電動貨車保險費上漲
- 市政限速低於每小時 20 英里
- 持續關注火災風險
- 價值/價值鏈分析
- 技術展望
- 波特五力模型
- 新進入者的威脅
- 供應商的議價能力
- 買方的議價能力
- 替代品的威脅
- 競爭對手之間的競爭
第6章 市場規模及成長預測(價值(美元)及銷售量(單位))
- 依推進類型
- 腳踏輔助
- 速度踏板
- 附油門輔助
- 透過使用
- 貨物/多用途
- 城市/都市區
- 健行/登山
- 依電池類型
- 鉛酸電池
- 鋰離子電池
- 其他
- 按下馬達安裝位置
- 輪轂(前/後)
- 中置馬達
- 透過驅動系統
- 鏈傳動
- 皮帶傳動
- 透過馬達輸出
- 小於250瓦
- 251~350 W
- 351~500 W
- 501~600 W
- 600瓦或以上
- 價格範圍(美元)
- 低於1000
- 1,000~1,499
- 1,500~2,499
- 2,500~3,499
- 3,500~5,999
- 超過6000
- 按銷售管道
- 線上
- 離線
- 按最終用途
- 商業航運
- 零售和商品分銷
- 食品和飲料配送
- 服務供應商
- 個人及家庭用途
- 對機構而言
- 其他
- 商業航運
- 按國家/地區
- 美國
- 加拿大
- 墨西哥
第7章 競爭情勢
- 市場集中度
- 策略趨勢
- 市佔率分析
- 公司簡介
- Trek Bicycle Corporation
- Giant Manufacturing Co.
- Rad Power Bikes
- Specialized Bicycle Components
- Cycling Sports Group, Inc.(Cannondale)
- Ride Aventon Inc.
- Yamaha Bicycles
- Bosch eBike Systems
- Shimano Inc.
- Riese and Muller
- VanMoof
- Propella Electric Bikes
- QuietKat(Vista Outdoor)
- Lectric eBikes
- Stromer
- Pedego Electric Bikes
- Bulls Bike USA
- Juiced Bikes
- Velotric
- Magnum Bikes
第8章:市場機會與未來展望
- 評估差距和未滿足的需求
第9章:CEO們需要思考的關鍵策略問題
The North America E-bike market was valued at USD 4.11 billion in 2025 and estimated to grow from USD 4.41 billion in 2026 to reach USD 6.23 billion by 2031, at a CAGR of 7.18% during the forecast period (2026-2031).
The combination of federal purchase incentives, growing urban cycling infrastructure, and changing commuter preferences keeps demand on a steady upward trajectory. Rapid rollout of protected bike lanes and employer-sponsored micromobility programs is widening the addressable customer base beyond core recreational cyclists. Federal and state fiscal measures that lower upfront prices have already shortened payback periods relative to public transit passes.
North America E-bike Market Trends and Insights
Federal Tax Credits for Light Electric Vehicles
Federal tax credit expansion under the E-BIKE Act framework creates direct consumer incentives worth up to USD 1,500 per qualifying electric bicycle purchase, fundamentally altering price elasticity calculations for middle-income households. This policy mechanism mirrors successful electric vehicle adoption strategies, where upfront cost reduction accelerates market penetration beyond early adopter segments. The credit structure particularly benefits pedal-assisted models under 750W, aligning with existing federal motor vehicle definitions while avoiding regulatory complexity associated with higher-powered variants. Implementation timing coincides with state-level incentive programs in California, Colorado, and Vermont, creating cumulative savings that position e-bikes competitively against public transportation monthly passes.
Rising Corporate Micromobility Fleets
Corporate fleet adoption accelerates as companies recognize e-bikes as solutions for employee commuting, campus transportation, and last-mile delivery operations, with deployment costs significantly lower than traditional vehicle fleets. Major corporations, including Amazon, UPS, and DHL, expanded e-cargo bike programs throughout 2024, driven by urban delivery restrictions and carbon neutrality commitments. Fleet operators report 40-60% cost reductions compared to van-based delivery systems in dense urban environments, while achieving superior delivery times during peak traffic periods. This corporate adoption creates bulk purchasing dynamics that influence manufacturer production planning and technology development priorities, particularly for commercial-grade components and fleet management software integration.
Tightening Lithium-Ion Cell Supply in NAFTA Region
Lithium-ion cell supply constraints within NAFTA territories create cost pressures and delivery delays that disproportionately impact e-bike manufacturers without established Asian supply relationships. Trade policy shifts toward regional content requirements conflict with current battery cell production capacity, as North American facilities primarily serve automotive applications with limited availability for micromobility segments. This supply-demand imbalance forces manufacturers to choose between higher-cost regional sourcing and potential tariff exposure on imported cells, creating margin compression that may limit product portfolio expansion. Cell shortage particularly affects mid-range price segments where cost optimization remains critical for mass market adoption, while premium manufacturers maintain flexibility through diversified sourcing strategies.
Other drivers and restraints analyzed in the detailed report include:
- Integration of Connected Telematics and OTA Updates
- Expansion of Class 3 (28 mph) E-Bike Regulations
- Insurance Premium Hikes for Commercial E-Cargo Fleets
For complete list of drivers and restraints, kindly check the Table Of Contents.
Segment Analysis
Pedal-assisted systems maintain a 78.98% market share in 2025, reflecting consumer preference for natural cycling experiences enhanced by motor assistance rather than replaced by it. Speed pedelecs emerge as the fastest-growing segment at 17.54% CAGR through 2031, driven by expanding Class 3 regulations and suburban commuter adoption seeking car-replacement solutions. Throttle-assisted variants occupy a specialized niche, primarily serving accessibility applications and commercial delivery scenarios where instant power delivery provides operational advantages. The propulsion type evolution reflects broader transportation electrification trends, where user control and energy efficiency considerations favor pedal-integrated systems over purely throttle-based alternatives.
Regulatory frameworks increasingly distinguish between propulsion types, with pedal-assisted models receiving preferential treatment in bike lane access and parking regulations across North American jurisdictions. Speed pedelec growth correlates with infrastructure improvements on dedicated cycling corridors, where higher speeds become practical and safe for longer-distance commuting applications.
City/urban applications dominate with 81.10% market share in 2025, yet cargo/utility variants accelerate at 20.98% CAGR as e-commerce delivery economics reshape last-mile logistics calculations. Urban models benefit from established cycling infrastructure and consumer familiarity, while cargo configurations unlock new use cases previously dominated by motorized vehicles. Trekking/mountain segments serve recreational markets with specialized terrain capabilities, though growth remains constrained by seasonal usage patterns and niche consumer bases. This application segmentation reflects transportation mode substitution rather than simple cycling market expansion, indicating fundamental shifts in urban mobility preferences.
Commercial cargo adoption particularly accelerates in dense urban environments where parking restrictions and congestion charges create cost advantages for e-bike delivery systems. Trekking applications gain traction through rail-trail tourism development and outdoor recreation infrastructure investments, though seasonal demand patterns limit year-round growth potential.
Lithium-ion batteries command 92.10% market share in 2025 while maintaining 15.98% CAGR through 2031, reflecting technology maturation and supply chain optimization that eliminates alternative chemistry considerations for most applications. Lead-acid alternatives persist in price-sensitive segments, though declining cost differentials and performance advantages favor lithium-ion adoption across all market tiers. Battery chemistry standardization enables component interoperability and service network development, creating ecosystem effects that reinforce lithium-ion dominance despite supply chain vulnerabilities.
Energy density improvements and charging speed enhancements drive continued lithium-ion investment, with manufacturers focusing on cell chemistry optimization rather than alternative technologies. Battery management system integration becomes increasingly sophisticated, enabling predictive maintenance and performance optimization that extends operational lifecycles while reducing total cost of ownership.
The North America E-Bike Market Report is Segmented by Propulsion Type (Pedal Assisted, and More), Application Type (Cargo/Utility, and More), Battery Type (Li-Ion, and More), Motor Placement (Hub Front/Rear, Mid-Drive), Drive Systems (Chain Drive, Belt Drive), Motor Power (Less Than 250 W, and More), Price Band, Sales Channel, End Use and by Country. The Market Forecasts are Provided in Terms of Value (USD) and Volume (Units).
List of Companies Covered in this Report:
- Trek Bicycle Corporation
- Giant Manufacturing Co.
- Rad Power Bikes
- Specialized Bicycle Components
- Cycling Sports Group, Inc. (Cannondale)
- Ride Aventon Inc.
- Yamaha Bicycles
- Bosch eBike Systems
- Shimano Inc.
- Riese and Muller
- VanMoof
- Propella Electric Bikes
- QuietKat (Vista Outdoor)
- Lectric eBikes
- Stromer
- Pedego Electric Bikes
- Bulls Bike USA
- Juiced Bikes
- Velotric
- Magnum Bikes
Additional Benefits:
- The market estimate (ME) sheet in Excel format
- 3 months of analyst support
TABLE OF CONTENTS
1 Introduction
- 1.1 Study Assumptions and Market Definition
- 1.2 Scope of the Study
2 Research Methodology
3 Executive Summary
4 Key Industry Trends
- 4.1 Annual Bicycle Sales
- 4.2 Average Selling Price and Price-Band Mix
- 4.3 Cross-Border Trade in E-Bikes and Parts (Imports/Exports)
- 4.4 E-Bike Share of Total Bicycle Sales
- 4.5 Commuters with 5 to 15 km One-Way Trips (%)
- 4.6 Bicycle/E-Bike Rental Market Size
- 4.7 E-Bike Battery Pack Price
- 4.8 Battery Chemistry Price Comparison
- 4.9 Last-Mile (Hyper-Local) Delivery Volume
- 4.10 Protected Bicycle Lanes (km)
- 4.11 Trekking/Outdoor Activity Participation
- 4.12 E-Bike Battery Capacity (Wh)
- 4.13 Urban Traffic Congestion Index
- 4.14 Regulatory Framework
- 4.14.1 Homologation and Certification of E-Bicycles
- 4.14.2 Export-Import and Trade Regulation
- 4.14.3 Classification, Road Access and User Rules
- 4.14.4 Battery, Charger and Charging Safety
5 Market Landscape
- 5.1 Market Overview
- 5.2 Market Drivers
- 5.2.1 Federal Tax Credits for Light Electric Vehicles
- 5.2.2 Rising Corporate Micromobility Fleets
- 5.2.3 Integration of Connected Telematics and OTA Updates
- 5.2.4 Expansion of Class 3 (28 mph) E-Bike Regulations
- 5.2.5 Growth of Rail-Trail Tourism Corridors
- 5.2.6 Battery-as-a-Service Subscription Models
- 5.3 Market Restraints
- 5.3.1 Tightening Lithium-Ion Cell Supply in NAFTA Region
- 5.3.2 Insurance Premium Hikes for Commercial E-Cargo Fleets
- 5.3.3 Municipal Speed-Limit Caps below 20 mph
- 5.3.4 Persistent Perception of Fire-Hazard Risk
- 5.4 Value/Supply-Chain Analysis
- 5.5 Technological Outlook
- 5.6 Porter's Five Forces
- 5.6.1 Threat of New Entrants
- 5.6.2 Bargaining Power of Suppliers
- 5.6.3 Bargaining Power of Buyers
- 5.6.4 Threat of Substitutes
- 5.6.5 Competitive Rivalry
6 Market Size and Growth Forecasts (Value (USD) and Volume (Units))
- 6.1 By Propulsion Type
- 6.1.1 Pedal Assisted
- 6.1.2 Speed Pedelec
- 6.1.3 Throttle Assisted
- 6.2 By Application Type
- 6.2.1 Cargo/Utility
- 6.2.2 City/Urban
- 6.2.3 Trekking/Mountain
- 6.3 By Battery Type
- 6.3.1 Lead Acid Battery
- 6.3.2 Lithium-ion Battery
- 6.3.3 Others
- 6.4 By Motor Placement
- 6.4.1 Hub (front/rear)
- 6.4.2 Mid-drive
- 6.5 By Drive Systems
- 6.5.1 Chain Drive
- 6.5.2 Belt Drive
- 6.6 By Motor Power
- 6.6.1 Less than 250 W
- 6.6.2 251 to 350 W
- 6.6.3 351 to 500 W
- 6.6.4 501 to 600 W
- 6.6.5 More than 600 W
- 6.7 By Price Band (USD)
- 6.7.1 Up to 1,000
- 6.7.2 1,000 to 1,499
- 6.7.3 1,500 to 2,499
- 6.7.4 2,500 to 3,499
- 6.7.5 3,500 to 5,999
- 6.7.6 Above 6,000
- 6.8 By Sales Channel
- 6.8.1 Online
- 6.8.2 Offline
- 6.9 By End Use
- 6.9.1 Commercial Delivery
- 6.9.1.1 Retail and Goods Delivery
- 6.9.1.2 Food and Beverage Delivery
- 6.9.2 Service Providers
- 6.9.3 Personal and Family Use
- 6.9.4 Institutional
- 6.9.5 Others
- 6.9.1 Commercial Delivery
- 6.10 By Country
- 6.10.1 United States
- 6.10.2 Canada
- 6.10.3 Mexico
7 Competitive Landscape
- 7.1 Market Concentration
- 7.2 Strategic Moves
- 7.3 Market Share Analysis
- 7.4 Company Profiles (Includes Global level Overview, Market level overview, Core Segments, Financials as available, Strategic Information, Market Rank/Share for key companies, Products and Services, and Recent Developments)
- 7.4.1 Trek Bicycle Corporation
- 7.4.2 Giant Manufacturing Co.
- 7.4.3 Rad Power Bikes
- 7.4.4 Specialized Bicycle Components
- 7.4.5 Cycling Sports Group, Inc. (Cannondale)
- 7.4.6 Ride Aventon Inc.
- 7.4.7 Yamaha Bicycles
- 7.4.8 Bosch eBike Systems
- 7.4.9 Shimano Inc.
- 7.4.10 Riese and Muller
- 7.4.11 VanMoof
- 7.4.12 Propella Electric Bikes
- 7.4.13 QuietKat (Vista Outdoor)
- 7.4.14 Lectric eBikes
- 7.4.15 Stromer
- 7.4.16 Pedego Electric Bikes
- 7.4.17 Bulls Bike USA
- 7.4.18 Juiced Bikes
- 7.4.19 Velotric
- 7.4.20 Magnum Bikes
8 Market Opportunities and Future Outlook
- 8.1 White-Space and Unmet-Need Assessment
9 Key Strategic Questions for E-Bike CEOs
 電動自行車市場:2026-2032年全球市場預測(依產品類型、電池類型、驅動系統、功率輸出、速度類型、應用和銷售管道)折疊式電動自行車市場:依使用者類型、馬達功率、驅動系統和銷售管道分類-2026-2032年全球市場預測
 2026-2030年全球折疊式電動自行車市場專業電動自行車市場:依馬達配置、電池容量、價格範圍、應用和分銷管道分類-2026-2032年全球預測高階電動自行車市場:2026 年至 2032 年全球預測,按自行車類型、價格範圍、應用、電池容量、通路和馬達功率分類。腳踏輔助電動自行車市場:按類型、馬達功率、電池容量、輔助等級、價格範圍、分銷管道和應用分類-全球預測,2026-2032年鋰離子電池驅動自行車市場:按型號、驅動系統、電池容量、電池類型、額定輸出功率和推進方式分類-全球預測,2026-2032年
 電動自行車市場規模、佔有率、趨勢和預測:按交通方式、馬達類型、電池類型、等級、設計、應用和地區分類(2026-2034 年)
 電動自行車市場分析及預測(至2035年):依類型、產品類型、技術、組件、應用、最終用戶、功能、安裝類型及模式分類
 電動自行車電池市場規模、佔有率、成長率及全球產業分析:按類型、應用和地區分類,預測2026-2034年