


 |
市場調查報告書
商品編碼
1910928
多式聯運:市場佔有率分析、產業趨勢與統計、成長預測(2026-2031)Intermodal Freight Transportation - Market Share Analysis, Industry Trends & Statistics, Growth Forecasts (2026 - 2031) |
||||||
※ 本網頁內容可能與最新版本有所差異。詳細情況請與我們聯繫。
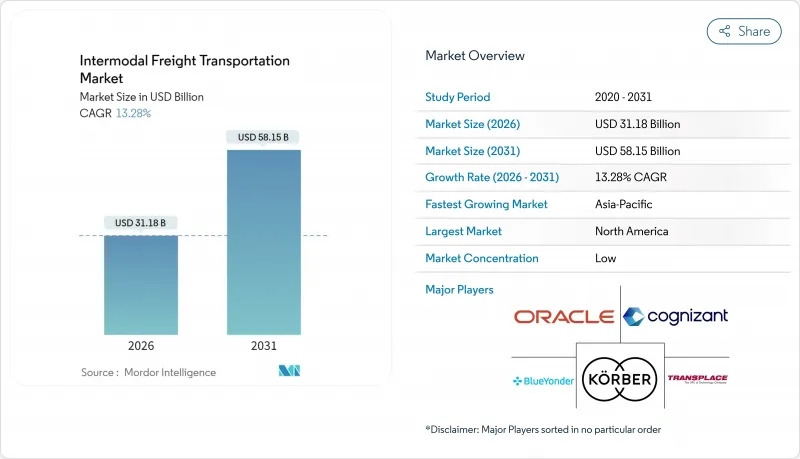
預計到 2026 年,多式聯運貨運市場規模將達到 311.8 億美元,高於 2025 年的 275.2 億美元,預計到 2031 年將達到 581.5 億美元。
預計2026年至2031年年複合成長率(CAGR)為13.28%。
電子商務交易量的成長、供應鏈數位化的加速以及政策主導的脫碳目標正在共同重塑運輸方式的選擇,並推動對綜合物流解決方案的需求。公共支出,包括耗資100億美元的拉雷多-蒙特雷自動化鐵路走廊以及「一帶一路」沿線的大規模鐵路投資,正開始釋放潛力並重塑洲際貿易流量。科技的應用正在擴大即時可視性、縮短停留時間並提高資產運轉率,而永續性則增強了鐵路-公路和海鐵聯運的經濟合理性。競爭優勢正從單純的資產規模轉向在單一多模態平台上整合軟體、分析和經認證的低碳服務的能力。
全球多式聯運貨運市場趨勢與洞察
全球供應鏈數位化提高了即時可視性
基於雲端的物流平台蓬勃發展,將承運人、碼頭和托運人連接成一個整合的資料生態系統,每年處理數十億筆交易。預測分析技術將貨物停留時間縮短了兩位數百分比,並實現了動態路線規劃,從而提高了鐵路、公路和海運的資產運轉率。物聯網智慧貨櫃傳輸溫度、濕度和位置數據,以增強貨物完整性並降低保險成本。區塊鏈技術提供的記錄提供了不可篡改的交貨證明,並解決了不同運輸方式之間的歷史糾紛,而豐富的API架構則便於與傳統EDI標準整合。這些數位化基礎正在將多式聯運市場轉變為一個數據驅動型網路,能夠大規模進行近乎即時的路線調整。
不斷成長的電子商務交易量需要靈活的貨運方式
B2C小包裹需求持續成長,成長速度超過商品貿易總量,迫使托運人從點對點的整車運輸轉向以速度和成本為平衡點的軸輻式多式聯運解決方案。光是亞馬遜就計畫在2024年在北美運作15個新的多式聯運設施,從而縮短平均「中間里程」。兩日達的預期和不斷成長的跨境訂單推動了鐵路沿線貨運量的成長,尤其是在500至1500英里的最佳運輸距離範圍內。全通路零售商也更頻繁地重新分配庫存,這促使他們需要靈活的運輸方式切換,以確保貨架上的商品充足,同時避免佔用過多營運資金。
港口擁擠和底盤短缺加劇了周轉時間延長。
由於底盤供應無法滿足旺季需求,美國主要門戶港口的平均貨櫃停留時間從2019年的3.8天增加到2024年的5.2天。對中國製造的設備徵收關稅以及國內產能有限,導致供應量僅為所需量的78%。貨櫃逾期歸還每天給多式聯運業者造成約150美元的罰款,削弱了其與長途卡車運輸的成本競爭力。自動化計劃有望改善這一狀況,但由於實施週期長達數年,這一瓶頸問題仍然是近期面臨的一大風險。
細分市場分析
軟體收入正以13.43%的複合年成長率成長,超過了規模仍然龐大的服務類別。至2025年,服務類別將佔多式聯運貨運市場收入的60.42%。 Blue Yonder的人工智慧平台每年已處理超過20億個運輸決策,從而最佳化路線選擇、貨物整合和運力預測。雲端部署模式降低了進入門檻,使中型托運人無需大量資本支出即可部署強大的運輸管理系統(TMS)和倉庫管理系統(WMS)。
服務供應商透過捆綁諮詢、實施和管理服務來保持競爭優勢,從而降低軟體部署風險並推動持續最佳化。 Oracle 於 2024 年收購 Cerner 的供應鏈資產,鞏固了其在醫療保健領域的地位;而 Cognizant 與 Microsoft Azure 的合作則為製藥業拓展了多租戶視覺選項。符合 FDA 和 DOT 監管要求的合規模組正在推動對專業軟體的需求,而訂閱定價模式則為供應商提供了穩定的收入來源。隨著預測分析在永續性報告和按需運力調整方面變得至關重要,軟體驅動的多式聯運市場預計將會擴張。
到2025年,空運和公路運輸合計將佔多式聯運收入的45.62%,而鐵路運輸服務到2031年將以13.51%的複合年成長率成長,這將改變多式聯運貨運市場的收入結構。柴油價格持續波動以及鐵路40%的燃油效率優勢,使得鐵路成為500英里以上運輸的首選方案。連接洛杉磯和西雅圖、耗資30億美元的北太平洋綠色走廊電氣化鐵路計劃正在推動這項轉變。
對於高價值、時效性強的貨物運輸,空運與公路聯運方案仍然至關重要。聯邦快遞斥資40億美元擴建孟菲斯世界樞紐,新增鐵路連接,將國內運輸時間縮短了半天之多,兼具空運的速度和鐵路運輸的經濟性。海運與公路以及海運與鐵路聯運仍然是大宗貨物運輸和長途運輸的重要方式。同時,機器人和自動駕駛卡車預計在未來透過降低最後一公里的人力成本,重新平衡各種運輸方式的佔有率。
區域分析
預計到2025年,亞太地區將佔全球營收的29.33%,複合年成長率達13.69%,鞏固其作為多式聯運貨運市場成長最快地區的地位。中歐鐵路快運服務在2024年將實現超過17,000趟的出貨量,使高價值貨物的海運時間縮短10至15天。印度的專用貨運走廊和東協跨境鐵路互聯互通正在將越南、泰國和印尼的生產中心與主要港口連接起來,擴大網路覆蓋範圍。
北美地區在收入方面位居第二,這得益於貿易路線以及美國墨加協定(USMCA)下的大規模基礎設施投資。該地區相關的多式聯運市場規模預計將受益於拉雷多-蒙特雷走廊和加拿大太平洋鐵路-堪薩斯城單線鐵路網,這將簡化邊境通關流程並縮短換乘停留時間。駕駛人和底盤短缺將限制短期成長,但在政府補貼和私人資本投資的支持下,長期成長前景穩健。
在歐洲,重點在於減少排放和跨境標準化。 「Fit for 55」碳排放法規和250億歐元(273億美元)的泛歐交通運輸網路(TEN-T)基金正在加速向以鐵路為中心的1500公里以下貨運路線轉型。德國的自動化鐵路貨運站和英國的港口發展將有助於緩解英國脫歐後貿易結構調整的影響。南美洲、中東和非洲等新興地區雖然絕對規模仍然較小,但在貨物運輸走廊和「一帶一路」基礎設施投資計劃沿線的某些領域仍存在機會。
其他福利
- Excel格式的市場預測(ME)表
- 3個月的分析師支持
目錄
第1章 引言
- 研究假設和市場定義
- 調查範圍
第2章調查方法
第3章執行摘要
第4章 市場環境
- 市場概覽
- 市場促進因素
- 全球供應鏈數位化增強了即時視覺性
- 不斷成長的電子商務交易量需要靈活的貨運方式
- 透過促進模式轉換。
- 政府投資興建鐵路樞紐和內陸港
- 具備物聯網追蹤功能的智慧貨櫃正變得越來越受歡迎。
- 沿主要海上貿易航線發展綠色走廊
- 市場限制
- 分段資料標準限制了系統互通性
- 港口擁擠和底盤短缺導致周轉時間延長
- 多式聯運卡車駕駛人嚴重短缺
- 互聯終端資產面臨的網路安全風險日益增加
- 產業價值/價值鏈分析
- 監管環境
- 技術展望
- 宏觀經濟因素的影響
- 波特五力分析
- 買方的議價能力
- 供應商的議價能力
- 新進入者的威脅
- 替代品的威脅
- 競爭對手之間的競爭
第5章 市場規模與成長預測
- 按組件
- 軟體
- 服務
- 透過交通工具
- 鐵路和道路運輸
- 航空和陸路運輸
- 海陸運輸
- 其他交通方式
- 按最終用戶行業分類
- 工業和製造業
- 石油和天然氣
- 消費品及零售
- 飲食
- 建造
- 其他
- 按容器類型
- 乾貨容器
- 冷藏貨櫃
- 槽式貨櫃
- 平板架和敞口容器
- 按服務類型
- 交通規劃
- 車隊管理
- 倉儲和配送
- 其他
- 按地區
- 北美洲
- 美國
- 加拿大
- 墨西哥
- 南美洲
- 巴西
- 阿根廷
- 南美洲其他地區
- 歐洲
- 德國
- 英國
- 法國
- 義大利
- 西班牙
- 俄羅斯
- 其他歐洲
- 亞太地區
- 中國
- 日本
- 印度
- 韓國
- 東南亞
- 澳洲和紐西蘭
- 亞太其他地區
- 中東
- 沙烏地阿拉伯
- 阿拉伯聯合大公國
- 土耳其
- 其他中東地區
- 非洲
- 南非
- 奈及利亞
- 埃及
- 其他非洲地區
- 北美洲
第6章 競爭情勢
- 市場集中度
- 策略趨勢
- 市佔率分析
- 公司簡介
- Oracle Corporation
- Cognizant Technology Solutions Corporation
- Karber AG
- Blue Yonder Group Inc.
- Transplace LLC
- Wabtec Corporation
- The Descartes Systems Group Inc.
- Motorola Solutions Inc.
- Elemica Inc.
- Envase Technologies LLC
- CH Robinson Worldwide Inc.
- Deutsche Bahn AG
- Kuehne+Nagel International AG
- DSV A/S
- FedEx Corporation
- United Parcel Service Inc.
- XPO Logistics Inc.
- JB Hunt Transport Services Inc.
- Maersk Line A/S
- DP World PLC
第7章 市場機會與未來展望
The intermodal freight transportation market size in 2026 is estimated at USD 31.18 billion, growing from 2025 value of USD 27.52 billion with 2031 projections showing USD 58.15 billion, growing at 13.28% CAGR over 2026-2031.
Rising e-commerce volumes, accelerating supply-chain digitalization, and policy-driven decarbonization goals are converging to reshape modal choices and propel demand for integrated logistics solutions. Public spending on infrastructure, including the USD 10 billion automated rail corridor between Laredo and Monterrey, as well as large-scale Belt and Road rail investments, has begun to unlock latent capacity while redirecting continental trade flows. Technology adoption is expanding real-time visibility, shrinking dwell times, and increasing asset utilization rates, while sustainability mandates reinforce the economic case for rail-road and maritime-rail combinations. Competitive differentiation is shifting from pure asset scale to the ability to orchestrate software, analytics, and certified low-carbon services within a single multimodal platform.
Global Intermodal Freight Transportation Market Trends and Insights
Digitisation of Global Supply Chains Enhances Real-Time Visibility
Widespread adoption of cloud-based logistics platforms now connects carriers, terminals, and shippers within unified data ecosystems that process billions of transactions per year . Predictive analytics reduces dwell times by double-digit percentages and supports dynamic routing that lifts asset-utilization rates across rail, road, and maritime legs. IoT-equipped smart containers transmit temperature, humidity, and location data, reinforcing cargo integrity and lowering insurance costs. Blockchain-enabled records offer immutable proof-of-delivery that resolves historic disputes among modal operators, while API-rich architectures ease integration with legacy EDI standards. Collectively, these digital building blocks are turning the intermodal freight transportation market into a data-driven network capable of near-real-time course correction at scale.
Expansion of E-commerce Volumes Demanding Flexible Freight Options
B2C parcel demand continues to grow faster than total merchandise trade, forcing shippers to shift from point-to-point full-truckload moves toward hub-and-spoke intermodal solutions that balance speed and cost. Amazon alone commissioned 15 new North American intermodal facilities during 2024 to shorten the average "middle-mile" hop. Two-day delivery expectations and enlarging cross-border order books channel higher volumes onto rail-road corridors within the 500-1,500-mile sweet spot. Omnichannel retailers also reposition inventory more frequently, raising demand for agile mode-switching that keeps shelves stocked without inflating working capital.
Port Congestion and Chassis Shortages Escalating Turn-Round Times
Average container dwell time at major U.S. gateways reached 5.2 days in 2024, up from 3.8 days in 2019, as chassis availability fell short of peak-season demand. Tariffs on Chinese-built equipment and limited domestic manufacturing capacity left supply at 78% of required levels. Intermodal operators incurred daily penalty fees near USD 150 for late container returns, undermining cost competitiveness versus long-haul trucking. Automation projects promise relief but require multiyear deployments, keeping this bottleneck on short-term risk radars.
Other drivers and restraints analyzed in the detailed report include:
- Shift Toward Decarbonised Logistics Through Modal-Shift Incentives
- Government Investments in Rail-Road Terminals and Dry Ports
- Acute Shortage of Intermodal-Qualified Truck Drivers
For complete list of drivers and restraints, kindly check the Table Of Contents.
Segment Analysis
Software revenues are growing at 13.43% CAGR, outpacing the larger services category that still accounts for 60.42% of 2025 turnover within the intermodal freight transportation market. Blue Yonder's AI platform already ingests over 2 billion shipment decisions each year, enhancing lane selection, load consolidation, and capacity prediction. Cloud deployment models lower entry barriers, enabling mid-market shippers to adopt robust TMS and WMS capabilities without heavy capital outlays.
Service providers maintain their lead by bundling consulting, implementation, and managed services that de-risk software launches and drive ongoing optimization. Oracle's 2024 acquisition of Cerner's supply-chain assets strengthened its healthcare footprint, while Cognizant's alliance with Microsoft Azure expanded multitenant visibility options for pharmaceuticals. Compliance modules covering FDA and DOT mandates elevate demand for specialized software, and subscription pricing stabilizes revenue streams for vendors. The intermodal freight transportation market size linked to software is set to widen as predictive analytics becomes indispensable for sustainability reporting and on-demand capacity orchestration.
Air-road pairings held 45.62% of 2025 modal revenue, yet rail-road services are advancing at a 13.51% CAGR through 2031 and shifting the revenue mix of the intermodal freight transportation market. Sustained diesel price volatility and a 40% fuel-efficiency edge make rail compelling for hauls over 500 miles. The USD 3 billion North Pacific Green Corridor electrified rail project connecting Los Angeles and Seattle underpins this pivot.
Air-road solutions remain irreplaceable for high-value, time-sensitive cargo. FedEx's USD 4 billion Memphis World Hub expansion added rail links that compress domestic transit by up to half a day, blending airspeed with rail economics . Maritime-road and maritime-rail combinations continue to serve bulk and long-distance lanes, while robotics and autonomous trucks may eventually rebalance mode shares by shrinking final-mile labor costs.
The Intermodal Freight Transportation Market is Segmented by Component (Software, Service), Transportation Mode (Rail and Road Transport, Air and Road Transport, and More), End-User Industry (Industrial and Manufacturing, and More), Container Type (Dry Containers, Refrigerated Containers, and More), Service Type (Transportation Planning, and More), and Geography. The Market Forecasts are Provided in Terms of Value (USD).
Geography Analysis
Asia Pacific accounted for 29.33% of 2025 revenue and is poised to grow at 13.69% CAGR, firmly establishing itself as the fastest-expanding region in the intermodal freight transportation market. China-Europe Railway Express services tallied more than 17,000 trains in 2024, shaving 10-15 days off maritime schedules for high-value goods. India's Dedicated Freight Corridor and ASEAN cross-border rail links are synchronizing production bases in Vietnam, Thailand, and Indonesia with major seaports, broadening the network's reach.
North America ranks second by revenue, underpinned by USMCA-aligned trade lanes and extensive infrastructure investment. The intermodal freight transportation market size attached to the region will benefit from the Laredo-Monterrey corridor and the Canadian Pacific Kansas City single-line rail network, both of which streamline border crossings and reduce interchange dwell time. Driver shortages and chassis deficits temper near-term upside but do not derail the long-term growth trajectory supported by government grants and private capex.
Europe focuses on emission reduction and cross-border standardization. Fit for 55 carbon rules and EUR 25 billion (USD 27.3 billion) in TEN-T funding are accelerating a pivot to rail-centric itineraries for freight under 1,500 km. Automated rail terminals in Germany and port upgrades in the United Kingdom buffer post-Brexit trade realignment. Emerging regions such as South America, the Middle East, and Africa remain smaller in absolute terms yet present targeted opportunities along commodity corridors and Belt and Road-financed infrastructure tranches.
- Oracle Corporation
- Cognizant Technology Solutions Corporation
- Karber AG
- Blue Yonder Group Inc.
- Transplace LLC
- Wabtec Corporation
- The Descartes Systems Group Inc.
- Motorola Solutions Inc.
- Elemica Inc.
- Envase Technologies LLC
- C.H. Robinson Worldwide Inc.
- Deutsche Bahn AG
- Kuehne + Nagel International AG
- DSV A/S
- FedEx Corporation
- United Parcel Service Inc.
- XPO Logistics Inc.
- J.B. Hunt Transport Services Inc.
- Maersk Line A/S
- DP World PLC
Additional Benefits:
- The market estimate (ME) sheet in Excel format
- 3 months of analyst support
TABLE OF CONTENTS
1 INTRODUCTION
- 1.1 Study Assumptions and Market Definition
- 1.2 Scope of the Study
2 RESEARCH METHODOLOGY
3 EXECUTIVE SUMMARY
4 MARKET LANDCSAPE
- 4.1 Market Overview
- 4.2 Market Drivers
- 4.2.1 Digitisation of global supply chains enhances real-time visibility
- 4.2.2 Expansion of e-commerce volumes demanding flexible freight options
- 4.2.3 Shift toward decarbonised logistics through modal shift incentives
- 4.2.4 Government investments in rail-road terminals and dry ports
- 4.2.5 Growing availability of smart containers with IoT tracking
- 4.2.6 Deployment of green corridors on key maritime trade lanes
- 4.3 Market Restraints
- 4.3.1 Fragmented data standards limit system interoperability
- 4.3.2 Port congestion and chassis shortages escalating turn-round times
- 4.3.3 Acute shortage of intermodal-qualified truck drivers
- 4.3.4 Rising cyber-security risks across connected terminal assets
- 4.4 Industry Value / Supply-Chain Analysis
- 4.5 Regulatory Landscape
- 4.6 Technological Outlook
- 4.7 Impact of Macroeconomic Factors
- 4.8 Porter's Five Forces Analysis
- 4.8.1 Bargaining Power of Buyers
- 4.8.2 Bargaining Power of Suppliers
- 4.8.3 Threat of New Entrants
- 4.8.4 Threat of Substitutes
- 4.8.5 Intensity of Competitive Rivalry
5 MARKET SIZE AND GROWTH FORECASTS (VALUE)
- 5.1 By Component
- 5.1.1 Software
- 5.1.2 Service
- 5.2 By Transportation Mode
- 5.2.1 Rail and Road Transport
- 5.2.2 Air and Road Transport
- 5.2.3 Maritime and Road Transport
- 5.2.4 Other Transportation Modes
- 5.3 By End-User Industry
- 5.3.1 Industrial and Manufacturing
- 5.3.2 Oil and Gas
- 5.3.3 Consumer and Retail
- 5.3.4 Food and Beverage
- 5.3.5 Construction
- 5.3.6 Other End-User Industries
- 5.4 By Container Type
- 5.4.1 Dry Containers
- 5.4.2 Refrigerated Containers
- 5.4.3 Tank Containers
- 5.4.4 Flat-rack and Open-top Containers
- 5.5 By Service Type
- 5.5.1 Transportation Planning
- 5.5.2 Fleet Management
- 5.5.3 Warehousing and Distribution
- 5.5.4 Other Services
- 5.6 By Geography
- 5.6.1 North America
- 5.6.1.1 United States
- 5.6.1.2 Canada
- 5.6.1.3 Mexico
- 5.6.2 South America
- 5.6.2.1 Brazil
- 5.6.2.2 Argentina
- 5.6.2.3 Rest of South America
- 5.6.3 Europe
- 5.6.3.1 Germany
- 5.6.3.2 United Kingdom
- 5.6.3.3 France
- 5.6.3.4 Italy
- 5.6.3.5 Spain
- 5.6.3.6 Russia
- 5.6.3.7 Rest of Europe
- 5.6.4 Asia Pacific
- 5.6.4.1 China
- 5.6.4.2 Japan
- 5.6.4.3 India
- 5.6.4.4 South Korea
- 5.6.4.5 Southeast Asia
- 5.6.4.6 Australia and New Zealand
- 5.6.4.7 Rest of Asia Pacific
- 5.6.5 Middle East
- 5.6.5.1 Saudi Arabia
- 5.6.5.2 United Arab Emirates
- 5.6.5.3 Turkey
- 5.6.5.4 Rest of Middle East
- 5.6.6 Africa
- 5.6.6.1 South Africa
- 5.6.6.2 Nigeria
- 5.6.6.3 Egypt
- 5.6.6.4 Rest of Africa
- 5.6.1 North America
6 COMPETITIVE LANDSCAPE
- 6.1 Market Concentration
- 6.2 Strategic Moves
- 6.3 Market Share Analysis
- 6.4 Company Profiles (includes Global level Overview, Market level overview, Core Segments, Financials as available, Strategic Information, Market Rank/Share for key companies, Products and Services, and Recent Developments)
- 6.4.1 Oracle Corporation
- 6.4.2 Cognizant Technology Solutions Corporation
- 6.4.3 Karber AG
- 6.4.4 Blue Yonder Group Inc.
- 6.4.5 Transplace LLC
- 6.4.6 Wabtec Corporation
- 6.4.7 The Descartes Systems Group Inc.
- 6.4.8 Motorola Solutions Inc.
- 6.4.9 Elemica Inc.
- 6.4.10 Envase Technologies LLC
- 6.4.11 C.H. Robinson Worldwide Inc.
- 6.4.12 Deutsche Bahn AG
- 6.4.13 Kuehne + Nagel International AG
- 6.4.14 DSV A/S
- 6.4.15 FedEx Corporation
- 6.4.16 United Parcel Service Inc.
- 6.4.17 XPO Logistics Inc.
- 6.4.18 J.B. Hunt Transport Services Inc.
- 6.4.19 Maersk Line A/S
- 6.4.20 DP World PLC
7 MARKET OPPORTUNITIES AND FUTURE OUTLOOK
- 7.1 White-space and Unmet-need Assessment
 2034年線下交通樞紐市場預測-按樞紐類型、服務內容、所有權/營運模式、最終用戶和區域分類的全球分析
 多式聯運市場報告:按組成部分、運輸方式、最終用戶和地區分類(2026-2034 年)
 多式聯運市場:依服務、運輸方式、貨物類型及最終用戶產業分類-2026-2032年全球市場預測
 2026年全球多式聯運貨運市場報告
 2026-2030年全球多式聯運貨運市場日本貨運市場規模、佔有率、趨勢及預測(按交付類型、運輸方式、最終用途和地區分類),2026-2034年按貨物類型、港口類型、所有權類型、服務類型和應用分類的航運和港口市場 - 2026-2032 年全球預測
 多式聯運樞紐市場機會、成長促進因素、產業趨勢分析及預測(2025-2034年)2032 年多式聯運市場預測:按服務類型、解決方案類型、運輸方式、貨櫃類型、最終用戶和地區進行的全球分析
 2026 年至 2032 年運輸管理軟體市場(按模式、功能、最終用戶和地區分類)