


 |
市場調查報告書
商品編碼
1892733
多式聯運樞紐市場機會、成長促進因素、產業趨勢分析及預測(2025-2034年)Intermodal Transportation Hubs Market Opportunity, Growth Drivers, Industry Trend Analysis, and Forecast 2025 - 2034 |
||||||
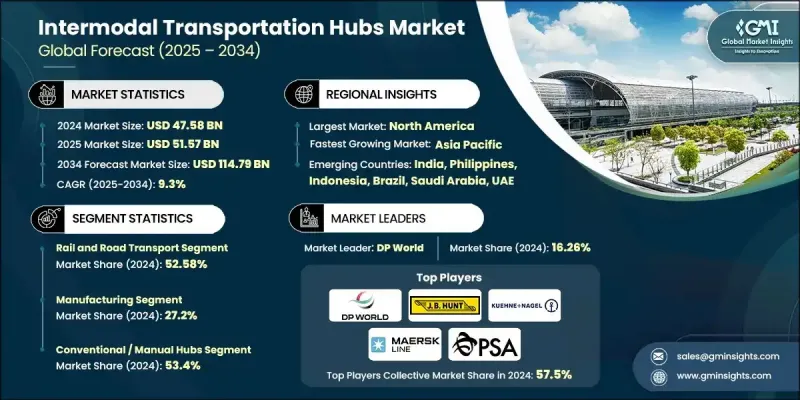
2024 年全球多式聯運樞紐市場價值為 475.8 億美元,預計到 2034 年將以 9.3% 的複合年成長率成長至 1147.9 億美元。
全球貨運系統正朝著無縫整合鐵路、公路、航空和海運網路,建構協調物流生態系統的方向發展,這推動了貨運成長。現代化的多式聯運樞紐使貨運業者、基礎設施開發商和供應鏈組織能夠更有效率地運輸貨物,減少對單一運輸方式的依賴。這種模式降低了運輸成本,縮短了交貨時間,並提高了整體路線的靈活性。全球貿易活動的成長、跨境業務的擴張以及電子商務的加速發展,持續強化了對多模式連接的需求,而強大的數位追蹤和順暢的運輸方式交接是支撐這一需求的關鍵。處理大批量工業物流的供應鏈也需要可靠且具彈性的路線,這進一步推動了對能夠以更高透明度和可靠性管理複雜貨物轉運的樞紐的需求。全球永續發展目標、大規模基礎設施升級以及對低排放物流的推動,進一步增強了這一趨勢。清潔能源系統、電動車貨運解決方案和關鍵礦產運輸網路的快速發展,為長途貨運最佳化創造了機會。多式聯運節點結合了鐵路和海運的效率以及公路運輸的靈活性,有助於簡化這些物流流程。
| 市場範圍 | |
|---|---|
| 起始年份 | 2024 |
| 預測年份 | 2025-2034 |
| 起始值 | 475.8億美元 |
| 預測值 | 1147.9億美元 |
| 複合年成長率 | 9.3% |
2024年,鐵路和公路運輸市場佔有率為52.58%,預計到2034年將以9.6%的複合年成長率成長。該板塊之所以保持主導地位,是因為鐵路長途貨運與公路靈活本地配送相結合,使營運商能夠縮短運輸時間並保持營運成本的可預測性。鐵路連接仍然是工業走廊的核心,以穩定可靠的方式支持散裝物料、製成品、零件和消費品的運輸。
2024年,製造業市場佔有率佔27.2%,預計2025年至2034年將以9.4%的複合年成長率成長。製造商高度依賴多式聯運樞紐來有效運輸大量原料和成品。鐵路、公路和港口整合網路有助於減少瓶頸、穩定交付進度,並改善機械、汽車、電子和重型設備等行業的成本控制。管理標準化貨櫃和重型貨物的能力鞏固了該行業的領先地位。
美國多式聯運樞紐市場佔85%的市場佔有率,預計2024年市場規模將達到139.7億美元。持續投資於鐵路運力擴建、碼頭自動化和港口基礎設施現代化,正推動全美的強勁成長。區域內電子商務活動、製造業產出和跨境貿易的蓬勃發展,推動了對多模式連接的需求,以提高運輸可視性並減少延誤。包括物聯網監控、基於RFID的貨物追蹤和整合物流軟體在內的先進數位工具,正成為最佳化美國主要樞紐貨物協調的關鍵。
目錄
第1章:方法論
第2章:執行概要
第3章:行業洞察
- 產業生態系分析
- 供應商格局
- 利潤率分析
- 成本結構
- 每個階段的價值增加
- 影響價值鏈的因素
- 中斷
- 產業影響因素
- 成長促進因素
- 跨境貿易與全球供應鏈的快速擴張
- 政府增加鐵路走廊、智慧港口和多模式物流園區的投資
- 電子商務和零售分銷激增
- 工業走廊、經濟特區和智慧城市建設的增加
- 永續發展和減排要求的提高
- 產業陷阱與挑戰
- 碼頭建設和自動化方面的高額資本支出
- 多種運輸方式之間的運作碎片化
- 市場機遇
- 人工智慧驅動的終端作業系統(TOS)採用率上升
- 戰略貿易走廊發展日益加強
- 電動化和自動化貨物裝卸設備的需求激增
- 數位海關、區塊鏈和智慧門禁系統的部署日益增多
- 成長促進因素
- 成長潛力分析
- 監管環境
- 波特的分析
- PESTEL 分析
- 技術與創新格局
- 當前技術趨勢
- 貨物裝卸自動化與機器人技術
- 數位孿生與仿真技術
- 用於資產追蹤的物聯網和感測器網路
- 新興技術
- 人工智慧與預測分析
- 用於文件和追溯的區塊鏈
- 5G 連接和邊緣運算
- 當前技術趨勢
- 專利分析
- 價格趨勢
- 按地區
- 按類型
- 成本細分分析
- 商業案例及投資報酬率分析
- 總擁有成本框架
- 投資報酬率計算方法
- 實施時間表和里程碑
- 風險評估與緩解策略
- 永續性和環境影響分析
- 永續實踐
- 減少廢棄物策略
- 生產中的能源效率
- 環保舉措
- 碳足跡考量
- 投資與融資分析
- 基礎設施投資與就業法案 (IIJA) 的影響
- 公私合作(PPP)模式
- 私募股權和創投活動
- 綠色金融與永續發展掛鉤的資金
- 基礎設施容量利用率及瓶頸分析
- 港口擁擠指標與停留時間分析
- 鐵路貨運站容量限制
- 機箱可用性和池管理挑戰
- 門控處理吞吐量限制
- 碼頭鐵路運能與需求缺口
- 堆場利用率
- 高峰期激增容量需求
- 多式聯運連接器瓶頸識別
- 陸側可達性和首末公里基礎設施連接
- 多式聯運連接器計劃(聯邦公路管理局)投資重點
- 立體交叉路口和緩解交通堵塞項目
- 短程運輸卡車運能及司機短缺
- 城市貨運走廊和貨車路線限制
- 鐵路網路運能及一級鐵路壅塞狀況
- 短途鐵路連通性和基礎設施狀況
- 專用貨運走廊與高速鐵路的衝突
- 電子商務的最後一公里配送基礎設施3
第4章:競爭格局
- 介紹
- 公司市佔率分析
- 主要市場參與者的競爭分析
- 競爭定位矩陣
- 戰略展望矩陣
- 關鍵進展
- 併購
- 合作夥伴關係與合作
- 新產品發布
- 擴張計劃和資金
第5章:市場估算與預測:依運輸方式分類,2021-2034年
- 鐵路和公路運輸
- 航空和公路運輸
- 海運和公路運輸
- 其他
第6章:市場估算與預測:依中心分類,2021-2034年
- 海港多式聯運樞紐
- 鐵路-公路聯運站
- 內陸港/內陸貨櫃堆場(ICD)
- 航空貨運多式聯運樞紐
- 城市多式聯運物流中心
第7章:市場估算與預測:依最終用途分類,2021-2034年
- 製造業
- 石油和天然氣
- 建造
- 消費品和零售
- 汽車
- 食品和飲料
- 製藥和醫療保健
- 其他
第8章:市場估算與預測:依營運模式分類,2021-2034年
- 公共/政府營運
- 私營
- PPP(公私合營)
- 特許經營/BOT
- 第三方/第四方物流營運
第9章:市場估算與預測:依自動化程度分類,2021-2034年
- 傳統/手動輪轂
- 半自動化樞紐
- 全自動
第10章:市場估算與預測:以吞吐量計算,2021-2034年
- 低容量
- 中型容量
- 高容量
- 巨型樞紐
第11章:市場估計與預測:按地區分類,2021-2034年
- 北美洲
- 美國
- 加拿大
- 歐洲
- 德國
- 英國
- 法國
- 義大利
- 西班牙
- 俄羅斯
- 北歐
- 亞太地區
- 中國
- 印度
- 日本
- 澳洲
- 韓國
- 菲律賓
- 印尼
- 拉丁美洲
- 巴西
- 墨西哥
- 阿根廷
- MEA
- 南非
- 沙烏地阿拉伯
- 阿拉伯聯合大公國
第12章:公司簡介
- 全球參與者
- APM Terminals (AP Moller-Maersk)
- BNSF Railway
- CH Robinson Worldwide
- Canadian National Railway
- China Merchants Port
- CMA CGM Terminal Link
- COSCO SHIPPING Ports
- DHL Global
- DP World
- Hutchison Ports
- JB Hunt Transport Services
- Kalmar
- Konecranes
- Kuehne + Nagel
- Maersk Line
- MSC Terminal & Logistics (TIL)
- Navis
- PSA International
- Union Pacific Railroad
- Zebra Technologies
- 區域玩家
- Georgia Ports Authority
- Mi-Jack Products
- Port of Los Angeles
- Port of Rotterdam
- Port of Singapore Authority (MPA)
- South Carolina Ports Authority
- Tideworks Technology
- Virginia Port Authority
- Norfolk Southern
- 新興參與者
- Kaleris
- Portchain
- TuSimple
The Global Intermodal Transportation Hubs Market was valued at USD 47.58 billion in 2024 and is estimated to grow at a CAGR of 9.3% to reach USD 114.79 billion by 2034.
Growth is shaped by a worldwide shift toward freight systems that can seamlessly combine rail, road, air, and maritime networks into a coordinated logistics ecosystem. Modern intermodal hubs allow cargo operators, infrastructure developers, and supply chain organizations to move shipments more efficiently by reducing dependence on a single mode. This model lowers transportation expenses, shortens delivery windows, and increases overall routing flexibility. Rising global trade activity, expanding cross-border operations, and the acceleration of e-commerce continue to amplify the need for multimodal connectivity supported by strong digital tracking and smooth handoffs between transport modes. Supply chains that handle high-volume industrial flows also require dependable, resilient routes, pushing demand for hubs that can manage complex freight transitions with better visibility and reliability. Momentum is further reinforced by global sustainability goals, large-scale infrastructure upgrades, and the push for low-emission logistics. The rapid development of clean energy systems, electric vehicle freight solutions, and critical mineral transport networks is creating opportunities for long-distance freight optimization. Intermodal nodes help streamline these flows by combining the efficiency of rail and maritime transport with road-based flexibility for final delivery.
| Market Scope | |
|---|---|
| Start Year | 2024 |
| Forecast Year | 2025-2034 |
| Start Value | $47.58 Billion |
| Forecast Value | $114.79 Billion |
| CAGR | 9.3% |
The rail and road transport segment held a 52.58% share in 2024 and is projected to grow at a CAGR of 9.6% through 2034. This segment remains dominant because the combination of rail for long-distance freight and road for flexible local distribution allows operators to reduce transit time and keep operating costs predictable. Railroad connectivity remains central to industrial corridors, supporting the movement of bulk materials, manufactured goods, parts, and consumer products with consistent reliability.
The manufacturing segment held a 27.2% share in 2024 and is expected to grow at a CAGR of 9.4% from 2025 to 2034. Manufacturers rely heavily on intermodal hubs to move high volumes of raw materials and finished products efficiently. Integrated rail, road, and port networks help reduce bottlenecks, stabilize delivery schedules, and improve cost control for sectors including machinery, automotive, electronics, and heavy equipment. The ability to manage standardized containers and heavy freight loads strengthens the segment's leadership position.
US Intermodal Transportation Hubs Market held an 85% share, generating USD 13.97 billion in 2024. Continued investment in expanding rail capacity, automating terminals, and modernizing port infrastructure is driving strong adoption nationwide. Growing e-commerce activity, manufacturing output, and cross-border trade within the region are pushing demand for multimodal connectivity that improves visibility and reduces delays. Advanced digital tools, including IoT monitoring, RFID-based freight tracking, and integrated logistics software, are becoming central to optimizing cargo coordination across major US hubs.
Major companies active in the Global Intermodal Transportation Hubs Market include BNSF Railway, C.H. Robinson Worldwide, DHL Global, DP World, J.B. Hunt Transport Services, Kuehne + Nagel, Maersk Line, Norfolk Southern, PSA International, and Union Pacific Railroad. Companies competing in the Intermodal Transportation Hubs Market are strengthening their position by expanding multimodal infrastructure, enhancing cargo visibility technologies, and forming strategic partnerships with logistics providers. Many are investing in automated terminals, digital freight platforms, and analytics-driven routing tools that streamline container handling and accelerate turnaround times. Firms also prioritize integrating IoT tracking, smart yard management systems, and cloud-based coordination tools to improve transparency throughout the supply chain. Collaborative agreements with rail operators, port authorities, and trucking networks help optimize cross-modal transitions and stabilize capacity during peak demand.
Table of Contents
Chapter 1 Methodology
- 1.1 Market scope and definition
- 1.2 Research design
- 1.2.1 Research approach
- 1.2.2 Data collection methods
- 1.3 Data mining sources
- 1.3.1 Global
- 1.3.2 Regional/Country
- 1.4 Base estimates and calculations
- 1.4.1 Base year calculation
- 1.4.2 Key trends for market estimation
- 1.5 Primary research and validation
- 1.5.1 Primary sources
- 1.6 Forecast model
- 1.7 Research assumptions and limitations
Chapter 2 Executive Summary
- 2.1 Industry 360° synopsis, 2021 - 2034
- 2.2 Key market trends
- 2.2.1 Regional
- 2.2.2 Transportation mode
- 2.2.3 Hub
- 2.2.4 End Use
- 2.2.5 Operation Model
- 2.2.6 Automation Level
- 2.2.7 Throughput Capacity
- 2.3 TAM Analysis, 2026-2034
- 2.4 CXO perspectives: Strategic imperatives
- 2.4.1 Executive decision points
- 2.4.2 Critical success factors
- 2.5 Future outlook and strategic recommendations
Chapter 3 Industry Insights
- 3.1 Industry ecosystem analysis
- 3.1.1 Supplier landscape
- 3.1.2 Profit margin analysis
- 3.1.3 Cost structure
- 3.1.4 Value addition at each stage
- 3.1.5 Factor affecting the value chain
- 3.1.6 Disruptions
- 3.2 Industry impact forces
- 3.2.1 Growth drivers
- 3.2.1.1 Rapid expansion of cross-border trade & global supply chains
- 3.2.1.2 Increase in government investments in rail corridors, smart ports, and multimodal logistics parks
- 3.2.1.3 Surge in e-commerce and retail distribution
- 3.2.1.4 Increase in industrial corridors, SEZs, and smart city developments
- 3.2.1.5 Rise in sustainability and emission-reduction mandates
- 3.2.2 Industry pitfalls and challenges
- 3.2.2.1 High capital expenditure for terminal construction & automation
- 3.2.2.2 Operational fragmentation between multiple transport modes
- 3.2.3 Market opportunities
- 3.2.3.1 Rise in adoption of AI-driven terminal operating systems (TOS)
- 3.2.3.2 Increase in development of strategic trade corridors
- 3.2.3.3 Surge in demand for electrified and automated cargo-handling equipment
- 3.2.3.4 Rise in deployment of digital customs, blockchain, and smart gate systems
- 3.2.1 Growth drivers
- 3.3 Growth potential analysis
- 3.4 Regulatory landscape
- 3.4.1 North America
- 3.4.2 Europe
- 3.4.3 Asia Pacific
- 3.4.4 Latin America
- 3.4.5 MEA
- 3.5 Porter's analysis
- 3.6 PESTEL analysis
- 3.7 Technology and Innovation landscape
- 3.7.1 Current technological trends
- 3.7.1.1 Automation & robotics in cargo handling
- 3.7.1.2 Digital twin & simulation technologies
- 3.7.1.3 Iot & sensor networks for asset tracking
- 3.7.2 Emerging technologies
- 3.7.2.1 Artificial intelligence & predictive analytics
- 3.7.2.2 Blockchain for documentation & traceability
- 3.7.2.3 5g connectivity & edge computing
- 3.7.1 Current technological trends
- 3.8 Patent analysis
- 3.9 Price trends
- 3.9.1 By region
- 3.9.2 By type
- 3.10 Cost breakdown analysis
- 3.11 Business Case & ROI Analysis
- 3.11.1 Total cost of ownership framework
- 3.11.2 ROI calculation methodologies
- 3.11.3 Implementation timeline & milestones
- 3.11.4 Risk assessment & mitigation strategies
- 3.12 Sustainability and environmental impact analysis
- 3.12.1 Sustainable practices
- 3.12.2 Waste reduction strategies
- 3.12.3 Energy efficiency in production
- 3.12.4 Eco-friendly initiatives
- 3.12.5 Carbon footprint considerations
- 3.13 Investment & Funding Analysis
- 3.13.1 Infrastructure investment & jobs act (IIJA) impact
- 3.13.2 Public-private partnership (PPP) models
- 3.13.3 Private equity & venture capital activity
- 3.13.4 Green finance & sustainability-linked funding
- 3.14 Infrastructure capacity utilization & bottleneck analysis
- 3.14.1 Port congestion metrics & dwell time analysis
- 3.14.2 Rail terminal capacity constraints
- 3.14.3 Chassis availability & pool management challenges
- 3.14.4 Gate processing throughput limitations
- 3.14.5 On-dock rail capacity vs. Demand gap
- 3.14.6 Storage yard utilization rates
- 3.14.7 Peak season surge capacity requirements
- 3.14.8 Intermodal connector bottleneck identification
- 3.15 Landside accessibility & first/last-mile infrastructure connectivity
- 3.15.1 Intermodal connector program (FHWA) investment priorities
- 3.15.2 Grade-separated crossings & congestion relief projects
- 3.15.3 Drayage trucking capacity & driver shortages
- 3.15.4 Urban freight corridors & truck route restrictions
- 3.15.5 Rail network capacity & class i railroad congestion
- 3.15.6 Short-line railroad connectivity & infrastructure condition
- 3.15.7 Dedicated freight corridors & high-speed rail conflicts
- 3.15.8 Last-mile delivery infrastructure for e-commerc3
Chapter 4 Competitive Landscape, 2024
- 4.1 Introduction
- 4.2 Company market share analysis
- 4.2.1 North America
- 4.2.2 Europe
- 4.2.3 Asia Pacific
- 4.2.4 Latin America
- 4.2.5 MEA
- 4.3 Competitive analysis of major market players
- 4.4 Competitive positioning matrix
- 4.5 Strategic outlook matrix
- 4.6 Key developments
- 4.6.1 Mergers & acquisitions
- 4.6.2 Partnerships & collaborations
- 4.6.3 New Product Launches
- 4.6.4 Expansion Plans and funding
Chapter 5 Market Estimates & Forecast, By Transportation Mode, 2021 - 2034 ($Bn, TEU)
- 5.1 Key trends
- 5.2 Rail and road transport
- 5.3 Air and road transport
- 5.4 Maritime and road transport
- 5.5 Others
Chapter 6 Market Estimates & Forecast, By Hub, 2021 - 2034 ($Bn, TEU)
- 6.1 Key trends
- 6.2 Seaport Intermodal Hubs
- 6.3 Rail-Road Intermodal Terminals
- 6.4 Dry Ports / Inland Container Depots (ICDs)
- 6.5 Air Cargo Intermodal Hubs
- 6.6 Urban Multimodal Logistics Centers
Chapter 7 Market Estimates & Forecast, By End Use, 2021 - 2034 ($Bn, TEU)
- 7.1 Key trends
- 7.2 Manufacturing
- 7.3 Oil & gas
- 7.4 Construction
- 7.5 Consumer goods and retail
- 7.6 Automotive
- 7.7 Food and beverages
- 7.8 Pharmaceuticals and healthcare
- 7.9 Others
Chapter 8 Market Estimates & Forecast, By Operation Model, 2021 - 2034 ($Bn, TEU)
- 8.1 Key trends
- 8.2 Public/Government-Operated
- 8.3 Private-Operated
- 8.4 PPP (Public-Private Partnership)
- 8.5 Concession-Based / BOT
- 8.6 3PL / 4PL Operated
Chapter 9 Market Estimates & Forecast, By Automation Level, 2021 - 2034 ($Bn, TEU)
- 9.1 Key trends
- 9.2 Conventional / Manual Hubs
- 9.3 Semi-Automated Hubs
- 9.4 Fully Automated
Chapter 10 Market Estimates & Forecast, By Throughput Capacity, 2021 - 2034 ($Bn, TEU)
- 10.1 Key trends
- 10.2 Low Capacity
- 10.3 Medium Capacity
- 10.4 High Capacity
- 10.5 Mega Hubs
Chapter 11 Market Estimates & Forecast, By Region, 2021 - 2034 ($Bn, TEU)
- 11.1 Key trends
- 11.2 North America
- 11.2.1 US
- 11.2.2 Canada
- 11.3 Europe
- 11.3.1 Germany
- 11.3.2 UK
- 11.3.3 France
- 11.3.4 Italy
- 11.3.5 Spain
- 11.3.6 Russia
- 11.3.7 Nordics
- 11.4 Asia Pacific
- 11.4.1 China
- 11.4.2 India
- 11.4.3 Japan
- 11.4.4 Australia
- 11.4.5 South Korea
- 11.4.6 Philippines
- 11.4.7 Indonesia
- 11.5 Latin America
- 11.5.1 Brazil
- 11.5.2 Mexico
- 11.5.3 Argentina
- 11.6 MEA
- 11.6.1 South Africa
- 11.6.2 Saudi Arabia
- 11.6.3 UAE
Chapter 12 Company Profiles
- 12.1 Global Players
- 12.1.1 APM Terminals (A.P. Moller-Maersk)
- 12.1.2 BNSF Railway
- 12.1.3 C.H. Robinson Worldwide
- 12.1.4 Canadian National Railway
- 12.1.5 China Merchants Port
- 12.1.6 CMA CGM Terminal Link
- 12.1.7 COSCO SHIPPING Ports
- 12.1.8 DHL Global
- 12.1.9 DP World
- 12.1.10 Hutchison Ports
- 12.1.11 J.B. Hunt Transport Services
- 12.1.12 Kalmar
- 12.1.13 Konecranes
- 12.1.14 Kuehne + Nagel
- 12.1.15 Maersk Line
- 12.1.16 MSC Terminal & Logistics (TIL)
- 12.1.17 Navis
- 12.1.18 PSA International
- 12.1.19 Union Pacific Railroad
- 12.1.20 Zebra Technologies
- 12.2 Regional Players
- 12.2.1 Georgia Ports Authority
- 12.2.2 Mi-Jack Products
- 12.2.3 Port of Los Angeles
- 12.2.4 Port of Rotterdam
- 12.2.5 Port of Singapore Authority (MPA)
- 12.2.6 South Carolina Ports Authority
- 12.2.7 Tideworks Technology
- 12.2.8 Virginia Port Authority
- 12.2.9 Norfolk Southern
- 12.3 Emerging Players
- 12.3.1 Kaleris
- 12.3.2 Portchain
- 12.3.3 TuSimple
 2034年線下交通樞紐市場預測-按樞紐類型、服務內容、所有權/營運模式、最終用戶和區域分類的全球分析
 多式聯運市場報告:按組成部分、運輸方式、最終用戶和地區分類(2026-2034 年)
 多式聯運市場:依服務、運輸方式、貨物類型及最終用戶產業分類-2026-2032年全球市場預測
 2026年全球多式聯運貨運市場報告
 2026-2030年全球多式聯運貨運市場日本貨運市場規模、佔有率、趨勢及預測(按交付類型、運輸方式、最終用途和地區分類),2026-2034年按貨物類型、港口類型、所有權類型、服務類型和應用分類的航運和港口市場 - 2026-2032 年全球預測
 多式聯運:市場佔有率分析、產業趨勢與統計、成長預測(2026-2031)2032 年多式聯運市場預測:按服務類型、解決方案類型、運輸方式、貨櫃類型、最終用戶和地區進行的全球分析
 2026 年至 2032 年運輸管理軟體市場(按模式、功能、最終用戶和地區分類)