


 |
市場調查報告書
商品編碼
1910830
出行即服務 (MaaS) – 市場佔有率分析、產業趨勢與統計資料、成長預測 (2026-2031)Mobility As A Service - Market Share Analysis, Industry Trends & Statistics, Growth Forecasts (2026 - 2031) |
||||||
※ 本網頁內容可能與最新版本有所差異。詳細情況請與我們聯繫。
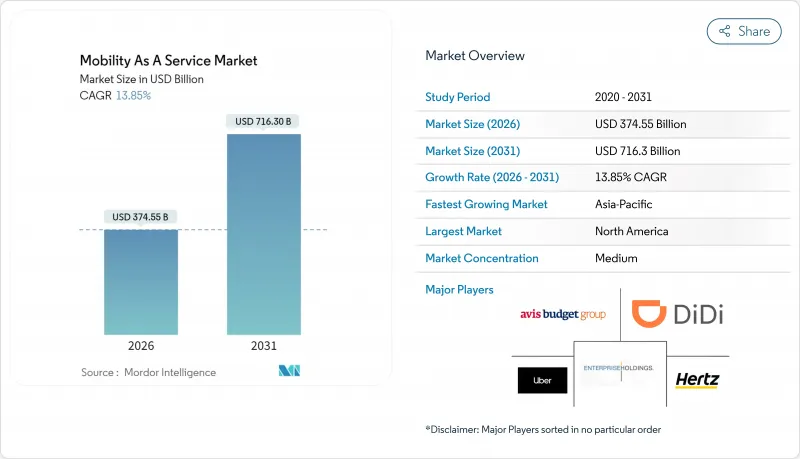
預計出行即服務 (MaaS) 市場將從 2025 年的 3,289.8 億美元成長到 2026 年的 3,745.5 億美元,到 2031 年達到 7,163 億美元,2026 年至 2031 年的複合年成長率為 13.85%。
在都市區成長、智慧型手機普及率持續上升以及環保意識增強的推動下,消費者正從擁有私家車轉向綜合、共用和多模態的交通服務。 API標準化、電動和氫動力技術的應用以及無縫支付創新正在加速跨平台互通性,改善客戶體驗並實現服務提供者收入來源多元化。政策制定者優先考慮公私合營,並推動零排放目標,以鼓勵電動車的大規模普及。同時,5G和物聯網的升級正在實現即時車隊管理和預測性出行管理。老牌叫車巨頭與新興的專業旅遊即服務(MaaS)營運商之間日益激烈的競爭,促使各方大力投資人工智慧、數據貨幣化和訂閱模式,以求脫穎而出。
全球出行即服務 (MaaS) 市場趨勢與洞察
將微型交通與公共運輸整合到歐洲城市
微出行與傳統公共交通系統的無縫融合正在建構多模態網路,並顯著改善「最後一公里」和「首公里」的交通連接。赫爾辛基和維也納等歐洲城市走在前列,其公共運輸部門積極將共享單車和電動Scooter服務納入綜合出行平台。這種融合已取得顯著成效;國際交通論壇報告稱,整合良好的微出行服務可將城市走廊的公共運輸客流量提高高達35%。最成功的案例包括:在交通樞紐附近策略性地設置標準化停靠站、統一的支付系統以及即時可用性資料。除了改善交通便利性外,這種融合也在重塑城市規劃的優先事項。巴塞隆納等城市正在重新設計道路基礎設施,以創建與公共交通站點直接相連的專用微出行車道。
政府零排放目標推動以電動車為中心的出行即服務 (MaaS) 包裝
亞太地區及其他地區嚴格的排放目標正在推動以電動車為中心的出行即服務(MaaS)的發展,這些服務將電動車網約車、電動車共享和電動自行車租賃整合到一個全面的出行方案中。繼中國要求在2030年實現40%的汽車保有量為電動車之後,滴滴出行等公司推出了「綠色聯盟」出行即服務套餐,僅提供零排放出行服務。這些以電動車為中心的出行服務正獲得顯著成長,TÜV南德意志集團的報告顯示,與傳統汽車相比,電動出行服務可將城市交通排放減少高達70%。
美國各州法規結構的分割
由於美國各州交通法規的差異,出行即服務 (MaaS) 提供者在全國擴張時面臨巨大的營運挑戰。每個州都制定了不同的許可要求、保險義務和營運限制。這種監管上的割裂迫使企業為每個州開發專門的營運模式,從而顯著增加了合規成本並減緩了市場滲透速度。美國聯邦公路管理局指出,由於缺乏監管協調,在多個州運營的 MaaS 提供者的營運成本比在法規環境更為統一的地區運營的提供者高出 35%。
細分市場分析
憑藉其龐大的用戶群和廣泛的司機網路,叫車服務保持著市場領先地位,預計到2025年將以45.85%的市場佔有率主導出行即服務(MaaS)市場。然而,微出行服務(共享Scooter/自行車)正迅速崛起為成長最快的細分市場,預計2026年至2031年將以19.12%的複合年成長率成長,這主要得益於其在解決「最後一公里」出行難題方面的顯著優勢。根據IAA出行報告,配備物聯網連接和高效能電池的微出行解決方案顯著提升了用戶體驗,提高了可靠性並實現了即時使用情況追蹤。此外,地方政府不斷擴大專用微出行車道和停車區域的基礎設施建設,也進一步推動了這一成長。
汽車共享領域正經歷著顯著的創新,靈活的自由浮動模式的引入消除了固定上下車地點的需求;與此同時,公車共享服務在企業和校園環境中越來越受歡迎。儘管在某些市場面臨監管方面的挑戰,但由於實施成本低、用戶接受度高,共享Scooter領域仍在快速擴張。
到2025年,技術平台將以37.72%的市佔率引領該領域,因為它們是實現服務整合和使用者介面的基礎架構。同時,支付和錢包解決方案將成為成長最快的領域,2026年至2031年的複合年成長率將達到20.95%,因為它們消除了多模態出行體驗中的關鍵摩擦點。開放回路支付系統的出現尤其具有變革性意義,PaymentGenes的報告顯示,採用這些系統的出行即服務(MaaS)平台的用戶採納率比使用閉合迴路系統的平台高出40%。這些系統使用戶無需預先充值或在不同的服務中維護多種支付方式。
隨著人工智慧的整合,行程規劃和導航解決方案不斷發展,人工智慧可以預測中斷情況並即時提案替代方案;連接和遠端資訊處理解決方案增強了車輛追蹤和車隊管理能力;保險支援服務也在不斷擴展,以滿足共用出行用戶的獨特需求。
預計到2025年,乘用車將維持56.63%的市場佔有率,這意味著叫車和共享汽車服務將在出行即服務(MaaS)生態系統中繼續發揮重要作用。然而,自動駕駛艙預計將在2026年至2031年間實現最高的複合年成長率(CAGR),達到22.74%,因為它們在可控環境和「最後一公里」出行方面提供了極具吸引力的解決方案。發表在IEEE智慧交通系統雜誌上的一項研究表明,與傳統的固定路線交通相比,自動駕駛模組化車輛技術可以降低高達40%的營運成本,同時提高服務的柔軟性。這些自動駕駛艙在校園、商業園區和規劃完善的社區等基礎設施可最佳化以適應自動駕駛的場所將特別有效。
微型交通工具(電動自行車、電動Scooter)的市場佔有率持續成長,尤其是在人口密集的都市區,它們憑藉卓越的操控性和便利性的停車條件脫穎而出。隨著按需出行演算法的引入,接駁車和公車也在不斷發展,這些演算法能夠最佳化乘客效率並減少等待時間。
區域分析
亞太地區憑藉其人口密集的城市、先進的數位支付和協調的基礎設施投資,預計將在2025年佔據出行即服務(MaaS)市場34.12%的佔有率。在中國,主要大都市地區的車輛登記限制正促使通勤者轉向共用平台;而在印度,不斷壯大的中產階級正在接受價格合理的叫車服務。新加坡的「智慧國家計畫」將公共交通、微出行和統一支付整合到一個市民應用程式中,展現了最佳的整合實踐。
北美是全球第二大共享旅遊市場。高昂的車輛擁有成本、都市區密度增加以及企業差旅的永續性要求正在推動共用出行的發展,但各州監管政策的差異正在減緩全國性平台的規模擴張。舊金山、奧斯汀和多倫多等城市的技術領先地位正在推動預測分析和自動駕駛試點計畫的早期應用。政府對電動車隊的激勵措施也進一步強化了該地區的出行轉型。
預計中東和非洲將成為該地區成長最快的地區,到2031年複合年成長率將達到14.05% 。波灣合作理事會(GCC)各國政府正將出行即服務(MaaS)優先納入NEOM和Eksports City等智慧城市大型企劃中,並投入資金自動駕駛接駁車和綜合票價系統。阿卜杜勒·拉蒂夫·賈米爾和Joby Aviation簽署了一份合作備忘錄,計劃部署多達200架電動垂直起降飛機,以擴展地面服務並加強多模態網路,這標誌著空中運輸新的雄心壯志。
其他福利
- Excel格式的市場預測(ME)表
- 3個月的分析師支持
目錄
第1章 引言
- 研究假設和市場定義
- 調查範圍
第2章調查方法
第3章執行摘要
第4章 市場情勢
- 市場概覽
- 市場促進因素
- 將微型交通與公共運輸整合到歐洲城市
- 政府零排放目標推動以電動車為中心的旅遊即服務 (MaaS) 套餐(亞太地區)
- 透過 API 標準化(NeTEx、GTFS-RT)實現基於帳戶的票務系統
- 拉丁美洲MaaS超級創業投資資金籌措激增
- 基於5G/IoT的即時移動性編配
- 北美企業差旅永續性要求
- 市場限制
- 美國各州法規結構碎片化
- GDPR/CCPA 資料隱私合規成本
- 由於對駕駛人和運營商的補貼,盈利面臨挑戰。
- 由於傳統交通運輸資訊系統造成的整合深度限制
- 價值/供應鏈分析
- 監理展望
- 技術展望
- 波特五力分析
- 買方和消費者的議價能力
- 供應商的議價能力
- 新進入者的威脅
- 替代品的威脅
- 競爭對手之間的競爭
第5章 市場規模及成長預測(價值(美元))
- 按服務類型
- 共乘
- 汽車共享
- 自行車共享
- 共享Scooter
- 共乘
- 透過解決方案
- 技術平台
- 支付和錢包
- 行程規劃和導航
- 互聯互通和遠端資訊處理
- 保險和支援服務
- 按車輛類型
- 搭乘用車
- 微型交通工具(電動自行車、電動Scooter)
- 接駁巴士和當地巴士
- 自動駕駛艙
- 透過交通工具
- 面向大眾
- 私人的
- 按經營模式
- 訂閱服務(行動套餐、企業套餐)
- 付費使用制
- P2P
- 僅限門票銷售聚合器
- 透過使用
- 個人出行
- 商務/企業流動性
- 物流和最後一公里配送
- 最終用戶
- 個人
- 公司
- 政府和地方政府機構
- 按作業系統
- iOS
- Android
- 其他
- HarmonyOS
- KaiOS
- Windows/PWA
- 透過推進力
- 內燃機(ICE)
- 電動車
- 混合
- 氫燃料電池
- 按地區
- 北美洲
- 美國
- 加拿大
- 墨西哥
- 北美其他地區
- 歐洲
- 德國
- 英國
- 法國
- 西班牙
- 義大利
- 北歐國家
- 其他歐洲
- 亞太地區
- 中國
- 印度
- 日本
- 韓國
- 澳洲
- 其他亞洲地區
- 南美洲
- 巴西
- 智利
- 南美洲其他地區
- 中東和非洲
- 沙烏地阿拉伯
- 阿拉伯聯合大公國
- 埃及
- 土耳其
- 南非
- 其他中東和非洲地區
- 北美洲
第6章 競爭情勢
- 市場集中度
- 策略趨勢
- 市佔率分析
- 公司簡介
- Uber Technologies Inc.
- Didi Chuxing
- Lyft Inc.
- Grab Holdings Ltd.
- FREE NOW(GMBH)
- Bolt Technology OU
- MaaS Global(Whim)
- Moovit Inc.
- Citymapper Ltd.
- Via Transportation Inc.
- Beeline Mobility
- UbiGo AB
- Tier Mobility SE
- Lime Technology Inc.
- Bird Global Inc.
- Bridj Technology Pty Ltd.
- Zipcar(AVIS Budget Group)
- The Hertz Corporation
- Enterprise Holdings Inc.
- Free2Move(STELLANTIS)
- BlaBlaCar(Comuto SA)
- Gojek(GoTo Group)
- Uber Technologies Inc.
- 市場機會與未來展望
- 空白空間與未滿足需求評估
- Government-Funded MaaS Vouchers for Low-Income Commuters
- Carbon-Credit Trading Linked to MaaS Usage Data
- AI-Driven Dynamic Fare Bundling and Personalised Subscriptions
- B2B Fleet Electrification Partnerships with OEMs
- 自主按需接駁車網路展望 ~ 2028 年
- Insurance-as-a-Service Platforms Tailored for MaaS Operators
- 空白空間與未滿足需求評估
The mobility as a service market is expected to grow from USD 328.98 billion in 2025 to USD 374.55 billion in 2026 and is forecast to reach USD 716.3 billion by 2031 at 13.85% CAGR over 2026-2031.
Strong urban population growth, continuous smartphone adoption, and heightened environmental awareness are shifting consumers from private vehicle ownership toward integrated, shared, and multimodal transport offerings. API standardization, electric and hydrogen propulsion adoption, and seamless payment innovation are accelerating platform interoperability, improving customer experience, and driving provider revenue diversification. Policymakers are pushing zero-emission goals that prioritize public-private partnerships and stimulate large-scale deployments of electric fleets, while 5G and IoT upgrades enable real-time fleet orchestration and predictive journey management. Intensifying competition between incumbent ride-hailing leaders and emerging specialized MaaS orchestrators is prompting aggressive investment in artificial intelligence, data monetization, and subscription models as companies seek defensible differentiation.
Global Mobility As A Service Market Trends and Insights
Integration of Micro-Mobility and Public Transit Across European Cities
The seamless integration of micro-mobility options with traditional public transit systems creates multimodal transportation networks that significantly enhance first-mile/last-mile connectivity. European cities like Helsinki and Vienna are pioneering this integration, with public transport authorities actively incorporating bike-sharing and e-scooter services into unified mobility platforms. This integration is yielding remarkable results, with the International Transport Forum reporting that properly integrated micro-mobility can increase public transit ridership by up to 35% in urban corridors.The most successful implementations feature standardized docking stations strategically positioned near transit hubs, unified payment systems, and real-time availability data. Beyond improving transit accessibility, this integration is reshaping urban planning priorities, with cities like Barcelona redesigning street infrastructure to accommodate micro-mobility lanes that connect directly to transit stations.
Government Zero-Emission Targets Fueling EV-Centric MaaS Bundles
Stringent emission reduction targets across regions such as Asia-Pacific are catalyzing the development of electric vehicle-focused MaaS offerings that combine EV ride-hailing, electric car-sharing, and e-bike rentals into comprehensive mobility packages. China's mandate for 40% of vehicles to be electric by 2030 has prompted companies like Didi to launch "Green Alliance" MaaS bundles that exclusively feature zero-emission transportation options. These EV-centric services are gaining significant traction, with TUV SUD reporting that electric mobility services can reduce urban transport emissions by up to 70% compared to conventional vehicle usage
Fragmented Regulatory Frameworks Across U.S. States
The inconsistent patchwork of transportation regulations across U.S. states is creating significant operational challenges for MaaS providers attempting to scale nationally. Each state imposes different licensing requirements, insurance mandates, and operational restrictions. This regulatory fragmentation forces companies to develop state-specific operational models, substantially increasing compliance costs and slowing market penetration. The Federal Highway Administration highlights that this lack of regulatory harmonization has resulted in up to 35% higher operational costs for multi-state MaaS providers than those operating in more unified regulatory environments.
Other drivers and restraints analyzed in the detailed report include:
- API Standardization (NeTEx, GTFS-RT) Enabling Account-Based Ticketing
- Surge in VC Funding for South America MaaS Super-Apps
- GDPR/CCPA-Driven Data-Privacy Compliance Costs
For complete list of drivers and restraints, kindly check the Table Of Contents.
Segment Analysis
Ride-hailing dominates the MaaS market with a 45.85% share in 2025, leveraging its established user base and extensive driver networks to maintain market leadership. However, micro-mobility services (scooter/bike sharing) are emerging as the fastest-growing segment with a projected CAGR of 19.12% from 2026 to 2031, driven by their effectiveness in addressing first-mile/last-mile connectivity challenges. The IAA Mobility report indicates that micro-mobility solutions equipped with IoT connectivity and high-performance batteries significantly enhance user experience through improved stability and real-time availability tracking. This growth is further supported by city governments increasingly allocating dedicated infrastructure for micro-mobility lanes and parking zones.
The car sharing segment is witnessing substantial innovation through the introduction of flexible, free-floating models that eliminate fixed pickup and drop-off locations, while bus sharing services are gaining traction in corporate environments and campus settings. The scooter sharing segment, despite regulatory challenges in some markets, is expanding rapidly due to its low implementation costs and high user adoption rates.
Technology platforms lead this segment with 37.72% market share in 2025, serving as the foundational infrastructure that enables service integration and user interface. Meanwhile, payment and wallet solutions are experiencing the fastest growth at a 20.95% CAGR (2026-2031), as they address a critical friction point in the multimodal journey experience. The emergence of open-loop payment systems is particularly transformative, with PaymentGenes reporting that MaaS platforms implementing these systems see up to 40% higher user retention compared to those using closed-loop systems. These systems eliminate the need for users to preload funds or maintain multiple payment methods across different services.
Trip planning and navigation solutions continue to evolve with the integration of artificial intelligence that can predict disruptions and suggest alternatives in real-time. Connectivity and telematics solutions are enabling enhanced vehicle tracking and fleet management capabilities, while insurance and support services are expanding to address the unique needs of shared mobility users.
Passenger cars maintain their dominance with 56.63% market share in 2025, reflecting the continued importance of ride-hailing and car-sharing services in the MaaS ecosystem. However, autonomous pods are projected to achieve the highest growth rate at 22.74% CAGR from 2026-2031, as they offer a compelling solution for controlled environments and first/last-mile connectivity. Research published in the IEEE Intelligent Transportation Systems Magazine demonstrates that autonomous modular vehicle technology can reduce operational costs by up to 40% compared to traditional fixed-route transit while improving service flexibility.These self-driving pods are particularly effective in campus environments, business parks, and planned communities where infrastructure can be optimized for autonomous operation.
Micro-mobility vehicles (e-bikes, e-scooters) continue to gain market share, particularly in dense urban areas where they offer superior maneuverability and parking convenience. Shuttles and buses are evolving with the introduction of on-demand routing algorithms that optimize occupancy rates and reduce wait times.
The Mobility As A Service Market Report is Segmented by Service Type (Ride-Hailing, Car Sharing, and More), Solution (Technology Platform, Payment and Wallet, and More), Vehicle Type (Passenger Cars, Shuttles and Buses, and More), Transportation Type (Public and Private), Business Model, Application, End-User, Operating System, Propulsion, and Geography. The Market Forecasts are Provided in Terms of Value (USD).
Geography Analysis
Asia-Pacific contributed 34.12% of the mobility as a service market share in 2025, capitalizing on dense cities, advanced digital payments, and coordinated infrastructure investments. China's restriction on vehicle registrations in major metros nudges commuters toward shared platforms, while India's expanding middle class embraces affordable ride-hailing. Singapore's Smart Nation blueprint integrates public transit, micro-mobility, and unified payments into a single citizen app that exemplifies best-practice integration.
North America ranks second in market size. High ownership costs, renewed urban densification, and corporate travel sustainability mandates propel shared mobility growth, though state-by-state regulatory divergence slows national platform scale. Technology leadership in San Francisco, Austin, and Toronto supports early adoption of predictive analytics and autonomous pilots. Government incentives for electric vehicle fleets further strengthen the region's mobility shift.
The Middle East and Africa presents the fastest regional expansion at 14.05% CAGR through 2031. Gulf Cooperation Council governments prioritize MaaS within smart-city megaprojects like NEOM and Expo City, allocating capital for autonomous shuttles and integrated fare systems. The Memorandum of Understanding between Abdul Latif Jameel and Joby Aviation to deploy up to 200 electric vertical take-off aircraft signals nascent aerial mobility ambition, augmenting ground-based services and reinforcing multimodal networks.
- Uber Technologies Inc.
Additional Benefits:
- The market estimate (ME) sheet in Excel format
- 3 months of analyst support
TABLE OF CONTENTS
1 Introduction
- 1.1 Study Assumptions and Market Definition
- 1.2 Scope of the Study
2 Research Methodology
3 Executive Summary
4 Market Landscape
- 4.1 Market Overview
- 4.2 Market Drivers
- 4.2.1 Integration of Micro-Mobility and Public Transit Across European Cities
- 4.2.2 Government Zero-Emission Targets Fueling EV-Centric MaaS Bundles (Asia-Pacific)
- 4.2.3 API Standardization (NeTEx, GTFS-RT) Enabling Account-Based Ticketing
- 4.2.4 Surge in VC Funding for LatAm MaaS Super-Apps
- 4.2.5 5G/IoT-Driven Real-Time Mobility Orchestration
- 4.2.6 Corporate Travel Sustainability Mandates in North America
- 4.3 Market Restraints
- 4.3.1 Fragmented Regulatory Frameworks Across U.S. States
- 4.3.2 GDPR/CCPA-Driven Data-Privacy Compliance Costs
- 4.3.3 Profitability Challenges from Driver/Provider Subsidies
- 4.3.4 Legacy Transit IT Systems Limiting Integration Depth
- 4.4 Value / Supply-Chain Analysis
- 4.5 Regulatory Outlook
- 4.6 Technological Outlook
- 4.7 Porter's Five Forces Analysis
- 4.7.1 Bargaining Power of Buyers/Consumers
- 4.7.2 Bargaining Power of Suppliers
- 4.7.3 Threat of New Entrants
- 4.7.4 Threat of Substitute Products
- 4.7.5 Intensity of Competitive Rivalry
5 Market Size and Growth Forecasts (Value (USD))
- 5.1 By Service Type
- 5.1.1 Ride-Hailing
- 5.1.2 Car Sharing
- 5.1.3 Bike Sharing
- 5.1.4 Scooter Sharing
- 5.1.5 Bus Sharing
- 5.2 By Solution
- 5.2.1 Technology Platform
- 5.2.2 Payment and Wallet
- 5.2.3 Trip Planning and Navigation
- 5.2.4 Connectivity and Telematics
- 5.2.5 Insurance and Support Services
- 5.3 By Vehicle Type
- 5.3.1 Passenger Cars
- 5.3.2 Micro-Mobility Vehicles (E-Bikes, E-Scooters)
- 5.3.3 Shuttles and Buses
- 5.3.4 Autonomous Pods
- 5.4 By Transportation Type
- 5.4.1 Public
- 5.4.2 Private
- 5.5 By Business Model
- 5.5.1 Subscription (Mobility Bundles, Corporate Plans)
- 5.5.2 Pay-As-You-Go
- 5.5.3 Peer-to-Peer
- 5.5.4 Ticketing-Only Aggregator
- 5.6 By Application
- 5.6.1 Personal Mobility
- 5.6.2 Business/Corporate Mobility
- 5.6.3 Logistics and Last-Mile Delivery
- 5.7 By End-User
- 5.7.1 Individuals
- 5.7.2 Enterprises
- 5.7.3 Government and Municipal Agencies
- 5.8 By Operating System
- 5.8.1 iOS
- 5.8.2 Android
- 5.8.3 Others
- 5.8.3.1 HarmonyOS
- 5.8.3.2 KaiOS
- 5.8.3.3 Windows/PWAs
- 5.9 By Propulsion
- 5.9.1 Internal Combustion Engine (ICE)
- 5.9.2 Electric
- 5.9.3 Hybrid
- 5.9.4 Hydrogen Fuel-Cell
- 5.10 By Geography
- 5.10.1 North America
- 5.10.1.1 United States
- 5.10.1.2 Canada
- 5.10.1.3 Mexico
- 5.10.1.4 Rest of North America
- 5.10.2 Europe
- 5.10.2.1 Germany
- 5.10.2.2 United Kingdom
- 5.10.2.3 France
- 5.10.2.4 Spain
- 5.10.2.5 Italy
- 5.10.2.6 Nordics
- 5.10.2.7 Rest of Europe
- 5.10.3 Asia-Pacific
- 5.10.3.1 China
- 5.10.3.2 India
- 5.10.3.3 Japan
- 5.10.3.4 South Korea
- 5.10.3.5 Australia
- 5.10.3.6 Rest of Asia
- 5.10.4 South America
- 5.10.4.1 Brazil
- 5.10.4.2 Chile
- 5.10.4.3 Rest of South America
- 5.10.5 Middle East and Africa
- 5.10.5.1 Saudi Arabia
- 5.10.5.2 United Arab Emirates
- 5.10.5.3 Egypt
- 5.10.5.4 Turkey
- 5.10.5.5 South Africa
- 5.10.5.6 Rest of Middle East and Africa
- 5.10.1 North America
6 Competitive Landscape
- 6.1 Market Concentration
- 6.2 Strategic Moves
- 6.3 Market Share Analysis
- 6.4 Company Profiles (Includes Global Level Overview, Market Level Overview, Core Segments, Financials as Available, Strategic Information, Market Rank/Share for Key Companies, Products and Services, SWOT Analysis, and Recent Developments)
- 6.4.1 Uber Technologies Inc.
- 6.4.1.1 Didi Chuxing
- 6.4.1.2 Lyft Inc.
- 6.4.1.3 Grab Holdings Ltd.
- 6.4.1.4 FREE NOW (GMBH)
- 6.4.1.5 Bolt Technology OU
- 6.4.1.6 MaaS Global (Whim)
- 6.4.1.7 Moovit Inc.
- 6.4.1.8 Citymapper Ltd.
- 6.4.1.9 Via Transportation Inc.
- 6.4.1.10 Beeline Mobility
- 6.4.1.11 UbiGo AB
- 6.4.1.12 Tier Mobility SE
- 6.4.1.13 Lime Technology Inc.
- 6.4.1.14 Bird Global Inc.
- 6.4.1.15 Bridj Technology Pty Ltd.
- 6.4.1.16 Zipcar (AVIS Budget Group)
- 6.4.1.17 The Hertz Corporation
- 6.4.1.18 Enterprise Holdings Inc.
- 6.4.1.19 Free2Move (STELLANTIS)
- 6.4.1.20 BlaBlaCar (Comuto SA)
- 6.4.1.21 Gojek (GoTo Group)
- 6.4.1 Uber Technologies Inc.
- 6.5 Market Opportunities and Future Outlook
- 6.5.1 White-Space and Unmet-Need Assessment
- 6.5.1.1 Government-Funded MaaS Vouchers for Low-Income Commuters
- 6.5.1.2 Carbon-Credit Trading Linked to MaaS Usage Data
- 6.5.1.3 AI-Driven Dynamic Fare Bundling and Personalised Subscriptions
- 6.5.1.4 B2B Fleet Electrification Partnerships with OEMs
- 6.5.1.5 Autonomous On-Demand Shuttle Networks Post-2028
- 6.5.1.6 Insurance-as-a-Service Platforms Tailored for MaaS Operators
- 6.5.1 White-Space and Unmet-Need Assessment
 交通行動服務(MaaS) 市場:2026-2032 年全球市場預測(按服務類型、支付模式、提供者類型、車輛類型、出行模式、動力方式、經營模式和最終用戶分類)
 2026年全球多模態交通行動服務(MaaS)平台市場報告
 交通行動服務(MaaS) 市場報告:依服務類型、交通方式、應用平台、動力方式及地區分類 (2026–2034)2026年全球旅遊即服務市場報告
 綠色交通行動服務(MaaS) 市場:策略性洞察與預測 (2026–2031)
 2026-2030年全球旅遊即服務市場全球出行即服務市場規模、佔有率、趨勢和成長分析報告(2026-2034)交通行動服務(MaaS) 市場規模、佔有率、成長和全球產業分析:按類型、應用和地區分類的洞察,2026-2034 年預測
 全球在超當地語系化旅遊即服務 (MaaS) 市場預測至 2032 年:按車輛類型、經營模式、技術、服務類型、最終用戶和地區分類日本旅遊即服務市場規模、佔有率、趨勢及預測(依服務類型、交通類型、應用平台、動力類型及地區分類),2026-2034年