


 |
市場調查報告書
商品編碼
1910494
網路賭博:市場佔有率分析、產業趨勢與統計、成長預測(2026-2031)Online Gambling - Market Share Analysis, Industry Trends & Statistics, Growth Forecasts (2026 - 2031) |
||||||
※ 本網頁內容可能與最新版本有所差異。詳細情況請與我們聯繫。
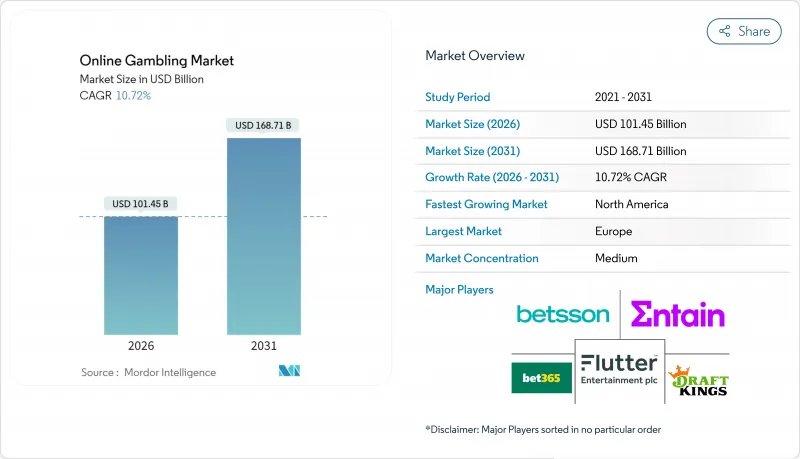
據估計,到 2026 年,線上賭博市場規模將達到 1,014.5 億美元,高於 2025 年的 916.3 億美元。預計到 2031 年,該市場規模將達到 1,687.1 億美元,2026 年至 2031 年的複合年成長率為 10.72%。
智慧型手機普及率的不斷提高、5G網路的廣泛部署以及主要司法管轄區監管協調的日益加強,正推動著向數位化管道的快速轉型。根據全球行動通訊系統協會(GSMA)報告,截至2024年,北美地區5G普及率達55%,位居全球第一,其次是大中華區。營運商正利用直播、人工智慧驅動的賠率引擎和雲端原生架構,打造出超越傳統實體場所身臨其境型體驗的線上博弈平台。即時資料饋送使營運商能夠為每場體育賽事管理數百個微型市場,從而提高投注頻率和平均投注額。在監管方面,各國政府正將受監管的線上博彩視為新的稅收來源,這不僅是疫情後的財政工具,也是灰色市場活動的可控替代方案,進一步推動了市場成長。
全球線上博彩市場趨勢與洞察
數位科技的進步
數位技術的進步正在重塑線上博弈業,使其從靜態的網頁平台演變為動態的、人工智慧驅動的生態系統,能夠即時最佳化每位用戶的體驗。透過人工智慧和機器學習,營運商可以分析投注模式、預測用戶行為,並以前所未有的精準度微調其產品和服務,從而獲得傳統營運商難以企及的競爭優勢。如今,平台開發以行動優先策略為主導,營運商投入資源開發漸進式Web應用程式和原生行動體驗,將主機級的遊戲體驗帶到智慧型手機上。 5G網路和邊緣運算的協同作用將延遲降低到接近零,從而實現真人荷官體驗和即時體育博彩,提供媲美線下體驗的優質服務。雲端基礎設施的採用使營運商能夠在遵守當地資料保留義務的同時,快速拓展跨司法管轄區的業務。隨著監管機構日益重視資料主權和消費者權益保護,這種合規性至關重要。
合法化和放鬆管制
放鬆管制是重塑全球線上博弈市場最重要的結構性因素。各國政府日益認可數位平台作為合法收入來源,並建立平衡經濟利益與消費者保護的架構。美國主導這項變革,逐州推動博彩合法化。全美州博彩立法者會議一直走在前列,制定了一項示範法案,將調整後總收入的稅率從15%統一到25%,確保營運商在可預測的環境中運作。巴西博彩管理局引用的巴西14.790/2023號法律,是新興市場監管成熟的典範。該法律要求業者將總部設在巴西,並遵守嚴格的負責任博彩通訊協定,同時每年創造約45億美元的稅收。阿拉伯聯合大公國商業博彩總局的成立標誌著中東地區博彩業的重要轉折點,並可能吸引更多持牌業者進駐,瞄準富裕且以旅遊業為主導的市場。同時,法國計劃在 2025 年前將線上賭場合法化,這標誌著整個歐洲市場將擴展到傳統體育博彩之外。法國經濟和財政部預測,這些新監管業務的收入可能會從 7.48 億歐元飆升至 15 億歐元。
高額稅收和許可證費用
高課稅和牌照費用構成了市場准入的巨大壁壘,迫使現有營運商提高營運效率,並透過整合和地理擴張來實現規模經濟。巴西的法規結構就體現了這一挑戰:根據巴西博彩和獎金局 (SPA) 的一份報告,根據 2023 年第 14790 號法律,營運商將從 2025 年 1 月起面臨 12% 的博彩總收入課稅和高達 600 萬美元的牌照費。這些要求造成了巨大的資本壁壘,並使大規模跨國業者比本土業者更具優勢。伊利諾伊州的累進課稅(一種根據運營商收入水平逐步提高稅率的製度)就是一個例子,該制度對成功的運營商施加了高額的實際稅率,抑制了市場成長並限制了其再投資能力。在某些地區,聯邦、州和地方稅收總合高達博彩總收入的 40%,迫使營運商削減行銷支出、限制獎金發放或提高莊家優勢以維持利潤率。不同司法管轄區的許可費用差異將影響營運商的策略,企業將優先考慮稅收條件優惠、監管流程高效的市場,而不是進行廣泛的地域擴張。
細分市場分析
截至2025年,體育博彩憑藉主流體育賽事的廣泛流行,佔據了52.05%的市場佔有率,佔據主導地位。在許多司法管轄區,體育博彩也比傳統賭場遊戲享有監管優勢。受體育聯盟擴張、全年投注日程安排以及電子競技博彩在年輕群體中日益成長的吸引力等因素推動,預計到2031年,體育博彩的複合年成長率將達到11.75%,超過整體市場成長率。賭場遊戲憑藉真人荷官和行動最佳化老虎機等創新技術持續蓬勃發展,而彩票產業則擁有強大的政府支持和穩固的消費群。賓果遊戲雖然受眾較小,但由於文化上的親和性,在英國和歐洲部分地區一直保持著穩定的受歡迎程度。
體育博彩的優勢在於其公認的技巧性以及社會認可度,這使其更容易獲得監管部門的核准並被消費者接受,尤其是在傳統賭場遊戲面臨重重阻礙的市場。足球博彩遙遙領先,其次是擁有完善基礎設施的賽馬和全年賽事不斷的網球。根據英國博彩委員會的數據,2022年4月至2023年3月期間,英國賽馬場的賽馬博彩年營業額超過2.38億英鎊,高於上年度的1.5186億英鎊。此外,將夢幻運動與社交博彩功能相結合,可以創造一種混合體驗,使營運商能夠豐富其產品,並滿足擁有不同偏好和風險接受度的更廣泛受眾的需求。
到2025年,行動和平板電腦平台將佔博彩市場佔有率的53.65%,這標誌著消費者趨勢的重大轉變。預計到2031年,行動和平板電腦平台的複合年成長率將達到13.65%,這凸顯了智慧型手機普及率的不斷提高以及向以行動端為中心的產品開發的策略轉變。雖然桌面平台對於需要多螢幕和高級分析工具的複雜投注和專業賭徒仍然至關重要,但新興技術正在其他平台上嶄露頭角。這些技術包括智慧型電視應用程式和語音啟動投注介面。透過採用行動優先策略,營運商正在利用生物識別、定位服務和推播通知等裝置特定功能,打造比傳統網頁版更具吸引力和安全性的使用者體驗。
行動平台的優勢遠不止於便利性。它提供了桌面端難以實現的即時互動機會,例如基於位置的推廣、社交共用功能以及擴增實境(AR) 功能,這些功能能夠提升體育賽事直播的觀看體驗。漸進式 Web 應用 (PWA) 的興起繞過了繁瑣的應用程式商店核准流程,簡化了使用者體驗。 PWA 提供類似原生應用程式的體驗,並可在各種作業系統和裝置上無縫運作。此外,行動支付和博彩平台的整合,打造了從存款、下注到提款的無縫用戶體驗,有效消除了先前阻礙行動博彩普及的障礙。
區域分析
到2025年,歐洲將佔全球收入的56.90%,達到驚人的521.5億美元。然而,由於成熟市場廣告監管趨嚴以及獎金上限的引入,該地區的複合年成長率(CAGR)正在停滯不前。德國寬鬆的監管立場和荷蘭基於績效的許可製度正促使灰色地帶的業者轉向受監管的平台。雖然這一趨勢有助於確保稅收收入,但也減緩了成長速度。同時,北歐國家正率先採取損失預防措施,利用人工智慧風險評分和強制性損失限額等工具。
北美監管政策的轉變正推動其以15.40%的年複合成長率強勁成長,使其成為成長最快的地區。美國州博彩立法者協會(NCLGS)報告稱,受12個州核准行動體育博彩的推動,美國博彩總規模預計將從2024年的930億美元飆升至2025年的1100億美元。安大略省的自由化市場模式特別引人注目,其首年收入就超過14億加元(11億美元)。北美線上博彩市場蓬勃發展,跨境併購活動頻繁,例如DraftKings收購Jackpocket,凸顯了用戶群和先進技術的激烈競爭。
亞太地區面臨潛力巨大但政策分散的局面。菲律賓博彩娛樂公司(PAGCOR)退出境外牌照業務削弱了該地區作為博彩中心的地位。在印度,各邦的監管力道不一,有的寬鬆,有的嚴格。然而,隨著行動裝置的普及和電子錢包的日益普及,監管協調有望帶來可觀的成長前景。
拉丁美洲的成功取決於巴西計劃於2025年1月開放市場。儘管諸如本地總部要求和12%的營業總收入課稅等條件構成挑戰,但巴西龐大的消費市場極具吸引力,不容忽視。阿根廷和哥倫比亞的例子表明,州或聯邦層級的監管清晰度如何帶來穩定的稅收來源。
在中東和非洲地區,阿拉伯聯合大公國(阿拉伯聯合大公國)憑藉其首張賭場牌照吸引了眾多目光。永利國際集團於2024年10月宣布投資51億美元在拉斯海瑪建設賭場綜合體,這標誌著阿拉伯聯合大公國雄心勃勃的娛樂業主導經濟多元化計劃,可能會對鄰近的海灣合作理事會(GCC)國家產生影響。在國家博彩委員會的監管下,南非的博彩業正穩步成長;而利用話費充值模式的行動體育博彩在奈及利亞和肯亞則發揮主導作用。
其他福利:
- Excel格式的市場預測(ME)表
- 3個月的分析師支持
目錄
第1章 引言
- 研究假設和市場定義
- 調查範圍
第2章調查方法
第3章執行摘要
第4章 市場情勢
- 市場概覽
- 市場促進因素
- 數位科技的進步
- 合法化和放鬆管制
- 現場投注和即時直播
- 改進支付解決方案
- 區塊鏈技術
- 個人化使用者體驗
- 市場限制
- 高額課稅和許可證費用
- 網路安全和詐欺風險
- 支付處理限制
- 負面的社會看法和社會歧視
- 供應鏈分析
- 監管環境
- 技術展望
- 波特五力模型
- 新進入者的威脅
- 買方的議價能力
- 供應商的議價能力
- 替代品的威脅
- 競爭對手之間的競爭
第5章 市場規模與成長預測
- 按遊戲類型
- 體育博彩
- 足球
- 賽馬
- 網球
- 其他運動
- 賭場
- 真人娛樂場
- 百家樂
- 二十一點
- 撲克
- 投幣口
- 其他賭場遊戲
- 抽籤
- 賓果
- 體育博彩
- 按平台
- 桌面
- 行動裝置和平板電腦
- 其他平台
- 按年齡層
- 18至24歲
- 25-34歲
- 35至44歲
- 45至54歲
- 55歲或以上
- 按投注類型
- 賽前/固定賠率
- 現場/比賽中
- 按地區
- 北美洲
- 美國
- 加拿大
- 墨西哥
- 北美其他地區
- 南美洲
- 巴西
- 阿根廷
- 哥倫比亞
- 智利
- 其他南美洲
- 歐洲
- 英國
- 德國
- 法國
- 義大利
- 西班牙
- 俄羅斯
- 瑞典
- 比利時
- 波蘭
- 荷蘭
- 其他歐洲地區
- 亞太地區
- 中國
- 日本
- 印度
- 泰國
- 新加坡
- 印尼
- 韓國
- 澳洲
- 紐西蘭
- 亞太其他地區
- 中東和非洲
- 阿拉伯聯合大公國
- 南非
- 沙烏地阿拉伯
- 奈及利亞
- 埃及
- 摩洛哥
- 土耳其
- 其他中東和非洲地區
- 北美洲
第6章 競爭情勢
- 市場集中度
- 策略趨勢
- 市佔率分析
- 公司簡介
- Betsson AB
- 888 Holdings Plc
- Entain PLC
- Flutter Entertainment PLC
- Draftkings Inc.
- Kindred Group PLC
- Bet365 Group Ltd
- 1XBET
- 22BET
- Sportpesa
- MGM Resorts International
- Super Group(SGHC Limited)
- Golden Nugget Hotels and Casinos
- El Royale Casino
- Logrand Entertainment Group
- Codere Online Luxembourg
- Grupo Caliente
- Playdoit
- Rush Street Interactive Inc.
- LeoVegas AB
第7章 市場機會與未來展望
Online gambling market size in 2026 is estimated at USD 101.45 billion, growing from 2025 value of USD 91.63 billion with 2031 projections showing USD 168.71 billion, growing at 10.72% CAGR over 2026-2031.
Factors such as the rising penetration of smartphones, the widespread rollout of 5G, and increasingly harmonized regulations across major jurisdictions are driving a swift migration to digital channels. As of 2024, the GSM Association (GSMA) reports North America leading globally in 5G adoption, boasting a rate of 55%, trailed closely by Greater China. Operators are harnessing live streaming, AI-driven odds engines, and cloud-native architectures, often eclipsing the immersive experiences of traditional land-based venues. With real-time data feeds, operators can manage hundreds of micro-markets for each sporting event, boosting both the frequency of bets and the average ticket size. On the regulatory front, governments are embracing the new tax revenues, viewing regulated iGaming not just as a fiscal tool in the post-pandemic landscape but also as a manageable alternative to gray-market activities, driving the market's growth.
Global Online Gambling Market Trends and Insights
Advancement of Digital Technologies
Advancements in digital technology are reshaping online gambling, evolving it from static web platforms to dynamic, AI-driven ecosystems that tailor experiences to individual users in real-time. By harnessing artificial intelligence and machine learning, operators can now analyze betting patterns, forecast user behavior, and fine-tune offerings with unmatched accuracy, gaining a competitive edge that's elusive for traditional operators. Today's platform development is dominated by mobile-first strategies, with operators pouring resources into progressive web applications and native mobile experiences, bringing console-quality gaming to smartphones. The synergy of 5G networks and edge computing slashes latency to almost nothing, facilitating live dealer experiences and real-time sports betting that can compete with being there in person. With the adoption of cloud infrastructure, operators can swiftly expand across various jurisdictions, all while adhering to local data residency mandates. This compliance is paramount as regulatory bodies place increasing importance on data sovereignty and safeguarding consumer rights.
Legalization and Regulatory Liberalization
Regulatory liberalization stands as the foremost structural force reshaping the global online gambling arena. Governments are increasingly acknowledging digital platforms as legitimate revenue streams, crafting frameworks that harmonize economic gains with consumer safeguards. The U.S. spearheads this evolution, legalizing gambling state by state. The National Council of Legislators from Gaming States is at the forefront, crafting model legislation that standardizes tax rates between 15% and 25% on adjusted gross revenue, ensuring operators face predictable environments. Brazil's Law 14.790/2023, cited by Brazil's Secretariat of Prizes and Betting, showcases the regulatory maturity of emerging markets, mandating operators to set up headquarters in Brazil and adopt thorough responsible gaming protocols, all while raking in an estimated USD 4.5 billion in annual tax revenue. The UAE's launch of the General Commercial Gaming Regulatory Authority signifies a major shift in the Middle East, potentially turning the region into a magnet for licensed operators eyeing affluent demographics and tourism-centric markets. Meanwhile, France's ambition to legalize online casinos by 2025 hints at a broader European market expansion, moving past the confines of traditional sports betting. The Ministry of Economy and Finance in France projects revenues from these newly regulated activities could soar between EUR 748 million and EUR 1.5 billion.
High Taxation and Licensing Costs
High taxation and licensing costs create significant barriers to market entry while compelling established operators to improve operational efficiency and pursue economies of scale through consolidation or geographic expansion. Brazil's regulatory framework demonstrates this challenge, with operators facing a 12% tax on gross gaming revenue and licensing fees up to USD 6 million from January 2025 under Law No. 14,790/2023, as reported by Brazil's Secretariat of Prizes and Betting (SPA). These requirements create substantial capital barriers that benefit large multinational operators over local companies. Illinois's tiered tax structure, which increases rates based on operator revenue levels, shows how taxation can inhibit market growth by imposing higher effective tax rates on successful operators, limiting their ability to reinvest. In some jurisdictions, the combined federal, state, and local taxes reach up to 40% of gross gaming revenue, requiring operators to reduce marketing expenses, restrict bonus offerings, or increase house edges to maintain profit margins. The varying licensing costs across jurisdictions influence operator strategy, with companies prioritizing markets that provide favorable tax conditions and efficient regulatory processes instead of broad geographic expansion.
Other drivers and restraints analyzed in the detailed report include:
- Live Betting and Real-Time Streaming
- Improved Payment Solutions
- Cybersecurity and Fraud Risks
For complete list of drivers and restraints, kindly check the Table Of Contents.
Segment Analysis
In 2025, sports betting commands a dominant 52.05% market share, leveraging the widespread appeal of mainstream sports and enjoying regulatory advantages over traditional casino games in various jurisdictions. With a projected CAGR of 11.75% through 2031, sports betting outpaces the overall market growth, fueled by the expansion of sports leagues, a year-round betting calendar, and the rising allure of esports wagering among younger audiences. While casino games thrive on innovations like live dealers and mobile-optimized slots, the lottery segment enjoys robust government partnerships and a solid consumer base. Bingo, though niche, boasts stable popularity in regions like the UK and parts of Europe, driven by cultural familiarity.
Sports betting's edge lies in its perceived skill element and social acceptance, easing its path to regulatory approval and consumer adoption, especially in markets where traditional casino games face hurdles. Football betting tops the charts, trailed by horse racing's robust infrastructure and tennis's consistent year-round tournaments. Data from the Gambling Commission highlights that on-course horse race betting in Great Britain saw an annual turnover exceeding GBP 238 million from April 2022 to March 2023, up from GBP 151.86 million the prior year. Moreover, blending fantasy sports with social betting features creates hybrid experiences, allowing operators to diversify their offerings and cater to a wider audience with varied preferences and risk appetites.
In 2025, mobile and tablet platforms command a 53.65% share of the gambling market, signaling a pivotal shift in consumption trends. With a projected CAGR of 13.65% through 2031, this segment underscores the growing embrace of smartphones and a strategic pivot towards mobile-centric product development. While desktop platforms remain vital for intricate betting tasks and professional gamblers, who often rely on multiple screens and sophisticated analytical tools emerging technologies are carving out spaces on other platforms. These include smart TV applications and voice-activated betting interfaces. By adopting a mobile-first strategy, operators harness device-specific features like biometric authentication, location services, and push notifications, crafting user experiences that are both more engaging and secure than their traditional web counterparts.
The benefits of mobile platforms transcend mere convenience. They offer real-time engagement opportunities that desktops struggle to match. These include location-based promotions, social sharing features, and augmented reality enhancements that elevate live sports viewing. The rise of progressive web applications (PWAs) streamlines the user experience, sidestepping the often cumbersome app store approval process. PWAs deliver a native app feel, seamlessly functioning across diverse operating systems and devices. Furthermore, the integration of mobile payments with gambling platforms paves the way for fluid user journeys from funding accounts to placing bets and making withdrawals effectively dismantling the barriers that once hindered the widespread adoption of mobile gambling.
The Online Gambling Market is Segmented by Product Type (Sports Betting, Casino, Lottery, and Bingo), by Platform (Desktop, Mobile, and More), by Age Group (18-24 Years, 25-34 Years, 35-44 Years, 45-54 Years, and 55+ Years), by Betting Type (Pre-Match/Fixed-Odds and Live/In-Play), and by Geography. The Market Forecasts are Provided in Terms of Value (USD).
Geography Analysis
In 2025, Europe accounted for a dominant 56.90% of global revenues, amounting to a substantial USD 52.15 billion. However, the region's CAGR is stalling as mature markets tighten their grip on advertising codes and impose bonus caps. Germany's lenient approach and the Netherlands' merit-based licensing are channeling grey operations into regulated platforms. This move not only safeguards tax revenues but also moderates headline growth. Meanwhile, Nordic leaders are pioneering harm-prevention measures, leveraging tools like AI-driven risk scoring and enforced loss limits.
North America's regulatory shift is yielding a robust 15.40% CAGR, the fastest among regions. The U.S. gross handle surged from USD 93 billion in 2024 to USD 110 billion in 2025, spurred by twelve states approving mobile sports wagering, as reported by the National Council of Legislators from Gaming States. Ontario's liberalized market approach is evident, with first-year receipts surpassing CAD 1.4 billion (USD 1.1 billion). The continent's online gambling landscape is heating up, underscored by cross-border merger and acquisition activities like DraftKings' acquisition of Jackpocket, highlighting the race for user bases and advanced technology.
Asia-Pacific, while brimming with potential, grapples with policy fragmentation. PAGCOR's withdrawal from offshore licensing has curtailed the region's hub capacity. In India, state-specific regulations swing between leniency and strictness. Yet, with high mobile engagement and an increasing acceptance of e-wallets, there's a promising upside once regulatory harmonization is achieved.
Latin America's fortunes hinge on Brazil's anticipated January 2025 launch. While Brazil's stipulations like mandatory local headquarters and a 12% GGR tax pose challenges, the nation's vast consumer market is too enticing to ignore. Both Argentina and Colombia exemplify the benefits of stable returns when there's clarity at either provincial or federal levels.
The Middle East and Africa's spotlight is on the UAE, marking its debut with a casino license. Wynn's ambitious USD 5.1 billion complex in Ras Al Khaimah, unveiled in October 2024, hints at a grander vision for entertainment-led economic diversification, potentially inspiring neighboring GCC states. While South Africa enjoys steady growth under the watchful eye of its National Gambling Board, Nigeria and Kenya are championing mobile sports betting, leveraging airtime-credit systems.
- Betsson AB
- 888 Holdings Plc
- Entain PLC
- Flutter Entertainment PLC
- Draftkings Inc.
- Kindred Group PLC
- Bet365 Group Ltd
- 1XBET
- 22BET
- Sportpesa
- MGM Resorts International
- Super Group (SGHC Limited)
- Golden Nugget Hotels and Casinos
- El Royale Casino
- Logrand Entertainment Group
- Codere Online Luxembourg
- Grupo Caliente
- Playdoit
- Rush Street Interactive Inc.
- LeoVegas AB
Additional Benefits:
- The market estimate (ME) sheet in Excel format
- 3 months of analyst support
TABLE OF CONTENTS
1 INTRODUCTION
- 1.1 Study Assumptions and Market Definition
- 1.2 Scope of the Study
2 RESEARCH METHODOLOGY
3 EXECUTIVE SUMMARY
4 MARKET LANDSCAPE
- 4.1 Market Overview
- 4.2 Market Drivers
- 4.2.1 Advancement of Digital Technologies
- 4.2.2 Legalization and Regulatory Liberalization
- 4.2.3 Live Betting and Real-Time Streaming
- 4.2.4 Improved Payment Solutions
- 4.2.5 Blockchain Technology
- 4.2.6 Personalized User Experience
- 4.3 Market Restraints
- 4.3.1 High Taxation and Licensing Costs
- 4.3.2 Cybersecurity and Fraud Risks
- 4.3.3 Payment Processing Limitations
- 4.3.4 Negative Public Perception and Social Stigma
- 4.4 Supply-Chain Analysis
- 4.5 Regulatory Landscape
- 4.6 Technological Outlook
- 4.7 Porter's Five Forces
- 4.7.1 Threat of New Entrants
- 4.7.2 Bargaining Power of Buyers
- 4.7.3 Bargaining Power of Suppliers
- 4.7.4 Threat of Substitutes
- 4.7.5 Competitive Rivalry
5 MARKET SIZE AND GROWTH FORECASTS
- 5.1 By Game Type
- 5.1.1 Sports Betting
- 5.1.1.1 Football
- 5.1.1.2 Horse Racing
- 5.1.1.3 Tennis
- 5.1.1.4 Other Sports
- 5.1.2 Casino
- 5.1.2.1 Live Casino
- 5.1.2.2 Baccarat
- 5.1.2.3 Blackjack
- 5.1.2.4 Poker
- 5.1.2.5 Slots
- 5.1.2.6 Other Casino Games
- 5.1.3 Lottery
- 5.1.4 Bingo
- 5.1.1 Sports Betting
- 5.2 By Platform
- 5.2.1 Desktop
- 5.2.2 Mobile and Tablets
- 5.2.3 Other Platforms
- 5.3 By Age Group
- 5.3.1 18-24 Years
- 5.3.2 25-34 Years
- 5.3.3 35-44 Years
- 5.3.4 45-54 Years
- 5.3.5 55+ Years
- 5.4 By Betting Type
- 5.4.1 Pre-Match/Fixed-Odds
- 5.4.2 Live/In-Play
- 5.5 By Geography
- 5.5.1 North America
- 5.5.1.1 United States
- 5.5.1.2 Canada
- 5.5.1.3 Mexico
- 5.5.1.4 Rest of North America
- 5.5.2 South America
- 5.5.2.1 Brazil
- 5.5.2.2 Argentina
- 5.5.2.3 Colombia
- 5.5.2.4 Chile
- 5.5.2.5 Rest of South America
- 5.5.3 Europe
- 5.5.3.1 United Kingdom
- 5.5.3.2 Germany
- 5.5.3.3 France
- 5.5.3.4 Italy
- 5.5.3.5 Spain
- 5.5.3.6 Russia
- 5.5.3.7 Sweden
- 5.5.3.8 Belgium
- 5.5.3.9 Poland
- 5.5.3.10 Netherlands
- 5.5.3.11 Rest of Europe
- 5.5.4 Asia-Pacific
- 5.5.4.1 China
- 5.5.4.2 Japan
- 5.5.4.3 India
- 5.5.4.4 Thailand
- 5.5.4.5 Singapore
- 5.5.4.6 Indonesia
- 5.5.4.7 South Korea
- 5.5.4.8 Australia
- 5.5.4.9 New Zealand
- 5.5.4.10 Rest of Asia-Pacific
- 5.5.5 Middle East and Africa
- 5.5.5.1 United Arab Emirates
- 5.5.5.2 South Africa
- 5.5.5.3 Saudi Arabia
- 5.5.5.4 Nigeria
- 5.5.5.5 Egypt
- 5.5.5.6 Morocco
- 5.5.5.7 Turkey
- 5.5.5.8 Rest of Middle East and Africa
- 5.5.1 North America
6 COMPETITIVE LANDSCAPE
- 6.1 Market Concentration
- 6.2 Strategic Moves
- 6.3 Market Share Analysis
- 6.4 Company Profiles (includes Global level Overview, Market level overview, Core Segments, Financials as available, Strategic Information, Market Rank/Share for key companies, Products and Services, and Recent Developments)
- 6.4.1 Betsson AB
- 6.4.2 888 Holdings Plc
- 6.4.3 Entain PLC
- 6.4.4 Flutter Entertainment PLC
- 6.4.5 Draftkings Inc.
- 6.4.6 Kindred Group PLC
- 6.4.7 Bet365 Group Ltd
- 6.4.8 1XBET
- 6.4.9 22BET
- 6.4.10 Sportpesa
- 6.4.11 MGM Resorts International
- 6.4.12 Super Group (SGHC Limited)
- 6.4.13 Golden Nugget Hotels and Casinos
- 6.4.14 El Royale Casino
- 6.4.15 Logrand Entertainment Group
- 6.4.16 Codere Online Luxembourg
- 6.4.17 Grupo Caliente
- 6.4.18 Playdoit
- 6.4.19 Rush Street Interactive Inc.
- 6.4.20 LeoVegas AB
7 MARKET OPPORTUNITIES AND FUTURE OUTLOOK
 VR博彩市場按類別、支付模式、設備類型、最終用戶和應用程式分類-2025-2032年全球預測全球線上賭博市場按性別、平台、遊戲類型、支付方式和年齡層分類的預測(2025-2032 年)
 線上賭博市場-全球產業規模、佔有率、趨勢、機會和預測(按類型、支付方式、設備、地區和競爭情況分類,2020-2030 年預測)
 2025年全球線上賭博市場報告
 2025-2029年全球線上賭博市場
 全球線上賭博市場研究報告 - 產業分析、規模、佔有率、成長、趨勢及 2025 年至 2033 年預測
 2025 年至 2033 年日本線上賭博市場規模、佔有率、趨勢及按遊戲類型、設備和地區分類的預測
 全球線上博弈市場:市場規模、佔有率、趨勢、產業分析(依類型、設備和地區)、未來預測(2025-2034)
 美國線上賭博市場規模、佔有率、趨勢分析報告:按類型、設備、競爭分析、細分預測,2025-2030 年線上賭博市場規模、佔有率、趨勢分析報告:按類型、設備、地區、細分預測,2025-2030 年