


 |
市場調查報告書
商品編碼
1851423
廢棄物(WTE):市場佔有率分析、行業趨勢、統計數據和成長預測(2025-2030 年)Waste To Energy (WTE) - Market Share Analysis, Industry Trends & Statistics, Growth Forecasts (2025 - 2030) |
||||||
※ 本網頁內容可能與最新版本有所差異。詳細情況請與我們聯繫。
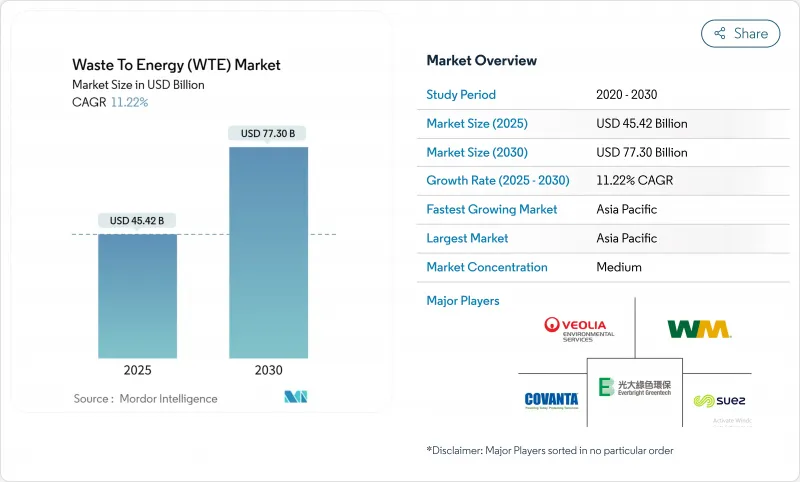
預計到 2025 年,廢棄物發電 (WTE) 市場價值將達到 454.2 億美元,到 2030 年將達到 773 億美元,複合年成長率為 11.22%。
城市廢棄物增多和全球對低碳電力的需求雙重壓力推動了成長。儘管火力發電仍然是產能擴張的支柱,但投資正轉向等離子弧和先進厭氧消化等先進的低排放氣體解決方案。韓國和歐盟積極的碳定價機制正在重塑計劃經濟格局,而印度二線城市的掩埋禁令則加速了原料供應。公用事業公司、環境服務公司和技術專家之間的策略整合仍在繼續,而數位化最佳化工具正在提高新建和維修工廠的營運利潤率和合規績效。這些因素共同作用,維持了可融資計劃的充足儲備,並將垃圾焚化發電市場定位為循環經濟的關鍵組成部分。
全球廢棄物發電 (WTE) 市場趨勢與洞察
中國大沿岸地區垃圾焚化發電官民合作關係計畫快速發展
超過350億元的投資正用於資助80多個計劃,這些項目實施了先進的排放監控和材料回收設計。新建工廠將形成一個高產能叢集,每日處理能力超過40萬噸,為該地區可擴展的城市廢棄物解決方案樹立了典範。預計到2024年,包括垃圾焚化發電在內的綠能能源發電量將年增16.4%,凸顯了政策的積極性和投資者的信心。
歐盟綠色稅收優惠政策加速老舊焚化爐的改裝
綠色稅收體系將融資與嚴格的能源指標掛鉤,並提供約3億歐元的資金,用於將廢氣系統升級與提高材料再利用率相結合的維修。符合資格的業者將享有更低的資金籌措成本和優先併網待遇,從而增強西歐和北歐的垃圾焚化發電市場。
由於戴奧辛排放法規更加嚴格,德國爐窯維修許可證的批准被推遲。
2024 年《工業排放指令》將收緊監管,並要求在 2035 年實施電子許可證制度,這將迫使老舊工廠的營運商重新設計其空氣污染控制系統。合規成本和漫長的核准時間延緩了產能升級,削弱了歐洲最大經濟體—波蘭的垃圾焚化發電市場。
細分市場分析
到2024年,焚燒仍將佔據廢棄物發電市場65%的佔有率,這得益於其在歐洲和東亞地區成熟的營運經驗以及與區域供熱基礎設施的整合。年產能超過20萬噸的工廠仍繼續採用爐排爐設計,因為其運作時間可預測且供應商網路成熟。然而,由於廢棄物合成氣的轉化效率高達99%,且戴奧辛排放量顯著降低,預計到2030年,等離子弧爐的產能將以16%的複合年成長率成長。低排放和高金屬回收率帶來的補貼進一步推動了等離子弧爐計劃,尤其是在亞洲人口稠密的都市區。因此,垃圾焚化發電結合先進熱能平台的市場規模正以高於平均的速度成長。
雜合反應趨勢正在重塑資產規格。一些新建工廠將前端機械和生物處理與氣化或等離子弧結合,以提高熱轉化前的回收率。同時,厭氧消化在農業地區再次受到關注,這些地區高水分有機廢棄物能夠以適中的資本成本提供優異的沼氣產量。機械、熱力和化學預處理目前可將甲烷產量提高25%至190%,從而擴大分散式消化器的經濟效益範圍。在預測期間內,數位孿生和人工智慧輔助燃燒控制可望在生命週期中將熱島效應效率提高4%至6%,進一步凸顯下一代設施的差異化優勢。
到2024年,都市固態廢棄物將佔廢棄物焚化發電(WTE)市場規模的70%,這主要得益於穩定的垃圾收集量以及監管機構推動減少垃圾掩埋的壓力。主要城市的高溫工業廢棄物和源頭分類項目維持了原料的高品質,並為基本負載能源生產提供了支持。同時,隨著各國政府致力於減少農村供應鏈中的甲烷排放,預計2030年,農業和農工廢棄物將以14%的複合年成長率成長。鼓勵農民供應作物秸稈和糞便的財務獎勵,釋放了先前未開發的能源潛力,而且透過沼氣池的利用,也符合土壤健康目標。
塑膠、溶劑和高Bt污泥等工業廢棄物推動了對專用迴轉窯和流體化床系統的穩定需求。隨著排放法規的日益嚴格,污水污泥的排放量也越來越大,需要額外的處理。熱乾燥結合簡單的焚燒工藝,可以生產出富含磷的灰燼,這種灰燼可以回收製成肥料。這一趨勢有助於提高廢棄物發電廠的運轉率,並延長其維護週期。
廢棄物(WTE) 市場報告按技術(物理、熱力、生物)、廢棄物類型(城市固態廢棄物、工業廢棄物、其他)、能源輸出(電力、熱能、其他)、最終用戶(公共產業和獨立發電商、工業專屬式電廠、區域供熱營運商、運輸燃料經銷商)和地區(北美、歐洲、亞太地區、南美、中東和非洲)進行細分。
區域分析
亞太地區預計到2024年將佔全球銷售額的45%,並保持領先地位,到2030年該地區複合年成長率將達到13%。光是中國就有超過400座日處理量達40萬噸的工廠在運作,預計到2025年將增加至70萬噸/日。在「清潔印度運動2.0」(Swachh Bharat Mission 2.0)的指導下,印度的二線城市正在簽署建設-營運-移交(BOT)協議,優先建設日處理量300-500噸的模組化生產線。日本在排放控制技術領域保持領先地位,韓國的排放權交易體系使其內部報酬率(IRR)模型提高了2.5個百分點,從而擴大了東北亞的垃圾焚化發電市場。
歐洲區域供熱整合程度高,且環境法規嚴格,其銷售額位居第二。丹麥和瑞典的地方政府供熱網路中可再生能源佔比已超過75%,歐盟的綠色稅收政策正引導優惠資金用於工廠維修。德國由於戴奧辛法規更為嚴格,維修有所延遲;而英國的熱值限制則促使低等級的垃圾衍生燃料(RDF)被送往國內焚燒爐,從而創造了新的本地需求。
北美地區正穩步擴張,主要得益於美國的大型公用事業計劃和加拿大的生物甲烷投資。 Covanta、Waste Management 和 FCC Environmental Services 等公司正在競相爭取大型市政契約,而近期的收購也預示著該行業將進一步整合。在拉丁美洲,巴西中南部糖帶的沼氣應用日益普及,但原料價格波動導致計劃儲備不穩定。在中東和非洲,埃及耗資 1.2 億美元的固態垃圾焚化發電發電廠引起了越來越多的關注,但整體推廣仍處於早期階段。
其他福利:
- Excel格式的市場預測(ME)表
- 3個月的分析師支持
目錄
第1章 引言
- 研究假設和市場定義
- 調查範圍
第2章調查方法
第3章執行摘要
第4章 市場情勢
- 市場概覽
- 市場促進因素
- 中國大灣區垃圾焚化發電官民合作關係計畫快速發展
- 歐盟綠色稅收優惠政策加速老舊焚化爐的改裝
- 印度二線城市全國禁止隨意掩埋,以促進都市固體廢棄物分流
- 更高的碳權價格提高了韓國垃圾焚化發電計劃的內部收益率
- 斯堪的納維亞循環經濟主導的沼氣CPPA
- 英國脫歐後,英國對RDF出口實施強制性熱基準值
- 市場限制
- 由於戴奧辛排放法規更加嚴格,德國爐篦維修許可證申請被延後。
- 有限的廢棄物處理費成長阻礙了印尼計劃的融資可行性。
- 巴西厭氧消化原料價格波動損害利潤率
- 澳洲近郊地區社區反對等離子弧設施
- 供應鏈分析
- 技術展望
- 監理展望
- 波特五力模型
- 供應商的議價能力
- 消費者議價能力
- 新進入者的威脅
- 替代品的威脅
- 競爭對手之間的競爭
- 投資分析
第5章 市場規模與成長預測
- 透過技術
- 物理處理(廢棄物衍生燃料、機械和生物處理)
- 熱能(焚燒/燃燒、氣化、熱解、等離子弧)
- 生物法(厭氧消化、發酵)
- 廢棄物類型
- 固態廢棄物
- 工業廢棄物
- 農業及農業殘餘物
- 污水污泥
- 其他(商業、建築、危險物質)
- 按能量輸出
- 電
- 熱
- 熱電聯產(CHP)
- 運輸燃料(生物天然氣、生物液化天然氣、乙醇)
- 最終用戶
- 公共產業和獨立發電商(IPP)
- 工業專屬式工廠
- 區域供熱營運商
- 運輸燃料分銷商
- 按地區
- 北美洲
- 美國
- 加拿大
- 墨西哥
- 歐洲
- 英國
- 德國
- 法國
- 西班牙
- 北歐國家
- 俄羅斯
- 其他歐洲地區
- 亞太地區
- 中國
- 印度
- 日本
- 韓國
- 東南亞國協
- 亞太其他地區
- 南美洲
- 巴西
- 阿根廷
- 哥倫比亞
- 其他南美洲
- 中東和非洲
- 阿拉伯聯合大公國
- 沙烏地阿拉伯
- 南非
- 埃及
- 其他中東和非洲地區
- 北美洲
第6章 競爭情勢
- 市場集中度
- 策略性舉措(併購、夥伴關係、購電協議)
- 市場佔有率分析(主要企業的市場排名/佔有率)
- 公司簡介
- Veolia Environnement SA
- Suez SA
- Waste Management Inc.
- Covanta Holding Corp.
- Wheelabrator Technologies Inc.
- Mitsubishi Heavy Industries Ltd
- Hitachi Zosen Corp.
- Babcock & Wilcox Enterprises Inc.
- A2A SpA
- MVV Energie AG
- Martin GmbH fur Umwelt-und Energietechnik
- China Everbright Environment Group Ltd
- China Jinjiang Environment Holding Co.
- Xcel Energy Inc.
- Shenzhen Energy Group Co.
- Keppel Seghers
- Remondis SE & Co. KG
- FCC Servicios Medio Ambiente
- Enerkem Inc.
- Sembcorp Industries Ltd
- Green Conversion Systems LLC
- Fortum Oyj
第7章 市場機會與未來展望
The Waste To Energy Market size is estimated at USD 45.42 billion in 2025, and is expected to reach USD 77.30 billion by 2030, at a CAGR of 11.22% during the forecast period (2025-2030).
Growth rests on two converging pressures: swelling urban waste streams and the worldwide push for low-carbon power. Thermal technologies remain the backbone of capacity additions, yet investments are shifting toward advanced, lower-emission solutions such as plasma-arc and upgraded anaerobic digestion. Active carbon-price regimes in South Korea and the European Union are reshaping project economics, while landfill bans in India's Tier-2 cities accelerate feedstock availability. Strategic consolidation among utilities, environmental services firms, and technology specialists continues, and digital optimization tools are lifting operating margins and compliance performance across new and retrofit plants. Together, these forces sustain a robust pipeline of bankable projects and position the waste-to-energy market as a pivotal element of the circular economy.
Global Waste To Energy (WTE) Market Trends and Insights
Rapid Roll-out of EfW Public-Private Partnership Pipelines in China's Greater Bay Area
Investments topping CNY 35 billion are funding more than 80 projects that deploy advanced emissions monitoring and material-recovery designs. New plants form a high-capacity cluster processing over 400,000 tons daily, cementing the region's template for scalable urban waste solutions. Electricity output from clean sources, including WTE, rose 16.4% year-on-year in 2024, confirming policy momentum and investor confidence.
EU Green Taxonomy Incentives Accelerating Retrofit of Legacy Incineration Fleets
The Green Taxonomy links financing to strict energy-efficiency metrics, unlocking roughly EUR 300 million for retrofit work that couples upgraded flue-gas systems with expanded material reclamation. Operators that comply gain lower funding costs and priority grid access, reinforcing the waste-to-energy market across Western and Northern Europe.
Stricter Dioxin Emission Caps Postponing Permits for Grate-Furnace Refurbishments in Germany
The 2024 Industrial Emissions Directive tightens limits and mandates e-permits by 2035, forcing operators of older plants to redesign air-pollution-control systems. Compliance costs and protracted approvals delay capacity upgrades and dampen the waste-to-energy market in Europe's largest economy.
Other drivers and restraints analyzed in the detailed report include:
- National Bans on Unsegregated Landfill Triggering MSW Diversion in India's Tier-2 Cities
- Soaring Carbon Credit Prices Improving WTE Project IRRs in South Korea
- Limited Tipping-Fee Escalation Clauses Hurting Project Bankability in Indonesia
For complete list of drivers and restraints, kindly check the Table Of Contents.
Segment Analysis
Incineration retained 65% of the waste to energy market share in 2024, anchored by proven operational history and integration with district-heat infrastructure across Europe and East Asia. Plants above 200,000 tpa continue to deploy grate-furnace designs due to predictable runtime and established supplier networks. Nevertheless, plasma-arc capacity is forecast to log a 16% CAGR to 2030, thanks to 99% waste-to-syngas conversion efficiency and sharply lower dioxin formation. Subsidy schemes that reward lower emissions and higher metals recovery further tilt project pipelines toward plasma-arc, especially in densely populated Asian conurbations. The waste to energy market size tied to advanced thermal platforms therefore accelerates faster than the headline rate.
Hybridization trends are reshaping asset specifications: several new builds bundle front-end mechanical biological treatment with either gasification or plasma-arc to boost recycling yields before thermal conversion. Meanwhile, anaerobic digestion enjoys renewed focus in agrarian regions where high-moisture organic waste offers superior biogas yields at modest capital cost. Mechanical, thermal, and chemical pretreatments now lift methane production by 25%-190%, widening the economic sweet spot for distributed digesters. Over the forecast period, digital twins and AI-assisted combustion controls are expected to enhance thermal-island efficiency by 4%-6% on a lifecycle basis, further differentiating next-generation facilities.
Municipal solid waste accounted for 70% of the waste to energy market size in 2024, buoyed by steady collection volumes and regulatory pressure to move away from landfilling. High calorific industrial fractions and source-segregation programs in major cities sustain robust feedstock quality, supporting baseload energy output. Agricultural and agro-industrial residues, however, will post a 14% CAGR through 2030 as governments target methane mitigation in rural supply chains. Financial incentives for farmers to supply crop stover and manure unlock previously untapped energy potential and align with soil-health goals via digestate use.
Industrial waste streams featuring plastics, solvents, and high-Btu sludges present stable demand for specialized rotary-kiln and fluidized-bed systems. Sewage sludge gains visibility where stricter discharge norms require additional treatment: thermal drying coupled with mono-incineration now yields phosphorus-rich ash that can be recycled into fertilizer. Across categories, pre-processing and optical sorting technologies are raising net calorific value and reducing contaminants, a trend that supports higher plant availability and longer maintenance cycles within the waste to energy market.
The Waste To Energy (WTE) Market Report is Segmented by Technology (Physical, Thermal, and Biological), Waste Type (Municipal Solid Waste, Industrial Waste, and Others), Energy Output (Electricity, Heat, and Others), End-Users (Utilities and IPPs, Industrial Captive Plants, District Heating Operators, and Transport Fuel Distributors), and Geography (North America, Europe, Asia-Pacific, South America, and Middle East and Africa).
Geography Analysis
Asia-Pacific posted 45% of 2024 revenue and will hold the pole position with a 13% regional CAGR to 2030. China alone operates over 400 plants processing 400,000 tons daily, with the capacity to climb to 700,000 tons per day by 2025. India's Tier-2 cities, guided by Swachh Bharat Mission 2.0, are issuing build-operate-transfer contracts that favor modular lines sized at 300-500 tpd. Japan sustains leadership in emissions control technologies, and South Korea's emissions-trading scheme raises modeled IRRs by up to 2.5 percentage points, broadening the waste-to-energy market in Northeast Asia.
Europe ranks second by revenue, characterized by dense district-heat integration and rigorous environmental regulation. Denmark and Sweden already surpass 75% renewable share in municipal heat networks, and the EU Green Taxonomy channels concessional capital into plant retrofits. Germany faces retrofit delays from stricter dioxin caps, while the United Kingdom's calorific-value rules redirect lower-grade RDF to domestic incinerators, creating new local capacity demand.
North America registers steady expansion anchored by utility-scale projects in the United States and biomethane investments in Canada. Covanta, Waste Management, and FCC Environmental Services vie for large municipal contracts, with recent acquisitions signaling further consolidation. South America sees biogas rollouts in Brazil's south-central sugar belt, yet feedstock-price volatility tempers project pipelines. In the Middle East and Africa, Egypt's USD 120 million solid waste-to-electricity plant illustrates rising interest, though overall deployment remains early-stage.
- Veolia Environnement SA
- Suez SA
- Waste Management Inc.
- Covanta Holding Corp.
- Wheelabrator Technologies Inc.
- Mitsubishi Heavy Industries Ltd
- Hitachi Zosen Corp.
- Babcock & Wilcox Enterprises Inc.
- A2A SpA
- MVV Energie AG
- Martin GmbH fur Umwelt- und Energietechnik
- China Everbright Environment Group Ltd
- China Jinjiang Environment Holding Co.
- Xcel Energy Inc.
- Shenzhen Energy Group Co.
- Keppel Seghers
- Remondis SE & Co. KG
- FCC Servicios Medio Ambiente
- Enerkem Inc.
- Sembcorp Industries Ltd
- Green Conversion Systems LLC
- Fortum Oyj
Additional Benefits:
- The market estimate (ME) sheet in Excel format
- 3 months of analyst support
TABLE OF CONTENTS
1 Introduction
- 1.1 Study Assumptions & Market Definition
- 1.2 Scope of the Study
2 Research Methodology
3 Executive Summary
4 Market Landscape
- 4.1 Market Overview
- 4.2 Market Drivers
- 4.2.1 Rapid roll-out of EfW public-private partnership pipelines in China's Greater Bay Area
- 4.2.2 EU Green Taxonomy incentives accelerating retrofit of legacy incineration fleets
- 4.2.3 National bans on unsegregated landfill triggering MSW diversion in India's Tier-2 cities
- 4.2.4 Soaring carbon credit prices improving WTE project IRRs in South Korea
- 4.2.5 Circular-economy led corporate power-purchase agreements (CPPAs) for biogas in Nordics
- 4.2.6 Mandatory calorific value thresholds for RDF exports in the UK post-Brexit
- 4.3 Market Restraints
- 4.3.1 Stricter dioxin emission caps postponing permits for grate-furnace refurbishments in Germany
- 4.3.2 Limited tipping-fee escalation clauses hurting project bankability in Indonesia
- 4.3.3 Anaerobic-digestion feedstock price volatility undermining margins in Brazil
- 4.3.4 Community push-back against plasma-arc facilities in Australia's peri-urban regions
- 4.4 Supply-Chain Analysis
- 4.5 Technological Outlook
- 4.6 Regulatory Outlook
- 4.7 Porter's Five Forces
- 4.7.1 Bargaining Power of Suppliers
- 4.7.2 Bargaining Power of Consumers
- 4.7.3 Threat of New Entrants
- 4.7.4 Threat of Substitutes
- 4.7.5 Intensity of Competitive Rivalry
- 4.8 Investment Analysis
5 Market Size & Growth Forecasts
- 5.1 By Technology
- 5.1.1 Physical (Refuse-Derived Fuel, Mechanical Biological Treatment)
- 5.1.2 Thermal (Incineration/Combustion, Gasification, Pyrolysis and Plasma-Arc)
- 5.1.3 Biological (Anaerobic Digestion, Fermentation)
- 5.2 By Waste Type
- 5.2.1 Municipal Solid Waste
- 5.2.2 Industrial Waste
- 5.2.3 Agricultural and Agro-industrial Residues
- 5.2.4 Sewage Sludge
- 5.2.5 Others (Commercial, Construction, Hazardous)
- 5.3 By Energy Output
- 5.3.1 Electricity
- 5.3.2 Heat
- 5.3.3 Combined Heat and Power (CHP)
- 5.3.4 Transportation Fuels (Bio-SNG, Bio-LNG, Ethanol)
- 5.4 By End-user
- 5.4.1 Utilities and Independent Power Producers (IPPs)
- 5.4.2 Industrial Captive Plants
- 5.4.3 District Heating Operators
- 5.4.4 Transport Fuel Distributors
- 5.5 By Geography
- 5.5.1 North America
- 5.5.1.1 United States
- 5.5.1.2 Canada
- 5.5.1.3 Mexico
- 5.5.2 Europe
- 5.5.2.1 United Kingdom
- 5.5.2.2 Germany
- 5.5.2.3 France
- 5.5.2.4 Spain
- 5.5.2.5 Nordic Countries
- 5.5.2.6 Russia
- 5.5.2.7 Rest of Europe
- 5.5.3 Asia-Pacific
- 5.5.3.1 China
- 5.5.3.2 India
- 5.5.3.3 Japan
- 5.5.3.4 South Korea
- 5.5.3.5 ASEAN Countries
- 5.5.3.6 Rest of Asia-Pacific
- 5.5.4 South America
- 5.5.4.1 Brazil
- 5.5.4.2 Argentina
- 5.5.4.3 Colombia
- 5.5.4.4 Rest of South America
- 5.5.5 Middle East and Africa
- 5.5.5.1 United Arab Emirates
- 5.5.5.2 Saudi Arabia
- 5.5.5.3 South Africa
- 5.5.5.4 Egypt
- 5.5.5.5 Rest of Middle East and Africa
- 5.5.1 North America
6 Competitive Landscape
- 6.1 Market Concentration
- 6.2 Strategic Moves (M&A, Partnerships, PPAs)
- 6.3 Market Share Analysis (Market Rank/Share for key companies)
- 6.4 Company Profiles (includes Global level Overview, Market level overview, Core Segments, Financials as available, Strategic Information, Products & Services, and Recent Developments)
- 6.4.1 Veolia Environnement SA
- 6.4.2 Suez SA
- 6.4.3 Waste Management Inc.
- 6.4.4 Covanta Holding Corp.
- 6.4.5 Wheelabrator Technologies Inc.
- 6.4.6 Mitsubishi Heavy Industries Ltd
- 6.4.7 Hitachi Zosen Corp.
- 6.4.8 Babcock & Wilcox Enterprises Inc.
- 6.4.9 A2A SpA
- 6.4.10 MVV Energie AG
- 6.4.11 Martin GmbH fur Umwelt- und Energietechnik
- 6.4.12 China Everbright Environment Group Ltd
- 6.4.13 China Jinjiang Environment Holding Co.
- 6.4.14 Xcel Energy Inc.
- 6.4.15 Shenzhen Energy Group Co.
- 6.4.16 Keppel Seghers
- 6.4.17 Remondis SE & Co. KG
- 6.4.18 FCC Servicios Medio Ambiente
- 6.4.19 Enerkem Inc.
- 6.4.20 Sembcorp Industries Ltd
- 6.4.21 Green Conversion Systems LLC
- 6.4.22 Fortum Oyj
7 Market Opportunities & Future Outlook
- 7.1 White-space & unmet-need assessment
 垃圾焚化發電市場:2026-2032年全球市場預測(按技術、原料類型、工廠產能、發電量、應用、最終用戶和所有權類型分類)
 2026年全球垃圾掩埋沼氣氣化能源(LFGTE)系統市場報告2026年全球垃圾焚化發電(WtE)市場報告
 亞太地區廢棄物製氫(WtH)市場:按應用、技術、廢棄物類型和國家分類的分析和預測(2025-2035 年)
 歐洲廢棄物氫氣市場按應用、技術、垃圾類型和國家分類-分析與預測(2025-2035 年)
 垃圾焚化發電市場報告:按技術、廢棄物類型和地區分類(2026-2034 年)
 先進廢棄物能源化技術市場分析及預測(至2035年):按類型、產品類型、技術、組件、應用、最終用戶、製程、安裝類型、設備和解決方案分類
 2026-2030年全球廢棄物發電市場
 垃圾焚化發電市場-全球產業規模、佔有率、趨勢、機會及預測(依技術、廢棄物類型、應用、地區及競爭格局分類,2021-2031年)全球廢棄物發電用爐排鍋爐市場(按燃料類型、技術類型、容量、安裝類型、運作模式、應用和最終用戶分類)預測(2026-2032年)