


 |
市場調查報告書
商品編碼
1844615
歐洲垃圾焚化發電:市場佔有率分析、產業趨勢、統計數據和成長預測(2025-2030 年)Europe Waste-to-Energy - Market Share Analysis, Industry Trends & Statistics, Growth Forecasts (2025 - 2030) |
||||||
※ 本網頁內容可能與最新版本有所差異。詳細情況請與我們聯繫。
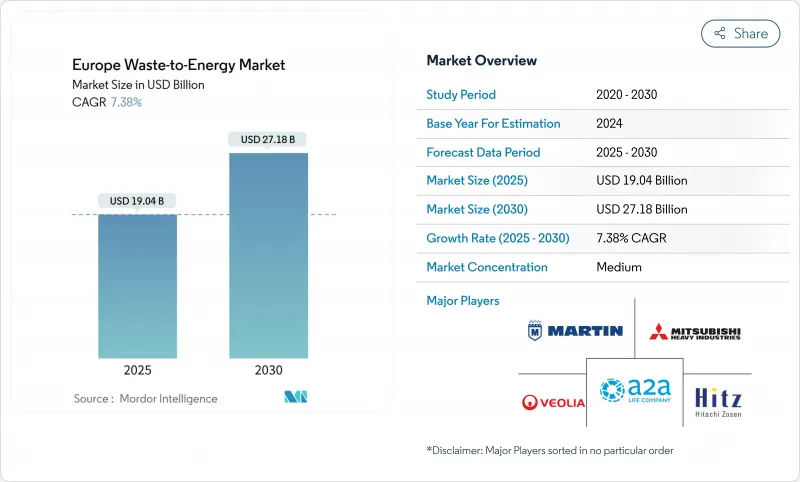
預計 2025 年歐洲垃圾焚化發電市場規模為 190.4 億美元,到 2030 年將達到 271.8 億美元,預測期內(2025-2030 年)的複合年成長率為 7.38%。
與歐盟廢棄物和氣候指令的政策協調、煤炭產能的縮減以及掩埋收費的增加將推動設施利用率的提高。歐盟碳邊境調整機制 (CBAM) 等與碳相關的獎勵將創造新的收益來源,而北歐和中歐及東歐的區域供熱建設將提高計劃的融資能力。超過 750 噸/天的大型工廠正在獲得發展勢頭,因為大型工廠降低了單獨捕集的維修成本,並更容易從歐盟創新基金獲得資金。德國、義大利、波蘭、北歐和英國的新建項目數量依然強勁,而這些國家的社會對都市區排放的敏感性以及批發電價的疲軟正在抑製成長。因此,歐洲垃圾焚化發電市場正在鞏固其作為推動掩埋轉移的穩定產能提供者的角色。
歐洲垃圾焚化發電市場趨勢與洞察
歐盟廢棄物框架指令2018/851旨在促進掩埋轉移
該指令規定,到2035年,地方政府掩埋處理量不得超過10%,並鼓勵成員國增加剩餘廢棄物的供熱供給能力。儘管2010年至2020年間掩埋量下降了27.5%,但仍有14個國家面臨不合規風險,這促使它們加速採購新的焚化和厭氧消化廠。波蘭和羅馬尼亞優先考慮歐盟凝聚基金的資金,為承包設施提供資金,並壓縮核准窗口以滿足最後期限。能源回收的優先順序高於廢棄物處理,這使得市政當局有理由提高門票費,從而增加計劃收益。東歐當局將垃圾焚化發電視為解決掩埋轉移和冬季尖峰時段電力短缺的雙重解決方案,以支持整個歐洲垃圾焚化發電市場的需求。
歐盟碳邊境調整機制的出現將推動廢棄物衍生能源信用的需求
CBAM 將於 2026 年全面啟動,將垃圾焚化發電取代化石能源發電所減少的排放收益。碳強度較低的設施將獲得優質證書,而工業買家則必須放棄這些證書,從而有效地補貼工廠收益。隨著歐盟排放交易體系 (EU ETS) 價格趨於每噸二氧化碳 80 歐元以上,這些證書將提高新建設的內部收益率。開發商已開始採用先進的廢氣處理技術來檢驗其碳排放係數。由於碳排放電力的進口商需繳納同等課稅,該計劃間接保護了國內營運商,並進一步增強了歐洲垃圾焚化發電市場。
都市區反對派運動和訴訟愈演愈烈
環保組織利用2024年歐洲人權法院關於氣候變遷的裁決,對許可證提出質疑,並延長核准流程。阿姆斯特丹一座擬建的發電廠因居民請願而被叫停,馬德里也面臨類似的強烈反對。法律的不確定性提高了貸款機構的風險溢價,並要求開發商在焚燒前證明其已採取了徹底的回收措施。雖然像哥本哈根這樣的公共部門業主享有更高的社會認可度,但私人特許特許經營通常包括公民監督委員會。這些動態正在減緩人口密集城市的計劃部署,並限制了歐洲垃圾焚化發電市場近期的產能成長。
細分分析
到2024年,火力發電路線將貢獻該領域60%的收益。氣化和熱解試驗工廠目前由歐盟創新基金支持,這表明政策傾向於支持碳捕集的設計。隨著厭氧消化達到再生能源歐盟(REPowerEU)到2030年350億立方公尺生物甲烷的目標,生物產業叢集將以12.2%的複合年成長率成長。結合預分選、固態消化和垃圾衍生燃料燃燒的一體化設施可減少剩餘掩埋量,並提高循環經濟指標。與生物解決方案相關的歐洲垃圾焚化發電市場預計將從2025年的54億美元擴大到2030年的82億美元,證實了投資者對低碳氣體的興趣。
日立造船Innova、馬丁有限公司和巴布科克威爾科克斯等火電供應商正透過模組化爐排管線和整合富氧燃燒捕集口來應對這項挑戰。計劃發起方目前正在設計超越工業排放指令限值的煙氣處理方案,從而縮短後續捕集整合的前置作業時間。生物技術供應商正專注於開發適用於小型城市的貨櫃式消化池,以擴大其容量。可調節空氣流量、爐渣處理和消化池停留時間的數位控制器可將運轉率提高近92%,從而增強整個歐洲垃圾焚化發電市場的收益韌性。
到2024年,都市固態廢棄物(MSW)將佔處理量的62%,這得益於成熟的收集物流和強制性的最低處置量。然而,隨著農民將糞肥和作物殘茬收益以遵守《硝酸鹽指令》,農業和農工廢棄物每年將以11.4%的速度成長。受義大利和丹麥天然氣管網注入溢價的支撐,到2030年,歐洲垃圾焚化發電市場規模可能達到67億美元。
肉類加工內臟和乳酪乳清是高產沼氣來源,投資回收期不到12個月,吸引了合作社擁有的沼氣池。隨著都市區成長和污水處理法規的日益嚴格,污水污泥量不斷增加,促使營業單位安裝污泥焚燒爐以實現能源獨立。商業和工業回收材料(例如包裝和紡織品)具有高熱值,需要預先分類機器人去除聚氯乙烯和金屬。混合進料策略透過平衡熱值波動並確保全年供應鏈,提高了整個歐洲垃圾焚化發電市場的工廠利用率。
歐洲垃圾焚化發電市場報告按技術(物理、熱、生物)、廢棄物類型(都市固態廢棄物、工業廢棄物、農業和農業工業殘留物、污水污泥等)、能源輸出(電力、熱能等)、最終用戶(工業專屬式電廠、運輸燃料分銷商等)和國家(德國、英國、義大利、法國、北歐國家等)進行細分。
其他福利:
- Excel 格式的市場預測 (ME) 表
- 3個月的分析師支持
目錄
第1章 引言
- 研究假設和市場定義
- 調查範圍
第2章調查方法
第3章執行摘要
第4章 市場狀況
- 市場概況
- 市場促進因素
- 歐盟廢棄物框架指令2018/851旨在推動掩埋轉移
- 引入歐盟碳邊境調整機制,以增加對廢棄物衍生能源信用的需求
- 德國燃煤發電廠快速退役,對廢棄物發電產生基本負載需求
- 北歐和中東歐區域供熱擴張推動熱電聯產廢棄物發電廠發展
- 英國和法國提高掩埋場收費,改善廢棄物發電經濟
- 歐盟創新基金為碳捕集型廢棄物發電設施津貼
- 市場限制
- 公眾對城市中心焚燒的反對和訴訟日益增加(阿姆斯特丹、馬德里)
- 風能和太陽能發電量激增導致批發電價下跌,損害了 WtE 的收益
- 由於歐盟工業排放指令許可延遲,計劃前置作業時間延長
- 先進(化學)回收的競爭奪走了塑膠原料的流動
- 供應鏈分析
- 監理展望
- 技術展望
- 波特五力分析
- 供應商的議價能力
- 買方的議價能力
- 新進入者的威脅
- 替代品的威脅
- 競爭對手之間的競爭
第5章市場規模及成長預測
- 依技術
- 物理處理(固態燃料、機械和生物處理)
- 熱(焚燒/燃燒、氣化、熱解、等離子/電弧)
- 生物處理(厭氧消化、發酵)
- 依廢棄物類型
- 都市固態廢棄物(MSW)
- 工業廢棄物
- 農業和農業殘留物
- 污水污泥
- 其他(商業廢棄物、建築廢棄物、危險廢棄物)
- 按能量輸出
- 電
- 熱
- 熱電聯產(CHP)
- 運輸燃料(生物天然氣、生物液化天然氣、乙醇)
- 按最終用戶
- 公共產業和獨立電力生產商(IPP)
- 工業專屬式電廠
- 區域供熱營運商
- 運輸燃料分銷商
- 按國家
- 德國
- 英國
- 法國
- 義大利
- 西班牙
- 北歐國家(丹麥、瑞典、芬蘭、挪威)
- 波蘭
- 土耳其
- 俄羅斯
- 其他歐洲國家
第6章 競爭態勢
- 市場集中度
- 策略性舉措(併購、夥伴關係、購電協議)
- 市場佔有率分析(主要企業的市場排名/佔有率)
- 公司簡介
- Veolia Environnement SA
- SUEZ SA
- Hitachi Zosen Inova AG
- Mitsubishi Heavy Industries Environmental & Chemical Engineering Co.
- Martin GmbH
- A2A SpA
- STEAG Energy Services GmbH
- Wheelabrator Technologies
- EEW Energy from Waste GmbH
- Indaver NV
- AVR Afvalverwerking BV
- Viridor Ltd.
- FCC Environment Ltd.
- Zabalgarbi SA
- Tiru SA(Paprec Group)
- Cory Group
- Geminor AS
- Remondis SE & Co. KG
- Babcock & Wilcox Volund A/S
- Keppel Seghers Belgium NV
第7章 市場機會與未來展望
The Europe Waste-to-Energy Market size is estimated at USD 19.04 billion in 2025, and is expected to reach USD 27.18 billion by 2030, at a CAGR of 7.38% during the forecast period (2025-2030).
Policy alignment across EU waste and climate directives, shrinking coal capacity, and rising landfill gate fees lift facility utilization rates. Carbon-linked incentives such as the EU Carbon Border Adjustment Mechanism (CBAM) create new revenue streams while district-heating build-outs in Nordic and Central-Eastern Europe improve project bankability. Large-scale plants above 750 tpd gain momentum because scale lowers capture-ready retrofit costs and eases EU Innovation Fund capital access. Public sensitivity toward urban emissions and wholesale power-price softness temper growth have not derailed newbuild pipelines in Germany, Italy, Poland, the Nordics, and the United Kingdom. As a result, the European waste-to-energy market is consolidating its role as a firm capacity provider that drives landfill diversion.
Europe Waste-to-Energy Market Trends and Insights
EU Waste Framework Directive 2018/851 Targets Driving Diversion from Landfill
The Directive caps municipal landfills at 10% by 2035, pushing member states to add thermal capacity for residual waste streams. Landfilled volumes fell 27.5% between 2010-2020, yet 14 nations risk infringement, accelerating procurement for new incineration and anaerobic digestion plants . Poland and Romania prioritize EU cohesion funds to finance turnkey facilities, compressing approval windows to meet the deadline. Because energy recovery sits above disposal in the hierarchy, municipalities justify higher gate fees that improve project returns. Eastern European authorities see waste-to-energy as a twin answer to landfill diversion and winter-peak electricity deficits, underpinning demand across the European waste-to-energy market.
Upcoming EU Carbon Border Adjustment Mechanism Boosting Demand for Waste-Derived Energy Credits
CBAM's full launch in 2026 monetizes avoided emissions when waste-to-energy electricity displaces fossil generation. Facilities demonstrating lower carbon intensity earn premium certificates that industrial buyers must surrender, effectively subsidizing plant revenues. With EU ETS prices trending above EUR 80/tCO2, certificates enhance internal rates of return for new builds. Developers have started embedding advanced flue-gas treatment to verify carbon factors. The mechanism indirectly shields domestic operators because importers of carbon-heavy electricity face equivalent levies, further strengthening the European waste-to-energy market.
Escalating Public Opposition and Litigation in Urban Hubs
Environmental groups leverage the 2024 European Court of Human Rights ruling on climate action to contest permits, lengthening approval processes. Amsterdam halted a planned plant after resident petitions, while Madrid faces similar pushback. Legal uncertainties raise lender risk premiums and oblige developers to prove exhaustive recycling efforts before incineration. Although public-sector owners such as Copenhagen record higher social acceptance, private concessions increasingly include citizen oversight boards. These dynamics slow project roll-outs in dense cities and curb near-term capacity additions within the European waste-to-energy market.
Other drivers and restraints analyzed in the detailed report include:
- Rapid Decommissioning of Coal Power Plants in Germany Creating Baseload Demand
- District-Heating Expansion in Nordics & CEE Favouring CHP Plants
- Declining Wholesale Power Prices from Wind & Solar Surge
For complete list of drivers and restraints, kindly check the Table Of Contents.
Segment Analysis
Thermal routes generated 60% of segment revenue in 2024, driven by established grate combustion fleets spread across 19 EU members. Gasification and pyrolysis pilots now secure EU Innovation Fund support, indicating policy preference for capture-ready designs. The biological cluster grows at a 12.2% CAGR as anaerobic digestion aligns with the REPowerEU biomethane goal of 35 bcm by 2030. Integrated sites that marry front-end sorting with digestion for organics and combustion for refuse-derived fuel cut residual landfill volumes, boosting circularity metrics. The Europe waste-to-energy market size linked to biological solutions is projected to climb from USD 5.4 billion in 2025 to USD 8.2 billion in 2030, underscoring investor appetite for low-carbon gases.
Thermal suppliers such as Hitachi Zosen Inova, Martin GmbH, and Babcock & Wilcox respond by modularising grate lines and embedding oxy-fuel capture ports. Project sponsors now design flue-gas treatment to exceed Industrial Emissions Directive ceilings, shortening later capture integration lead times. Biological technology providers focus on containerized digesters suitable for small municipalities, broadening addressable volumes. Digital controls that adjust air flow, slag handling, and digester retention times raise availability by close to 92%, enhancing revenue resilience across the European waste-to-energy market.
Municipal solid waste (MSW) represented 62% throughput in 2024, thanks to mature collection logistics and minimum disposal mandates. However, agricultural and agro-industrial residues grow 11.4% annually as farmers monetise manure and crop residues to meet the nitrates directives. The European waste-to-energy market size attributable to agricultural feedstock could reach USD 6.7 billion by 2030, supported by gas-grid injection premiums in Italy and Denmark.
Meat-processing offal and cheese whey supply high-yield biogas streams that cut payback to under 12 months, attracting co-operative-owned digesters. Sewage sludge volumes climb with urban population growth and tighter wastewater rules, prompting water utilities to install sludge incinerators for energy self-sufficiency. Commercial and industrial recyclables such as packaging and textiles offer higher calorific value but demand pre-sort robotics to remove PVC and metals. Blended-feed strategies even out calorific swings and secure year-round supply chains, enhancing plant utilization across the European waste-to-energy market.
The Europe Waste-To-Energy Market Report is Segmented by Technology (Physical, Thermal, and Biological), Waste Type (Municipal Solid Waste, Industrial Waste, Agricultural and Agro-Industrial Residues, Sewage Sludge, and Others), Energy Output (Electricity, Heat, and More), End-User (Industrial Captive Plants, Transport Fuel Distributors, and More), and Country (Germany, United Kingdom, Italy, France, Nordic Countries, and More).
List of Companies Covered in this Report:
- Veolia Environnement SA
- SUEZ SA
- Hitachi Zosen Inova AG
- Mitsubishi Heavy Industries Environmental & Chemical Engineering Co.
- Martin GmbH
- A2A SpA
- STEAG Energy Services GmbH
- Wheelabrator Technologies
- EEW Energy from Waste GmbH
- Indaver NV
- AVR Afvalverwerking BV
- Viridor Ltd.
- FCC Environment Ltd.
- Zabalgarbi S.A.
- Tiru S.A. (Paprec Group)
- Cory Group
- Geminor AS
- Remondis SE & Co. KG
- Babcock & Wilcox Volund A/S
- Keppel Seghers Belgium NV
Additional Benefits:
- The market estimate (ME) sheet in Excel format
- 3 months of analyst support
TABLE OF CONTENTS
1 Introduction
- 1.1 Study Assumptions & Market Definition
- 1.2 Scope of the Study
2 Research Methodology
3 Executive Summary
4 Market Landscape
- 4.1 Market Overview
- 4.2 Market Drivers
- 4.2.1 EU Waste Framework Directive 2018/851 Targets Driving Diversion from Landfill
- 4.2.2 Upcoming EU Carbon Border Adjustment Mechanism Boosting Demand for Waste-Derived Energy Credits
- 4.2.3 Rapid Decommissioning of Coal Power Plants in Germany Creating Baseload Demand for WtE Electricity
- 4.2.4 District-Heating Expansion in Nordics & CEE Favouring CHP WtE Plants
- 4.2.5 Rising Gate Fees for Landfill Operations in the UK & France Enhancing WtE Economics
- 4.2.6 EU Innovation-Fund Grants for Carbon-Capture-Ready WtE Facilities
- 4.3 Market Restraints
- 4.3.1 Escalating Public Opposition & Litigation Against Incineration in Urban Hubs (Amsterdam, Madrid)
- 4.3.2 Declining Wholesale Power Prices from Surging Wind & Solar Undermining WtE Revenue
- 4.3.3 Permitting Delays Under the EU Industrial Emissions Directive Increasing Project Lead-Times
- 4.3.4 Competition from Advanced (Chemical) Recycling Stealing Plastic Feedstock Streams
- 4.4 Supply-Chain Analysis
- 4.5 Regulatory Outlook
- 4.6 Technological Outlook
- 4.7 Porters Five Forces Analysis
- 4.7.1 Bargaining Power of Suppliers
- 4.7.2 Bargaining Power of Buyers
- 4.7.3 Threat of New Entrants
- 4.7.4 Threat of Substitutes
- 4.7.5 Competitive Rivalry
5 Market Size & Growth Forecasts
- 5.1 By Technology
- 5.1.1 Physical (Refuse-Derived Fuel, Mechanical Biological Treatment)
- 5.1.2 Thermal (Incineration/Combustion, Gasification, Pyrolysis and Plasma-Arc)
- 5.1.3 Biological (Anaerobic Digestion, Fermentation)
- 5.2 By Waste Type
- 5.2.1 Municipal Solid Waste (MSW)
- 5.2.2 Industrial Waste
- 5.2.3 Agricultural and Agro-industrial Residues
- 5.2.4 Sewage Sludge
- 5.2.5 Others (Commercial, Construction, Hazardous)
- 5.3 By Energy Output
- 5.3.1 Electricity
- 5.3.2 Heat
- 5.3.3 Combined Heat and Power (CHP)
- 5.3.4 Transportation Fuels (Bio-SNG, Bio-LNG, Ethanol)
- 5.4 By End-user
- 5.4.1 Utilities and Independent Power Producers (IPPs)
- 5.4.2 Industrial Captive Plants
- 5.4.3 District Heating Operators
- 5.4.4 Transport Fuel Distributors
- 5.5 By Country
- 5.5.1 Germany
- 5.5.2 United Kingdom
- 5.5.3 France
- 5.5.4 Italy
- 5.5.5 Spain
- 5.5.6 Nordic Countries (Denmark, Sweden, Finland, Norway)
- 5.5.7 Poland
- 5.5.8 Turkey
- 5.5.9 Russia
- 5.5.10 Rest of Europe
6 Competitive Landscape
- 6.1 Market Concentration
- 6.2 Strategic Moves (M&A, Partnerships, PPAs)
- 6.3 Market Share Analysis (Market Rank/Share for key companies)
- 6.4 Company Profiles (includes Global level Overview, Market level overview, Core Segments, Financials as available, Strategic Information, Products & Services, and Recent Developments)
- 6.4.1 Veolia Environnement SA
- 6.4.2 SUEZ SA
- 6.4.3 Hitachi Zosen Inova AG
- 6.4.4 Mitsubishi Heavy Industries Environmental & Chemical Engineering Co.
- 6.4.5 Martin GmbH
- 6.4.6 A2A SpA
- 6.4.7 STEAG Energy Services GmbH
- 6.4.8 Wheelabrator Technologies
- 6.4.9 EEW Energy from Waste GmbH
- 6.4.10 Indaver NV
- 6.4.11 AVR Afvalverwerking BV
- 6.4.12 Viridor Ltd.
- 6.4.13 FCC Environment Ltd.
- 6.4.14 Zabalgarbi S.A.
- 6.4.15 Tiru S.A. (Paprec Group)
- 6.4.16 Cory Group
- 6.4.17 Geminor AS
- 6.4.18 Remondis SE & Co. KG
- 6.4.19 Babcock & Wilcox Volund A/S
- 6.4.20 Keppel Seghers Belgium NV
7 Market Opportunities & Future Outlook
- 7.1 White-Space & Unmet-Need Assessment
 垃圾焚化發電市場:2026-2032年全球市場預測(按技術、原料類型、工廠產能、發電量、應用、最終用戶和所有權類型分類)
 2026年全球垃圾掩埋沼氣氣化能源(LFGTE)系統市場報告2026年全球垃圾焚化發電(WtE)市場報告
 亞太地區廢棄物製氫(WtH)市場:按應用、技術、廢棄物類型和國家分類的分析和預測(2025-2035 年)
 歐洲廢棄物氫氣市場按應用、技術、垃圾類型和國家分類-分析與預測(2025-2035 年)
 垃圾焚化發電市場報告:按技術、廢棄物類型和地區分類(2026-2034 年)
 先進廢棄物能源化技術市場分析及預測(至2035年):按類型、產品類型、技術、組件、應用、最終用戶、製程、安裝類型、設備和解決方案分類
 2026-2030年全球廢棄物發電市場
 垃圾焚化發電市場-全球產業規模、佔有率、趨勢、機會及預測(依技術、廢棄物類型、應用、地區及競爭格局分類,2021-2031年)全球廢棄物發電用爐排鍋爐市場(按燃料類型、技術類型、容量、安裝類型、運作模式、應用和最終用戶分類)預測(2026-2032年)