


 |
市場調查報告書
商品編碼
1850299
垂直農業:市場佔有率分析、行業趨勢、統計數據和成長預測(2025-2030 年)Vertical Farming - Market Share Analysis, Industry Trends & Statistics, Growth Forecasts (2025 - 2030) |
||||||
※ 本網頁內容可能與最新版本有所差異。詳細情況請與我們聯繫。
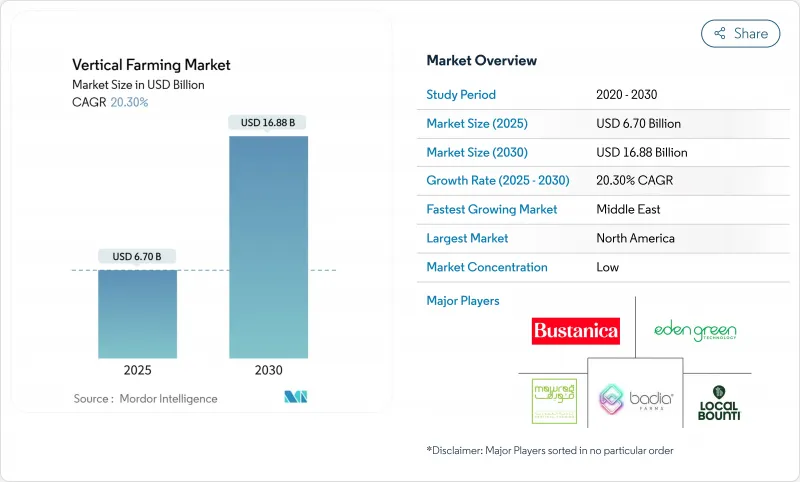
據估計,到 2025 年,垂直農業市場規模將達到 67 億美元,預計到 2030 年將達到 168.8 億美元,預測期內複合年成長率為 20.30%。
強勁的擴張是由都市區土地稀缺、技術成本下降和機構投資增加所驅動的。北美地區在2024年仍保持領先地位,收入佔有率達39.1%,而中東地區到2030年將以15.5%的複合年成長率實現最快成長,這主要得益於糧食安全計劃為大型設施提供資金。水耕技術佔產值的57.1%,但氣耕憑藉其更高的產量面積產量經濟性,以24.1%的複合年成長率超越了水耕技術。照明設備在資本支出方面領先,佔比達38.5%,而空調系統則隨著營運商提高能源效率而實現了20.2%的快速成長。市場競爭仍分散,前五大供應商在2024年的營收佔有率超過20%,但仍有充足的空間容納專業領域的參與企業和區域領導者。
全球垂直農業市場趨勢與洞察
都市化催生了對本地生產的生鮮食品的需求。
到2050年,全球居住預計將達到70%,這將對大都會圈的食品物流帶來越來越大的壓力。像Eden Green這樣的業者能夠在48小時內將生菜從採摘地運送到貨架,將運輸路線從數千英里縮短到都會區內,同時減少99%的土地使用和98%的用水量。新加坡的「30 by 30」策略標誌著這一理念在全國範圍內得到應用,該戰略旨在透過擴大太陽能室內農場的規模,到2030年滿足新加坡三分之一的營養需求。
LED、自動化和人工智慧的成本曲線
照明是目前最大的可控成本。康乃爾大學的測試表明,利用頻譜調諧LED燈和人工智慧調度技術,生菜的能耗從每公斤9.5千瓦時降低到6.42千瓦時。西門子和80Acres Farms進一步展示了數位雙胞胎和機器人技術如何實現全球範圍內的標準化工作流程。
高能源密集度與資本投資
曾經試驗以每公斤生菜12.5千瓦時的最高耗電量進行生產,但這會壓縮電網電價超過每千瓦時0.12美國的地區的利潤空間。發光二極體)目前的平均能耗為每焦耳3.2微莫耳,高於2023年的每焦耳2.5微莫耳。人工智慧控制的暖氣、通風和空調系統(HVAC)可進一步降低25%的能耗。然而,貨櫃維修雖然前期投入成本較低(1.5萬至2萬美元),但其熱容量較低,因此單位能耗成本較高。
細分市場分析
到2024年,水耕法將佔據垂直農業市場57.1%的佔有率。由於其成熟的營養液配方、可擴展的硬體供應以及易於理解的系統維護,水耕法仍然是大型零售商的首選。氣耕以24.1%的複合年成長率成長,利用噴霧水可將生物量成長速度提高30%,並節省95%的用水量。隨著莓果和葡萄種植面積的擴大,氣耕垂直農業市場規模預計將快速成長。雖然目前水耕法的普及率較低,但它透過養魚和養菜創造了互惠互利的收入來源,可以有效抵禦價格波動的影響。
商業性評估會權衡資本密集度和產量。水耕軌道每平方公尺成本為 80 至 100 美元,而氣培塔每平方公尺成本超過 140 美元,但生長週期較短。數據主導的灌溉正在縮小兩者之間的差距,一些營運商已在同一設施內混合使用這兩種方法。保險公司越來越傾向於氣培系統的冗餘性,因為噴霧噴嘴可以隔離根部病害爆發,從而降低召回風險。
到2024年,建築類產品將佔銷售額的61.3%,這反映了超級市場規模的生產能力以及整合屋頂太陽能和配套餘熱回收系統的能力。貨櫃農場以23.5%的複合年成長率成長,部分原因是大學、醫院和企業園區購買了承包模組。 FreightFarm指出,2024年來自非營利組織的訂單成長了32%。
經濟效益取決於資產的使用壽命:建築物折舊期為20至25年,符合綠色債券融資條件;而貨櫃折舊期為7年,且每磅的公用事業成本較高。儘管如此,災害救援機構仍重視貨櫃的機動性,如果極端天氣擾亂供應鏈,他們可以在30天內調派貨櫃。
區域分析
北美仍將是最大的區域貢獻者,預計到2024年將佔全球銷售額的39.1%。美國農業部的補貼、零售商的合作以及消費者願意為本地種植的果蔬支付20-30%的溢價,都推動了這個成長動能。例如,位於喬治亞、耗資5,600萬美元、佔地3萬平方公尺的美國大型綜合設施,就展示瞭如何將棕地倉庫改造為全年供應的供應商。美國的Goodleaf公司則利用水力發電關稅來維持其商品價格的競爭力。
中東是垂直農業發展最快的地區,年複合成長率高達15.5%。主權財富基金正在資助大規模的垂直農場建設,以增強乾旱氣候下的糧食安全。杜拜的ECO-1是世界上最大的垂直農場,目前每年生產超過200萬磅的綠葉蔬菜,阿拉伯聯合大公國計畫在2030年再建500座。這些系統通常與海水淡化廠結合,利用廢熱和鹽水礦物質流來提高資源利用效率。
亞太地區正在經歷多元化的發展。新加坡正加速推進其太陽能塔項目,以實現「2030年實現30座太陽能塔」的目標,而馬來西亞的幾家企業則因電費而被迫關閉。中國一家國營科研院所正專注於多層溫室混合結構,而非全室內系統。歐洲面臨規劃核准和高昂建設成本的雙重挑戰,但一家荷蘭溫室業者正吸引私募股權投資。南美洲正在崛起:智利的AgroUrbana公司籌集了600萬美元,用於將其產能擴大五倍;一家墨西哥營運商正在擴建一個貨櫃式溫室叢集,以服務度假區。
其他福利:
- Excel格式的市場預測(ME)表
- 包含 3 個月的分析師支持
目錄
第1章 引言
- 研究假設和市場定義
- 調查範圍
第2章調查方法
第3章執行摘要
第4章 市場情勢
- 市場概覽
- 市場促進因素
- 都市化催生了新鮮本地農產品的需求。
- LED、自動化和人工智慧的成本曲線
- 極端天氣下的氣候適應糧食系統
- 政府對農業技術的獎勵與投資
- VF企業碳權收入的積累
- 企業ESG現場微型農場安裝
- 市場限制
- 高消費量和高資本投入
- 作物投資組合的盈利窗口期較窄
- 技能差距與營運複雜性
- 基因改造微型菜苗監管路徑尚不明確
- 監管環境
- 技術展望
- 五力分析
- 供應商的議價能力
- 買方的議價能力
- 新進入者的威脅
- 替代品的威脅
- 競爭對手之間的競爭
第5章 市場規模與成長預測
- 透過生長機制
- 水耕法
- 氣耕
- 水耕法
- 按結構
- 建築式垂直農場
- 基於貨櫃的垂直農場
- 按組件
- 照明
- 氣候控制
- 感應器
- 其他水耕組件(營養液計量系統、惰性栽培基質等)
- 按作物
- 番茄
- 莓果
- 生菜和綠葉蔬菜
- 胡椒
- 黃瓜
- 微型菜苗
- 其他作物(菠菜、烹飪香草等)
- 按地區
- 北美洲
- 美國
- 加拿大
- 墨西哥
- 北美其他地區
- 歐洲
- 英國
- 法國
- 瑞典
- 其他歐洲地區
- 亞太地區
- 新加坡
- 中國
- 日本
- 台灣
- 亞太其他地區
- 中東
- 阿拉伯聯合大公國
- 沙烏地阿拉伯
- 以色列
- 其他中東地區
- 非洲
- 南非
- 肯亞
- 其他非洲地區
- 北美洲
第6章 競爭情勢
- 市場集中度
- 策略趨勢
- 市佔率分析
- 公司簡介
- Mowreq Specialized Agriculture Company
- GoodLeaf Farms(TruLeaf)
- Local Bounti Corporation
- Arable Grow
- Badia Farms
- 80 Acres Urban Agriculture Inc.
- Eden Green Technology
- Emirates Bustanica
第7章 市場機會與未來展望
The Vertical Farming Market size is estimated at USD 6.70 billion in 2025 and is projected to reach USD 16.88 billion by 2030, at a CAGR of 20.30% during the forecast period.
Robust expansion stems from tightening urban land availability, technological cost deflation, and rising institutional investment. North America retained leadership with a 39.1% revenue share in 2024, but the Middle East posts the fastest 15.5% CAGR through 2030 as food-security programs finance mega-facilities. Hydroponics held 57.1% of production value, while aeroponics outpaced at 24.1% CAGR thanks to superior yield-per-foot economics. Lighting accounted for the largest 38.5% capital outlay, yet climate-control systems show the quickest 20.2% growth as operators sharpen energy efficiency. Competition remains fragmented, with top-five vendors controlling over 20% of 2024 revenue, leaving ample room for specialized entrants and regional champions.
Global Vertical Farming Market Trends and Insights
Urbanization-driven demand for local fresh produce
Global urban residency is on track to reach 70% by 2050, intensifying pressure on metropolitan food logistics. Operators such as Eden Green deliver lettuce from harvest to shelf within 48 hours, cutting transport routes from thousands of miles to within city limits while using 99% less land and 98% less water. Singapore's "30 by 30" strategy illustrates national-level adoption, and solar-powered indoor farms are scaling to supply one-third of the city-state's nutritional needs by 2030.
LED, automation, and AI cost-down curve
Lighting now represents the single largest controllable expense. Cornell University trials lowered lettuce energy demand from 9.5 kilowatt-hours per kilogram to 6.42 kilowatt-hours per kilogram. Using spectrum-tuned LEDs and AI scheduling. Siemens and 80 Acres Farms further display how digital twins and robotics standardize workflows across global footprints.
High energy intensity and capex
Electricity absorbs 50-65% of operating budgets, trials record 12.5 kilowatt-hours per kilogram of lettuce, pressuring margins where grid tariffs exceed United States dollars 0.12 per kilowatt-hour. Light-emitting diodes now average 3.2 micromoles per joule, up from 2.5 micromoles per joule in 2023, and artificial intelligence-orchestrated heating, ventilation, and air conditioning trims another 25% load. Yet, container retrofits, while cheaper upfront at USD 15,000-20,000, struggle with poorer thermal mass and, thus, higher per-unit energy cost.
Other drivers and restraints analyzed in the detailed report include:
- Climate-resilient food systems amid extreme weather
- Government incentives and ag-tech investments
- Skill gap and operational complexity
For complete list of drivers and restraints, kindly check the Table Of Contents.
Segment Analysis
Hydroponics commanded 57.1% of the vertical farming market in 2024. Proven nutrient recipes, scalable hardware supply, and straightforward system maintenance keep it the first choice for large retailers. Aeroponics, growing at 24.1% CAGR, atomizes water into a fine mist, accelerating biomass by up to 30% and saving 95% water. The vertical farming market size for aeroponics is forecast to climb briskly alongside rising berry and vine-crop adoption. Despite lower current penetration, aquaponics creates symbiotic fish-and-vegetable revenue streams that hedge price volatility.
Commercial evaluations weigh capital intensity against throughput. Hydroponic rails cost USD 80-100 per square meter, while aeroponic towers exceed USD 140 but return faster cycles. Data-driven fertigation is narrowing this gap, and some operators hybridize both methods within the same facility. Insurance underwriters increasingly favor aeroponic redundancy because misting nozzles isolates root disease outbreaks, reducing recall exposure.
Buildings held 61.3% of 2024 revenue, reflecting supermarket-scale volumes and the ability to integrate rooftop solar or co-located waste-heat recovery. Container farms, though only a fraction, rose at 23.5% CAGR as universities, hospitals, and corporate campuses purchased turnkey modules. Freight Farms noted a 32% uptick in orders from nonprofits during 2024.
Economics diverges over asset life. Buildings amortize over 20-25 years and qualify for green-bond financing, containers depreciate in seven years and endure higher per-pound utility costs. Nevertheless, disaster-relief agencies value container mobility, dispatching units within 30 days after extreme weather knocks out supply chains.
The Vertical Farming Market Report is Segmented by Growth Mechanism (Hydroponics, Aeroponics, and Aquaponics), by Structure (Buidling-Based Vertical Farms and More), by Components (Lightning, Sensors, Climate Control, and More), by Crop (Tomato, Berries, Pepper, Cucumber, and More), and by Geography (North America, South America, Asia-Pacific, Europe, and More). The Market Forecasts are Provided in Terms of Value (USD).
Geography Analysis
North America remained the largest regional contributor, delivering 39.1% of 2024 revenue. USDA grants, retailer partnerships, and consumer willingness to pay a 20-30% premium for local greens underpin momentum. U.S. facilities, such as a USD 56 million, 30,000-square-meter complex in Georgia, illustrate how brownfield warehouses convert into year-round suppliers. Canada's GoodLeaf leverages hydroelectric tariffs to maintain a competitive cost of goods.
The Middle East is the vertical farming market's fastest region, expanding at 15.5% CAGR. Sovereign funds finance large enclosures to bolster food security amid arid climates. ECO-1 in Dubai, the world's largest vertical farm, now produces more than 2 million lb of leafy greens each year, and the UAE plans 500 additional sites by 2030. Systems here are frequently coupled with desalination plants, using waste heat and brine mineral streams to enhance resource efficiency.
Asia-Pacific shows mixed signals. Singapore accelerates solar-integrated towers to meet its "30 by 30" target, whereas several ventures in Malaysia shut down due to high electricity tariffs. China's state-backed institutes focus on multi-story greenhouse hybrids rather than full indoor builds. Europe faces zoning hurdles and high construction costs, yet Dutch greenhouse operators attract private equity funding. South America is emergent: Chile's AgroUrbana closed USD 6 million to quintuple capacity, and Mexican operators scale container clusters to serve resort corridors.
- Mowreq Specialized Agriculture Company
- GoodLeaf Farms (TruLeaf)
- Local Bounti Corporation
- Arable Grow
- Badia Farms
- 80 Acres Urban Agriculture Inc.
- Eden Green Technology
- Emirates Bustanica
Additional Benefits:
- The market estimate (ME) sheet in Excel format
- 3 months of analyst support
TABLE OF CONTENTS
1 Introduction
- 1.1 Study Assumptions and Market Definition
- 1.2 Scope of the Study
2 Research Methodology
3 Executive Summary
4 Market Landscape
- 4.1 Market Overview
- 4.2 Market Drivers
- 4.2.1 Urbanization-driven demand for local fresh produce
- 4.2.2 LED, automation, and AI cost-down curve
- 4.2.3 Climate-resilient food systems amid extreme weather
- 4.2.4 Government incentives and Ag-tech investments
- 4.2.5 Carbon-credit revenue stacking for VF operators
- 4.2.6 Corporate ESG on-site micro-farm installations
- 4.3 Market Restraints
- 4.3.1 High energy intensity and capex
- 4.3.2 Narrow crop portfolio profitability window
- 4.3.3 Skill gap and operational complexity
- 4.3.4 Unclear GMO micro-green regulatory pathway
- 4.4 Regulatory Landscape
- 4.5 Technological Outlook
- 4.6 Porters Five Forces
- 4.6.1 Bargaining Power of Suppliers
- 4.6.2 Bargaining Power of Buyers
- 4.6.3 Threat of New Entrants
- 4.6.4 Threat of Substitutes
- 4.6.5 Intensity of Competitive Rivalry
5 Market Size and Growth Forecasts (Value, USD)
- 5.1 By Growth Mechanism
- 5.1.1 Hydroponics
- 5.1.2 Aeroponics
- 5.1.3 Aquaponics
- 5.2 By Structure
- 5.2.1 Building-based Vertical Farms
- 5.2.2 Shipping-Container-based Vertical Farms
- 5.3 By Components
- 5.3.1 Lighting
- 5.3.2 Climate Control
- 5.3.3 Sensors
- 5.3.4 Other Hydroponic Components (nutrient dosing systems, inert grow media, etc.)
- 5.4 By Crop
- 5.4.1 Tomato
- 5.4.2 Berries
- 5.4.3 Lettuce and Leafy Greens
- 5.4.4 Pepper
- 5.4.5 Cucumber
- 5.4.6 Microgreens
- 5.4.7 Other Crops (spinach, culinary herbs, etc.)
- 5.5 By Geography
- 5.5.1 North America
- 5.5.1.1 United States
- 5.5.1.2 Canada
- 5.5.1.3 Mexico
- 5.5.1.4 Rest of North America
- 5.5.2 Europe
- 5.5.2.1 United Kingdom
- 5.5.2.2 France
- 5.5.2.3 Sweden
- 5.5.2.4 Rest of Europe
- 5.5.3 Asia-Pacific
- 5.5.3.1 Singapore
- 5.5.3.2 China
- 5.5.3.3 Japan
- 5.5.3.4 Taiwan
- 5.5.3.5 Rest of Asia-Pacific
- 5.5.4 Middle East
- 5.5.4.1 United Arab Emirates
- 5.5.4.2 Saudi Arabia
- 5.5.4.3 Israel
- 5.5.4.4 Rest of Middle East
- 5.5.5 Africa
- 5.5.5.1 South Africa
- 5.5.5.2 Kenya
- 5.5.5.3 Rest of Africa
- 5.5.1 North America
6 Competitive Landscape
- 6.1 Market Concentration
- 6.2 Strategic Moves
- 6.3 Market Share Analysis
- 6.4 Company Profiles (includes Global level Overview, Market level overview, Core Segments, Financials as available, Strategic Information, Market Rank/Share for key companies, Products and Services, and Recent Developments)
- 6.4.1 Mowreq Specialized Agriculture Company
- 6.4.2 GoodLeaf Farms (TruLeaf)
- 6.4.3 Local Bounti Corporation
- 6.4.4 Arable Grow
- 6.4.5 Badia Farms
- 6.4.6 80 Acres Urban Agriculture Inc.
- 6.4.7 Eden Green Technology
- 6.4.8 Emirates Bustanica
7 Market Opportunities and Future Outlook
 垂直農業市場(按產品、照明類型、作物類型、系統、安裝類型和最終用戶分類)—2025-2032 年全球預測
 垂直農業市場-全球產業規模、佔有率、趨勢、機會和預測,按結構、生長機制、作物類型、成分、應用、地區和競爭進行細分,2020-2030 年
 2025年垂直農業全球市場報告
 2032年垂直農業市場預測:按作物類型、成分、結構、系統、應用和地區進行的全球分析
 美國垂直農業:市場佔有率分析、行業趨勢和成長預測(2025-2030 年)
 垂直農業市場:2025-2029 年全球
 垂直農業市場機會、成長動力、產業趨勢分析及 2025 - 2034 年預測
 2025-2033年垂直農業市場報告(按組件、結構、成長機制、應用和地區)日本垂直農業市場報告(按組件、結構、成長機制、應用和地區)2025-2033全球垂直農業市場:市場規模、佔有率和趨勢分析(按組成部分、栽培方式、作物、結構和地區),按細分市場預測(2025-2030 年)