


 |
市場調查報告書
商品編碼
1850042
北美綠色資料中心:市場佔有率分析、行業趨勢、統計數據和成長預測(2025-2030 年)North America Green Data Center - Market Share Analysis, Industry Trends & Statistics, Growth Forecasts (2025 - 2030) |
||||||
※ 本網頁內容可能與最新版本有所差異。詳細情況請與我們聯繫。
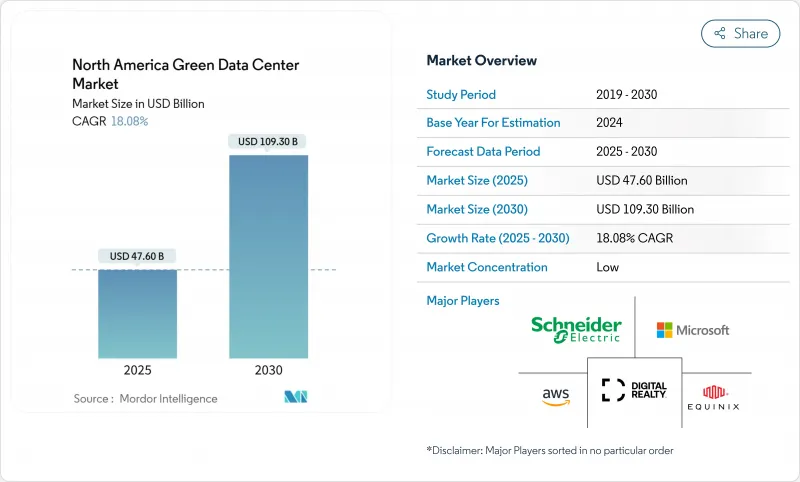
預計到 2025 年,北美綠色資料中心市場規模將達到 476 億美元,到 2030 年將達到 1,093 億美元,年複合成長率為 18.08%。
人工智慧工作負載的不斷成長(預計到2023年將消耗176太瓦時電力)、可再生能源購電協議(PPA)的擴展以及積極的超大規模投資計劃,都為美國能源部(Energy.gov)的這項舉措提供了支持。超大規模雲端平台持續建造數吉瓦級園區,推動了對高密度液冷和現場清潔能源發電的需求。託管服務提供者正競相滿足企業淨零排放的要求,並將永續性指標納入服務水準協議。儘管電網互聯的延遲和技術純熟勞工短缺仍然是阻礙因素,但高層政策的支持,加上人工智慧驅動的氣流最佳化技術突破,將使市場在未來十年保持成長勢頭。
北美綠色資料中心市場趨勢與洞察
北美超大規模建築項目激增
超大規模營運商正斥巨資興建千兆瓦級園區,這些園區整合了現場太陽能發電、天然氣尖峰電廠和核能資源。蘋果在德克薩斯州、加州和北卡羅來納州投資5,000億美元興建人工智慧設施,與微軟在北美800億美元的擴張計畫遙相呼應。 Meta公司在路易斯安那州投資100億美元建造一個綜合設施,該設施將擁有高達4吉瓦的基本負載核能發電容量。基礎設施建設公司Mason預測,一個能夠容納10吉瓦叢集的清潔能源園區將使該地區成為全球永續超大規模發展的標竿。這場「軍備競賽」推動北美綠色資料中心市場超大規模容量以24.4%的複合年成長率成長。
企業淨零排放指令再形成託管服務招標書
在選擇託管合作夥伴時,企業越來越重視可再生能源的使用,而不是延遲和價格。 Iron Mountain 自 2017 年以來一直使用再生能源為其資料中心供電,並建造了北美首個獲得 BREEAM 認證的資料中心,從而樹立了新的採購標竿。微軟的「2030 年碳負排放承諾」和「2025 年 100%可再生能源要求」貫穿整個供應鏈,鼓勵供應商採用與永續性掛鉤的貸款和科學碳目標。能夠證明其減碳檢驗的供應商將獲得優先競標權,使環境績效成為決定性的競爭優勢。
永續材料的前期投資溢價
低碳混凝土、散裝木材和電弧爐煉鋼的更高的價格仍高達兩位數。微軟昆西試點計畫將碳排放量減少了50%,但需要客製化混合料,而這些混合料只有少數供應商能夠提供。亞馬遜已公開宣布,即使考慮到批量折扣,其43個新建中心仍將額外投入資金用於低碳鋼。雖然從長遠來看,能源和品牌效益可以抵消這些成本,但在高價格分佈的大都會圈,如果沒有綠色債券資金籌措或稅收優惠,開發商很難使計劃獲利。
細分市場分析
解決方案將繼續主導北美綠色資料中心市場,預計2024年將佔總收入的63.1%,因為營運商正在投資高效電力、液冷和人工智慧管理平台。這種優勢帶來了規模經濟效益,但隨著採購轉向標準化、利潤率較低的硬體,成長速度將會放緩。相較之下,服務預計將以22.1%的複合年成長率成長,因為淨零排放藍圖需要持續最佳化、碳計量和合規性審核。託管式永續發展服務將即時能源儀錶板與諮詢支援相結合,以幫助設施符合科學碳目標。
營運商為系統整合支付高額費用,期望從風冷機房無縫切換到晶片直冷迴路,且無需停機。這種複雜的維修依賴於能夠設計流體網路、處理洩漏檢測數據並最大限度減少體積排放的專業公司。因此,即使設備價格面臨通貨緊縮壓力,每千瓦的業務收益仍在成長,從而支撐了綠色資料中心市場長期穩健的構成比。
受人工智慧工作負載強度和垂直整合的清潔能源採購模式的驅動,超大規模資料中心營運商將在2024年佔據北美綠色資料中心市場36.1%的佔有率,並在2030年之前以24.4%的複合年成長率成長。這主要得益於他們簽訂的大量前期風能、太陽能、小型核能和天然氣契約,而規模較小的競爭對手難以匹敵。這些公司正擴大採用預製電氣室和液冷歧管等方式,以縮短建設週期,從而支援人工智慧產品的推出。
為了應對超大規模資料中心的激增,託管服務提供者正在對其園區進行改造。新型託管服務供應商提供配備無水冷卻系統的 100MW 資料中心模組,並包含與永續性相關的租賃條款,以及直連主流雲端平台的光纖通道。邊緣和企業級資料中心規模較小,但專注於對延遲敏感的工作負載,例如遠端醫療和遊戲。對可再生微電網的投資表明,分散式資料中心可以超越企業平均碳排放目標,從而擴大北美綠色資料中心市場的潛在用戶群。
北美綠色資料中心市場報告將產業細分為服務(系統整合、監控服務、專業服務、其他服務)、解決方案(電力、伺服器、管理軟體、其他)、使用者(託管服務供應商、雲端服務供應商、企業)和最終用戶產業(醫療保健、金融服務、政府、其他)。市場預測以美元計價。
其他福利:
- Excel格式的市場預測(ME)表
- 3個月的分析師支持
目錄
第1章 引言
- 研究假設和市場定義
- 調查範圍
第2章調查方法
第3章執行摘要
第4章 市場情勢
- 市場概覽
- 市場促進因素
- 北美超大規模建築項目激增
- 企業淨零排放目標重塑了資料中心託管招標書
- 公共產業層面可再生能源購電協議價格下降
- 人工智慧驅動的氣流最佳化可降低營運成本
- 模組化液冷改裝的興起
- 數據資產碳權貨幣化試點項目
- 市場限制
- 永續材料的初始投資溢價
- 區域電網擁塞和互聯隊列積壓
- 低碳混凝土和鋼材供應有限
- 高密度部署中技術純熟勞工短缺
- 供應鏈分析
- 監管環境
- 技術展望
- 波特五力分析
- 供應商的議價能力
- 買方的議價能力
- 新進入者的威脅
- 替代品的威脅
- 競爭對手之間的競爭
- 評估宏觀經濟趨勢對市場的影響
第5章 市場規模與成長預測
- 按組件
- 透過服務
- 系統整合
- 監控服務
- 專業服務
- 其他服務
- 透過解決方案
- 電力
- 冷卻
- 伺服器
- 網路裝置
- 管理軟體
- 其他解決方案
- 透過服務
- 依資料中心類型
- 託管服務提供者
- 超大規模資料中心業者/雲端服務供應商
- 企業和邊緣運算
- 依層級類型
- 一級和二級
- 三級
- 第四級
- 按行業
- 衛生保健
- 金融服務
- 政府
- 通訊/IT
- 製造業
- 媒體與娛樂
- 其他行業
- 按國家/地區
- 美國
- 加拿大
- 墨西哥
第6章 競爭情勢
- 市場集中度
- 策略趨勢
- 市佔率分析
- 公司簡介
- Schneider Electric SE
- Vertiv Holdings Co
- Eaton Corporation plc
- Cisco Systems Inc.
- Dell Technologies Inc.
- Hewlett Packard Enterprise
- Fujitsu Ltd
- IBM Corp.
- Hitachi Ltd
- Equinix Inc.
- Digital Realty Trust Inc.
- QTS Realty Trust LLC
- CyrusOne Inc.
- Switch Inc.
- Iron Mountain Data Centers
- Amazon Web Services
- Microsoft Corp.
- Google LLC
- Meta Platforms Inc.
- Rittal GmbH and Co. KG
第7章 市場機會與未來展望
The North America green data center market size reached USD 47.6 billion in 2025 and is on track to hit USD 109.3 billion by 2030, expanding at an 18.08% CAGR.
Escalating AI workloads that consumed 176 TWh of electricity in 2023, wide-scale renewable power purchase agreements (PPAs), and aggressive hyperscale investment plans underpin this advance energy.gov. Hyperscale cloud platforms continue to build multi-gigawatt campuses, pulling forward demand for high-density liquid cooling and on-site clean energy generation. Colocation operators are racing to satisfy corporate net-zero mandates, weaving sustainability metrics into service-level agreements that now influence the majority of North American requests for proposal. Grid interconnection delays and skilled-labor gaps remain headwinds, yet executive-level policy support combined with technology breakthroughs in AI-driven airflow optimisation sustain the market's momentum through the decade.
North America Green Data Center Market Trends and Insights
Soaring hyperscale build-outs across North America
Hyperscale operators are pouring capital into gigawatt-scale campuses that integrate on-site solar, natural-gas peaker plants, and nuclear energy allocations. Apple committed USD 500 billion for AI-ready facilities across Texas, California, and North Carolina, echoing Microsoft's USD 80 billion North American expansion plan. Meta is channeling USD 10 billion into a Louisiana complex supported by up to 4 GW of baseload nuclear capacity. Infrastructure Masons forecasts clean-energy parks capable of hosting 10 GW clusters, positioning the region as the global benchmark for sustainable hyperscale development. This arms race underwrites the 24.4% CAGR for hyperscale capacity within the North America green data center market.
Corporate net-zero mandates reshaping colocation RFPs
Enterprises now rank renewable-energy alignment ahead of latency or price when choosing colocation partners. Iron Mountain has matched 100% of its data-center load with renewables since 2017 and built North America's first BREEAM-certified site, driving new procurement benchmarks. Microsoft's 2030 carbon-negative pledge and 2025 100% renewable coverage requirement cascade through supply chains, pushing vendors to adopt sustainability-linked loans and science-based targets. Providers demonstrating verifiable carbon reductions gain preferred-bidder status, elevating environmental performance to a decisive competitive lever.
Up-front capex premium of sustainable materials
Low-carbon concrete, mass timber, and electric-arc-furnace steel still price at double-digit premiums. Microsoft's pilot in Quincy cut embodied carbon by 50% but required bespoke mixes available from only a handful of suppliers. Amazon disclosed extra capex for lower-carbon steel across 43 new centres, even after accounting for volume discounts. While long-run energy and brand benefits offset these costs, developers in high-priced metros struggle to make projects pencil without green-bond proceeds or tax incentives.
Other drivers and restraints analyzed in the detailed report include:
- Utility-level renewable PPA price declines
- AI-driven airflow optimisation cutting OpEx
- Regional grid congestion and interconnection backlog
For complete list of drivers and restraints, kindly check the Table Of Contents.
Segment Analysis
Solutions continued to dominate the North America green data center market, holding 63.1% revenue in 2024 as operators invested in efficient power, liquid cooling, and AI-enabled management platforms. This dominance delivers scale economies, but growth moderates as procurement shifts toward standardised, lower-margin hardware. Services, by contrast, are forecast to expand at 22.1% CAGR because net-zero roadmaps require continuous optimisation, carbon accounting, and compliance audits. Managed sustainability offerings now bundle real-time energy dashboards with advisory support that aligns facilities with Science-Based Targets.
Operators paying premium rates for system integration expect seamless cut-over from air-cooled halls to direct-to-chip loops without downtime. These complex retrofits rely on specialist firms that can design fluid networks, process leak detection data, and minimise embodied emissions. As a result, services revenue per kilowatt is rising even as equipment pricing faces deflationary pressure, underpinning a resilient long-term mix within the North America green data center market.
Hyperscalers captured 36.1% of the North America green data center market size in 2024, thanks to AI workload intensity and vertically integrated clean-energy procurement. Their 24.4% CAGR to 2030 draws on massive forward contracts for wind, solar, small-modular nuclear, and gas-peaking assets that smaller peers cannot match. These players increasingly pre-fabricate electrical rooms and liquid-cooling manifolds, shrinking construction cycles to meet AI product-launch windows.
Colocation providers are retooling campuses to win hyperscale spill-over deals. New builds feature 100 MW blocks with waterless cooling, sustainability-linked lease clauses, and direct fibre to major cloud on-ramps. Edge and enterprise sites, while smaller, focus on latency-sensitive workloads such as telemedicine and gaming. Their investment in renewable micro-grids illustrates how decentralised sites can still exceed corporate-average carbon goals, broadening the addressable pool for the North America green data center market.
North America Green Data Center Market Report Segments the Industry Into Service (System Integration, Monitoring Services, Professional Services, Other Services), Solution (Power, Servers, Management Software, and More), User (Colocation Providers, Cloud Service Providers, Enterprises), and End-User Industry (Healthcare, Financial Services, Government, and More). The Market Forecasts are Provided in Terms of Value (USD).
List of Companies Covered in this Report:
- Schneider Electric SE
- Vertiv Holdings Co
- Eaton Corporation plc
- Cisco Systems Inc.
- Dell Technologies Inc.
- Hewlett Packard Enterprise
- Fujitsu Ltd
- IBM Corp.
- Hitachi Ltd
- Equinix Inc.
- Digital Realty Trust Inc.
- QTS Realty Trust LLC
- CyrusOne Inc.
- Switch Inc.
- Iron Mountain Data Centers
- Amazon Web Services
- Microsoft Corp.
- Google LLC
- Meta Platforms Inc.
- Rittal GmbH and Co. KG
Additional Benefits:
- The market estimate (ME) sheet in Excel format
- 3 months of analyst support
TABLE OF CONTENTS
1 INTRODUCTION
- 1.1 Study Assumptions and Market Definition
- 1.2 Scope of the Study
2 RESEARCH METHODOLOGY
3 EXECUTIVE SUMMARY
4 MARKET LANDSCAPE
- 4.1 Market Overview
- 4.2 Market Drivers
- 4.2.1 Soaring hyperscale build-outs across North America
- 4.2.2 Corporate net-zero mandates reshaping colocation RFPs
- 4.2.3 Utility-level renewable PPA price declines
- 4.2.4 AI-driven airflow optimisation cutting OpEx
- 4.2.5 Rise of modular liquid-cooling retrofits
- 4.2.6 Carbon-credit monetisation pilots in data estates
- 4.3 Market Restraints
- 4.3.1 Up-front capex premium of sustainable materials
- 4.3.2 Regional grid-congestion and interconnection queue backlog
- 4.3.3 Limited availability of low-carbon concrete and steel
- 4.3.4 Skilled-labour shortage for high-density deployments
- 4.4 Supply-Chain Analysis
- 4.5 Regulatory Landscape
- 4.6 Technological Outlook
- 4.7 Porters Five Forces Analysis
- 4.7.1 Bargaining Power of Suppliers
- 4.7.2 Bargaining Power of Buyers
- 4.7.3 Threat of New Entrants
- 4.7.4 Threat of Substitutes
- 4.7.5 Competitive Rivalry
- 4.8 Assessment of the impact of Macro Economic Trends on the Market
5 MARKET SIZE AND GROWTH FORECASTS (VALUE)
- 5.1 By Component
- 5.1.1 By Service
- 5.1.1.1 System Integration
- 5.1.1.2 Monitoring Services
- 5.1.1.3 Professional Services
- 5.1.1.4 Other Services
- 5.1.2 By Solution
- 5.1.2.1 Power
- 5.1.2.2 Cooling
- 5.1.2.3 Servers
- 5.1.2.4 Networking Equipment
- 5.1.2.5 Management Software
- 5.1.2.6 Other Solutions
- 5.1.1 By Service
- 5.2 By Data Center Type
- 5.2.1 Colocation Providers
- 5.2.2 Hyperscalers/Cloud Service Providers
- 5.2.3 Enterprise and Edge
- 5.3 By Tier Type
- 5.3.1 Tier 1 and 2
- 5.3.2 Tier 3
- 5.3.3 Tier 4
- 5.4 By Industry Vertical
- 5.4.1 Healthcare
- 5.4.2 Financial Services
- 5.4.3 Government
- 5.4.4 Telecom and IT
- 5.4.5 Manufacturing
- 5.4.6 Media and Entertainment
- 5.4.7 Other Verticals
- 5.5 By Country
- 5.5.1 United States
- 5.5.2 Canada
- 5.5.3 Mexico
6 COMPETITIVE LANDSCAPE
- 6.1 Market Concentration
- 6.2 Strategic Moves
- 6.3 Market Share Analysis
- 6.4 Company Profiles (includes Global level Overview, Market level overview, Core Segments, Financials as available, Strategic Information, Market Rank/Share for key companies, Products and Services, and Recent Developments)
- 6.4.1 Schneider Electric SE
- 6.4.2 Vertiv Holdings Co
- 6.4.3 Eaton Corporation plc
- 6.4.4 Cisco Systems Inc.
- 6.4.5 Dell Technologies Inc.
- 6.4.6 Hewlett Packard Enterprise
- 6.4.7 Fujitsu Ltd
- 6.4.8 IBM Corp.
- 6.4.9 Hitachi Ltd
- 6.4.10 Equinix Inc.
- 6.4.11 Digital Realty Trust Inc.
- 6.4.12 QTS Realty Trust LLC
- 6.4.13 CyrusOne Inc.
- 6.4.14 Switch Inc.
- 6.4.15 Iron Mountain Data Centers
- 6.4.16 Amazon Web Services
- 6.4.17 Microsoft Corp.
- 6.4.18 Google LLC
- 6.4.19 Meta Platforms Inc.
- 6.4.20 Rittal GmbH and Co. KG
7 MARKET OPPORTUNITIES AND FUTURE OUTLOOK
- 7.1 White-space and Unmet-need Assessment
 綠色資料中心市場:按組件、資料中心類型、冷卻方式和最終用戶分類-2026年至2032年全球市場預測
 氫能資料中心市場預測至2034年-按發電系統、能源來源、設施類型、應用、最終用戶和地區分類的全球分析碳中和資料中心市場預測至2034年-按資料中心類型、能源來源、技術、應用、最終用戶和地區分類的全球分析
 綠色資料中心市場規模、佔有率、趨勢和預測:按組件、資料中心類型、行業和地區分類,2026-2034年
 2026年全球綠色人工智慧(AI)資料中心市場報告
 環保資料中心市場分析及預測(至2035年):類型、產品類型、服務、技術、組件、應用、部署模式、最終用戶、解決方案、階段碳中和資料中心市場:分析與預測(至 2035 年)—按類型、產品類型、服務、技術、組件、應用、部署模式、最終用戶、解決方案、模式分類綠色資料中心市場分析與預測(至2035年):類型、產品類型、服務、技術、元件、應用、部署模式、最終使用者、解決方案碳中和資料中心市場:2026-2032年全球市場預測(按產品類型、資料中心類型、部署規模和最終用戶產業分類)2026年全球碳中和資料中心市場報告