


 |
市場調查報告書
商品編碼
1836704
中重型商用車市場:市場佔有率分析、行業趨勢、統計數據和成長預測(2025-2030 年)Medium And Heavy Duty Commercial Vehicles - Market Share Analysis, Industry Trends & Statistics, Growth Forecasts (2025 - 2030) |
||||||
※ 本網頁內容可能與最新版本有所差異。詳細情況請與我們聯繫。
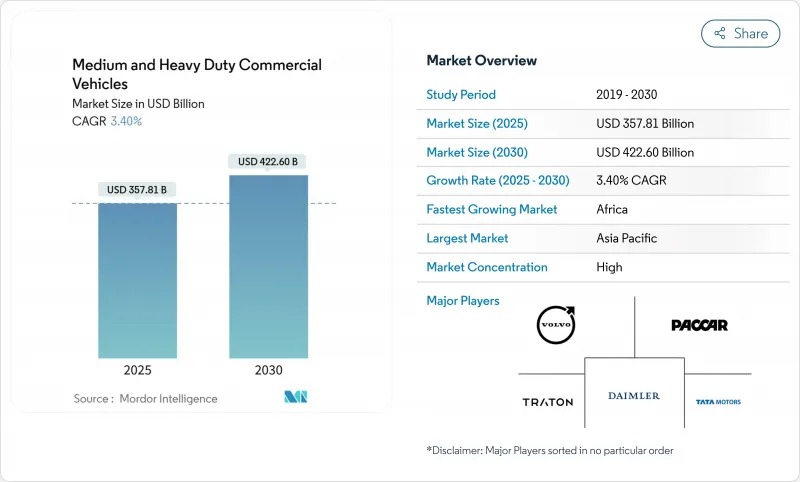
預計 2025 年中重型商用車市場規模將達到 3,578.1 億美元,到 2030 年預計將達到 4,226 億美元,預測期內(2025-2030 年)的複合年成長率為 3.40%。
這得歸功於亞太、拉丁美洲和非洲地區的基礎設施現代化,同時,歐洲符合歐VII標準的車輛數量和北美符合EPA 2027標準的車輛數量也在增加。監管趨同正在縮短更換週期,但內燃機汽車仍佔據主導地位,而純電動車的基數較小,銷售量正在不斷擴大。公共部門對道路和物流走廊的獎勵策略、電子商務對輕型卡車的需求,以及能夠改善總體擁有成本和安全分析的軟體定義汽車平臺,都將進一步推動成長。
全球中重型商用車市場趨勢與洞察
歐盟VII和EPA 2027排放氣體標準推動汽車更新換代
嚴格的氮氧化物和二氧化碳法規正在加速歐洲舊歐VI之前柴油機組的更換,並迫使北美比計劃更早更新其6-8級庫存。最近採用的歐7標準實施了嚴格的限制,尤其是對重型車輛(HDV)。根據測試週期,它將氮氧化物(NOx)的限制降低了50%到62%。它還用更嚴格、更明確的非甲烷有機氣體(NMOG)和甲烷(CH4)限制取代了總碳氫化合物(THC)的限制。調整時機會給供應商帶來負擔,但會為後處理和電池技術創造規模經濟。加州的先進清潔卡車法規涵蓋了美國25%的市場,要求在2030年實現50%的零排放銷售。早期採用者受益於獎勵池和殘值溢價,而後來者則面臨供不應求和合規成本上升的問題。擁有現有電氣產品系列的製造商可以享受先發優勢,並在兩個地區攤提開發成本。
新興國家基礎設施獎勵策略
印度、印尼、馬來西亞和主要拉丁美洲國家政府支持的道路和能源項目持續推動中重型商用車市場的需求。印度的FAME框架設定的目標是到2030年將電動商用車的普及率提高到70%,該框架支持了電動卡車銷量每年49%的成長,並鼓勵供應商實現電池模組和動力傳動系統的本地化。印尼和馬來西亞類似的多年期道路建設和電氣化措施正在推動區域規模化發展。同時,美洲開發銀行估計,協調一致的獎勵可望使拉丁美洲在全球電動卡車銷售中的佔有率到2030年從0.45%提升至4%。這些措施提供了超越通常七年更換週期的採購可見性,使零件製造商能夠確保產能並降低資本支出風險。經濟獎勵策略和在地採購規則的結合,為底盤、駕駛室和充電基礎設施供應商提供了穩定的訂單管道。
零排放卡車的初始成本高
電池組佔單位成本的40%,這使得電動重型卡車比柴油卡車貴20-30%。隨著磷酸鐵鋰化學成分的擴大,預計總成本將在四年內持平,但許多小型車隊缺乏資金籌措能力。卡車即服務合約和電池租賃可以幫助製造商創造經常性收益,同時將購買成本降低高達42%。雖然大型車隊已經採用了這些模式,但在新興市場,由於信貸受限的買家仍然面臨高昂的門檻利率,這些模式的普及速度緩慢。
報告中分析的其他促進因素和限制因素
- 電子商務物流的擴張
- 利用基於遠端資訊處理的使用情況保險降低整體擁有成本
- 電池供應鏈瓶頸
細分分析
2024年,16噸以上車型約佔中重型商用車市場佔有率的60.26%,佔中重型商用車市場最大佔有率。遠距貨運網路優先考慮負載容量而非充電便利性,這推動了需求成長。相比之下,由於城市配送平台的普及,3.5-7.5噸級的中重型商用車的複合年成長率達到7.81%,增速超過其他所有頻寬。由於100-200千瓦時的電池組即可涵蓋日常路線,該等級車型對電池的要求較低,從而降低了資本支出和充電複雜性。同時,7.5-16噸級的中型車輛正經歷與建築和市政採購週期相關的穩定更換趨勢。
電池容量與車輛品質成正比,重型運輸車輛需要500千瓦時或更高的電池容量才能滿足預期的工作週期。這項要求增加了車輛重量和基礎設施成本,與輕型車輛相比,電氣化進程有所放緩。監管機構根據車輛總重來區分限制,迫使製造商在其工程藍圖中平衡後後處理和零排放設計。儘管成本存在差異,但一些礦業公司正在試用150噸級的電動自動卸貨卡車,一旦充電網路到位,這可能會在生命週期內節省成本。
就2024年中重型商用車市佔率而言,內燃機將以91.72%的銷售量維持領先地位。然而,由於補貼、營業成本下降以及都市區的快速普及,純電動卡車正處於快速成長軌道,到2030年的複合年成長率將達到9.83%。在電動續航里程和電網接入仍面臨挑戰的地區,壓縮天然氣和液化天然氣等替代燃料將繼續佔據市場領先地位。對於必須在續航里程靈活性和零排放城市准入之間取得平衡的營運商來說,插電式混合動力汽車是一種過渡解決方案。
到2024年,中國將佔全球電動重型卡車銷量的80%以上,體現了合作獎勵和區域供應鏈的影響力。燃料電池電動車原型車正在德國、韓國和美國進行早期試驗,用於遠距運輸,因為電池品質會影響負載容量。因此,到2030年,推進系統組合可能會有所不同,具體取決於總擁有成本的計算、能源價格趨勢和基礎設施部署。
區域分析
受中國製造業深度和印度不斷擴張的政策推動,亞太地區將在2024年佔據全球銷售額的45.52%。預計到2030年,隨著目標商標產品製造商將電池工廠、軟體中心和零件測試中心設在最大買家附近,該地區的領先地位將進一步擴大。光是中國就將在2024年支持超過9萬輛電動重型卡車的註冊,比亞迪和上汽將向匈牙利和印尼出口套件,以分散其關稅風險。印度有14個邦的獎勵計劃,北方邦和馬哈拉斯特拉邦可以建立有利於3.5噸電動卡車的市級低排放氣體區。
北美和歐洲是成熟且利潤豐厚的市場,協調一致的法規確保了技術的統一。歐盟的目標是到2030年將重型卡車的二氧化碳排放量減少45%,歐VII標準將於2029年生效。加州的先進清潔卡車法規正在影響國家採購計劃,其他11個州也採用了該藍圖,涵蓋了美國6-8級卡車需求的四分之一。加拿大的目標是到2030年實現35%的零排放卡車銷量,並正在資助在橫貫加拿大高速公路上建造充電走廊。在企業方面,沃爾沃和戴姆勒已成立合資企業,以建立通用的作業系統,而佩卡正在整合其內部電池組,以防止波動。
儘管初期投資規模不大,但非洲的投資動能強勁,複合年成長率高達9.10%。摩洛哥和埃及已訂購與中型卡車共用的電動公車,使其成為該地區供應的核心。衣索比亞已超額完成2030年公車電氣化目標,展現了密集型採購模式的潛力。南非的電動車白皮書提出了雙平台藍圖,將現有柴油車輛的燃油效率提升與在採礦帶周圍建造快速充電站的獎勵相結合。這些舉措預示著潛在的需求,如果電網可靠性提高,出貨量可能會實現兩位數成長。
其他福利:
- Excel 格式的市場預測 (ME) 表
- 3個月的分析師支持
目錄
第1章 引言
- 研究假設和市場定義
- 調查範圍
第2章調查方法
第3章執行摘要
第4章 市場狀況
- 市場概況
- 市場促進因素
- 因歐盟 VII 和 EPA 2027排放氣體法規而更新車輛
- 新興國家基礎設施獎勵策略
- 電子商務物流的擴張
- 採礦業大力推行電池電動運輸卡車
- 基於遠端資訊處理的使用保險可降低整體擁有成本
- 二次電池租賃模式
- 市場限制
- 零排放卡車的初始成本很高
- 電力電子和電池供應鏈瓶頸
- 車站級電網容量限制
- 混合動力電動車傳動系統技術熟練的工程師短缺
- 價值/供應鏈分析
- 監管狀況
- 技術展望
- 波特五力分析
- 新進入者的威脅
- 買方的議價能力
- 供應商的議價能力
- 替代品的威脅
- 競爭對手之間的競爭強度
第5章市場規模與成長預測:價值(美元)與數量(單位)
- 按噸位
- 3.5至7.5噸
- 7.5至16噸
- 超過16噸
- 依推進類型
- 內燃機(柴油、汽油)
- 電池電動
- 插電式混合動力
- 燃料電池電力
- 替代燃料(CNG、LNG、生質燃料、LPG)
- 按車輛類型
- 剛性卡車
- 聯結車
- 自卸卡車/自動卸貨卡車
- 專用卡車和商用卡車
- 按最終用戶產業
- 物流/運輸
- 建築和採礦
- 農業/林業
- 公共工程和市政服務
- 按地區
- 北美洲
- 美國
- 加拿大
- 北美其他地區
- 南美洲
- 巴西
- 阿根廷
- 其他南美
- 歐洲
- 德國
- 英國
- 法國
- 西班牙
- 義大利
- 俄羅斯
- 其他歐洲國家
- 亞太地區
- 中國
- 印度
- 日本
- 韓國
- 澳洲
- 其他亞太地區
- 中東和非洲
- 阿拉伯聯合大公國
- 沙烏地阿拉伯
- 土耳其
- 南非
- 埃及
- 其他中東和非洲地區
- 北美洲
第6章 競爭態勢
- 市場集中度
- 策略趨勢
- 市佔率分析
- 公司簡介
- Daimler Truck AG
- Volvo Group
- Traton SE(MAN, Scania, Navistar)
- PACCAR Inc.
- Tata Motors Ltd.
- Hyundai Motor Co.
- CNHTC(Sinotruk)
- Dongfeng Motor Corp.
- FAW Group
- Renault Trucks
- Isuzu Motors Ltd.
- Hino Motors
- Ashok Leyland
- Iveco Group
- Kamaz PJSC
- Shacman(Shaanxi Auto)
- UD Trucks
- BYD Auto
- Nikola Corp.
第7章 市場機會與未來展望
The Medium and Heavy Duty Commercial Vehicles Market size is estimated at USD 357.81 billion in 2025, and is expected to reach USD 422.60 billion by 2030, at a CAGR of 3.40% during the forecast period (2025-2030).
This measured expansion comes as fleets align with Euro VII in Europe and EPA 2027 in North America while modernizing infrastructure across Asia-Pacific, Latin America, and Africa. Regulatory convergence has tightened replacement cycles, yet internal combustion engines dominate sales, and battery-electric models are scaling from a small base. Growth is further reinforced by public-sector stimulus for road and logistics corridors, e-commerce demand for lighter trucks, and software-defined vehicle platforms that improve total cost of ownership and safety analytics.
Global Medium And Heavy Duty Commercial Vehicles Market Trends and Insights
Fleet Renewal Driven by Euro VII & EPA 2027 Emission Rules
Stringent NOx and CO2 targets accelerate the replacement of pre-Euro VI and older diesel units in Europe and compel North American fleets to refresh Class 6-8 inventories sooner than planned. Recently adopted Euro 7 standards impose stricter limits, especially for heavy-duty vehicles (HDVs). These standards reduce nitrogen oxides (NOX) limits by 50% to 62%, depending on the test cycle. Additionally, they replace the total hydrocarbon (THC) limits with distinct, more stringent limits for non-methane organic gases (NMOG) and methane (CH4). Coordinated timing compresses procurement into narrow windows that strain suppliers but unlock economies of scale for after-treatment and battery technologies. California's Advanced Clean Trucks regulation, covering 25% of the US market, mandates 50% zero-emission sales by 2030. Operators that adopt early benefit from incentive pools and residual-value premiums, whereas late movers face supply shortages and higher compliance costs. Manufacturers with existing electric portfolios enjoy a first-mover edge and can amortize development expenses across both regions.
Infrastructure Stimulus in Emerging Economies
Government-backed road and energy programs continue to lift medium and heavy commercial vehicles market demand in India, Indonesia, Malaysia, and key Latin American countries. India's FAME framework targets 70% electric commercial vehicle penetration by 2030, supporting 49% annual growth in electric truck sales and encouraging suppliers to localize battery modules and drivetrains. Similar multi-year road-building and electrification measures in Indonesia and Malaysia foster a regional scale. At the same time, the Inter-American Development Bank estimates that coordinated incentives could raise Latin America's share of global electric truck sales from 0.45% to 4% by 2030. These initiatives extend purchasing visibility beyond the normal seven-year replacement horizon, enabling component makers to secure capacity and de-risk capital investment. The combination of stimulus funds and local content rules underpins a steady pipeline of orders for chassis, cabs, and charging infrastructure suppliers.
High Upfront Cost of Zero-Emission Trucks
Battery packs account for 40% of unit cost, leaving electric heavy trucks priced 20-30% above diesel equivalents. Total cost parity is projected within four years as lithium-iron-phosphate chemistries scale, yet many small carriers lack financing headroom. Truck-as-a-service contracts and battery leasing can cut acquisition costs by up to 42% while helping manufacturers generate recurring revenue. Large fleet operators are already adopting these models, but credit-constrained buyers in emerging economies still face high hurdle rates that slow take-up.
Other drivers and restraints analyzed in the detailed report include:
- E-Commerce Logistics Expansion
- Telematics-Enabled Usage-Based Insurance Lowers TCO
- Supply-Chain Bottlenecks for Batteries
For complete list of drivers and restraints, kindly check the Table Of Contents.
Segment Analysis
The above-16-ton models contributed around 60.26% of 2024 medium and heavy commercial vehicles market share, securing the largest slice of the medium and heavy commercial vehicles market. Demand is anchored by long-haul freight networks that prioritize payload capacity over convenience when charging. In contrast, the 3.5-7.5 ton class of medium and heavy commercial vehicles is expanding at 7.81% CAGR, outpacing all other bands as urban delivery platforms proliferate. This segment benefits from lower battery requirements as packs of 100-200 kWh suffice for daily routes, reducing capital outlays and charging complexity. Meanwhile, medium-duty units in the 7.5-16-ton range see stable replacement linked to construction and municipal procurement cycles.
Battery size scales steeply with vehicle mass, with heavy haulers needing 500 kWh or more to meet duty-cycle expectations. That requirement inflates curb weight and infrastructure costs, slowing electrification relative to lighter classes. Regulators differentiate limits by gross vehicle weight, compelling manufacturers to balance after-treatment and zero-emission designs across engineering roadmaps. Despite the cost gap, several mining companies are piloting 150-ton electric dumpers that yield life-cycle savings once charging networks are in place.
Internal combustion engines retained 91.72% revenue in 2024 of medium and heavy commercial vehicles market share, cementing their lead in the medium and heavy commercial vehicles market. Yet battery-electric trucks are on a steep 9.83% CAGR trajectory to 2030, helped by subsidies, lower operating costs, and rapid urban-fleet adoption. Alternative fuels such as compressed natural gas and liquefied natural gas continue to serve regional niches where electric range or grid access remains problematic. Plug-in hybrids act as transitional solutions for operators who must combine range flexibility with zero-emission urban entry.
China accounted for over 80% of global electric heavy-truck sales in 2024, illustrating the influence of coordinated incentives and local supply chains. Fuel-cell electric prototypes are under test for long-haul corridors where battery mass hurts payload, with early pilots in Germany, South Korea, and the US. The propulsion mix will therefore remain heterogeneous through 2030, driven by total cost of ownership calculations, energy-price trajectories, and infrastructure rollouts.
The Medium and Heavy Commercial Vehicle Market Report is Segmented by Tonnage (3. 5 To 7. 5 T, 7. 5 To 16 T, and Above 16 T), Propulsion Type (IC Engine, Plug-In Hybrid Electric, Battery Electric, and More), Vehicle Type (Rigid Truck and More), End-User Industry (Logistics and Transportation, Construction and Mining, and More), and Geography. The Market Forecasts are Provided in Terms of Value (USD) and Volume (Units).
Geography Analysis
Asia-Pacific's 45.52% 2024 revenue share stems from China's production depth and India's expanding policy push. The region is expected to extend its lead by 2030 because original-equipment manufacturers co-locate battery plants, software centers, and component testing near their largest buyers. China alone supported over 90,000 electric heavy-truck registrations in 2024, with BYD and SAIC exporting kits to Hungary and Indonesia to diversify tariff exposure. India backs 14 state incentive programs, allowing Uttar Pradesh and Maharashtra to create city-level low-emission zones that favor 3.5-ton battery trucks.
North America and Europe represent mature yet lucrative markets where coordinated rules ensure technological harmonization. The EU aims for a 45% CO2 cut in heavy trucks by 2030, and Euro VII will take effect in 2029. California's Advanced Clean Trucks rule influences national purchase plans because 11 other states have adopted its roadmap, covering one quarter of the US Class 6-8 demand. Canada targets 35% zero-emission truck sales by 2030 and funds charging corridors on the Trans-Canada Highway. On the corporate side, Volvo and Daimler established a joint venture to create a common operating system, while PACCAR integrates in-house battery packs to shield itself from volatility.
Africa is gaining investment momentum despite modest starting volumes and is rapidly growing with a robust CAGR of 9.10%. Morocco and Egypt order electric buses that share components with medium-duty trucks, creating a nucleus for regional supply. Ethiopia has already exceeded its 2030 bus electrification target, illustrating the potential of aggregated procurement models. South Africa's EV White Paper sets a dual platform roadmap that combines fuel efficiency upgrades for existing diesels with incentives for fast-charge depots around mining belts. These initiatives point to latent demand that could translate into double-digit shipment growth once grid reliability improves.
- Daimler Truck AG
- Volvo Group
- Traton SE (MAN, Scania, Navistar)
- PACCAR Inc.
- Tata Motors Ltd.
- Hyundai Motor Co.
- CNHTC (Sinotruk)
- Dongfeng Motor Corp.
- FAW Group
- Renault Trucks
- Isuzu Motors Ltd.
- Hino Motors
- Ashok Leyland
- Iveco Group
- Kamaz PJSC
- Shacman (Shaanxi Auto)
- UD Trucks
- BYD Auto
- Nikola Corp.
Additional Benefits:
- The market estimate (ME) sheet in Excel format
- 3 months of analyst support
TABLE OF CONTENTS
1 Introduction
- 1.1 Study Assumptions & Market Definition
- 1.2 Scope of the Study
2 Research Methodology
3 Executive Summary
4 Market Landscape
- 4.1 Market Overview
- 4.2 Market Drivers
- 4.2.1 Fleet renewal driven by Euro-VII & EPA 2027 emission rules
- 4.2.2 Infrastructure stimulus in emerging economies
- 4.2.3 E-commerce logistics expansion
- 4.2.4 Mining sector's push for battery-electric haul trucks
- 4.2.5 Telematics-enabled usage-based insurance lowers TCO
- 4.2.6 Secondary-use Battery Leasing Models
- 4.3 Market Restraints
- 4.3.1 High upfront cost of zero-emission trucks
- 4.3.2 Supply-chain bottlenecks for power-electronics & batteries
- 4.3.3 Depot-level grid-capacity limitations
- 4.3.4 Skilled-Technician Shortage for HV-EV Drivetrains
- 4.4 Value / Supply-Chain Analysis
- 4.5 Regulatory Landscape
- 4.6 Technological Outlook
- 4.7 Porter's Five Forces Analysis
- 4.7.1 Threat of New Entrants
- 4.7.2 Bargaining Power of Buyers
- 4.7.3 Bargaining Power of Suppliers
- 4.7.4 Threat of Substitutes
- 4.7.5 Intensity of Competitive Rivalry
5 Market Size & Growth Forecasts (Value (USD) and Volume (Units))
- 5.1 By Tonnage
- 5.1.1 3.5 to 7.5 t
- 5.1.2 7.5 to 16 t
- 5.1.3 Above 16 t
- 5.2 By Propulsion Type
- 5.2.1 Internal-Combustion Engine (Diesel & Gasoline)
- 5.2.2 Battery Electric
- 5.2.3 Plug-in Hybrid Electric
- 5.2.4 Fuel-cell Electric
- 5.2.5 Alternative Fuels (CNG, LNG, Bio-fuel, LPG)
- 5.3 By Vehicle Type
- 5.3.1 Rigid Truck
- 5.3.2 Tractor-Trailer
- 5.3.3 Tipper / Dump Truck
- 5.3.4 Specialized & Vocational Trucks
- 5.4 By End-user Industry
- 5.4.1 Logistics & Transportation
- 5.4.2 Construction & Mining
- 5.4.3 Agriculture & Forestry
- 5.4.4 Utilities & Municipal Services
- 5.5 By Geography
- 5.5.1 North America
- 5.5.1.1 United States
- 5.5.1.2 Canada
- 5.5.1.3 Rest of North America
- 5.5.2 South America
- 5.5.2.1 Brazil
- 5.5.2.2 Argentina
- 5.5.2.3 Rest of South America
- 5.5.3 Europe
- 5.5.3.1 Germany
- 5.5.3.2 United Kingdom
- 5.5.3.3 France
- 5.5.3.4 Spain
- 5.5.3.5 Italy
- 5.5.3.6 Russia
- 5.5.3.7 Rest of Europe
- 5.5.4 Asia-Pacific
- 5.5.4.1 China
- 5.5.4.2 India
- 5.5.4.3 Japan
- 5.5.4.4 South Korea
- 5.5.4.5 Australia
- 5.5.4.6 Rest of Asia-Pacific
- 5.5.5 Middle East and Africa
- 5.5.5.1 United Arab Emirates
- 5.5.5.2 Saudi Arabia
- 5.5.5.3 Turkey
- 5.5.5.4 South Africa
- 5.5.5.5 Egypt
- 5.5.5.6 Rest of Middle East and Africa
- 5.5.1 North America
6 Competitive Landscape
- 6.1 Market Concentration
- 6.2 Strategic Moves
- 6.3 Market Share Analysis
- 6.4 Company Profiles (Includes Global Level Overview, Market Level Overview, Core Segments, Financials as Available, Strategic Information, Market Rank/Share for Key Companies, Products and Services, SWOT Analysis, and Recent Developments)
- 6.4.1 Daimler Truck AG
- 6.4.2 Volvo Group
- 6.4.3 Traton SE (MAN, Scania, Navistar)
- 6.4.4 PACCAR Inc.
- 6.4.5 Tata Motors Ltd.
- 6.4.6 Hyundai Motor Co.
- 6.4.7 CNHTC (Sinotruk)
- 6.4.8 Dongfeng Motor Corp.
- 6.4.9 FAW Group
- 6.4.10 Renault Trucks
- 6.4.11 Isuzu Motors Ltd.
- 6.4.12 Hino Motors
- 6.4.13 Ashok Leyland
- 6.4.14 Iveco Group
- 6.4.15 Kamaz PJSC
- 6.4.16 Shacman (Shaanxi Auto)
- 6.4.17 UD Trucks
- 6.4.18 BYD Auto
- 6.4.19 Nikola Corp.
7 Market Opportunities & Future Outlook
- 7.1 White-space & Unmet-need Assessment
 2026年全球中重型商用車市場報告
 重型商用車市場規模、佔有率、成長和全球產業分析:按類型、應用和地區分類的洞察,以及 2026-2034 年的預測。中型商用車市場規模、佔有率、成長和全球行業分析:按類型、應用和地區的洞察,2026-2034年的預測
 8級卡車市場:按卡車類型、推進系統、變速箱、引擎功率和最終用途分類-2026-2032年全球預測全球7級卡車市場規模、佔有率、趨勢和成長分析報告(2026-2034年)全球8級卡車市場規模、佔有率、趨勢和成長分析報告(2026-2034年)
 中重型商用車排氣系統市場-全球產業規模、佔有率、趨勢、機會及預測(依燃料類型、後處理類型、零件類型、地區及競爭格局分類,2021-2031年)中重型商用車泵市場-全球產業規模、佔有率、趨勢、機會和預測:按泵類型、技術類型、銷售管道、地區和競爭格局分類,2021-2031年輕型商用車泵市場 - 全球產業規模、佔有率、趨勢、機會及預測(按泵浦類型、技術類型、銷售管道、地區和競爭格局分類,2021-2031年)
 8級卡車市場成長機會、成長要素、產業趨勢分析及2026年至2035年預測