


 |
市場調查報告書
商品編碼
1836456
美國汽車租賃:市場佔有率分析、行業趨勢、統計數據和成長預測(2025-2030 年)US Car Rental - Market Share Analysis, Industry Trends & Statistics, Growth Forecasts (2025 - 2030) |
||||||
※ 本網頁內容可能與最新版本有所差異。詳細情況請與我們聯繫。
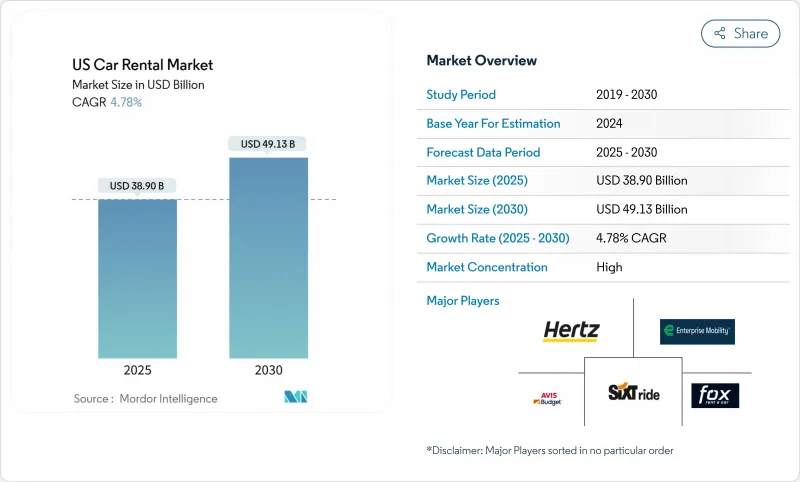
預計到 2025 年美國汽車租賃市場價值將達到 389 億美元,到 2030 年將達到 491.3 億美元,複合年成長率為 4.78%。
這一成長軌跡凸顯了該行業的韌性,因為國內自駕遊文化的回歸、混合辦公模式和麵對面會議的興起,恢復了穩定的租賃需求。成長的動力來自72.23%的線上預訂管道滲透率、南部地區的高出行量以及加速推進的汽車電氣化計劃,這些計劃吸引了休閒和商務旅客。同時,持續的車輛供應限制和不斷上升的資本成本正在限制短期擴張,促使營運商最佳化車隊組合併實施數據主導的定價。來自P2P市場和叫車服務的日益激烈的競爭,正促使現有企業投資於非接觸式體驗、預測分析和多元化的服務模式。
美國汽車租賃市場趨勢與洞察
國內休閒休閒需求快速成長
日益成長的出行需求和精打細算的出行者使得汽車成為休閒出行的首選,從而提升了休閒細分市場的佔有率。為此,營運商正在增加SUV和跨界車的庫存,這些車型的日租金更高,更能滿足家庭出行的需求。南部和西部地區仍然是熱門目的地,國家公園和風景優美的沿海路線推動穩定的需求。這些大型車輛的燃油效率不斷提高,加上誘人的忠誠度計畫福利,使得租賃車輛對於休閒出行而言比購車更具吸引力。
線上和行動預訂管道快速成長
如今,數位化便利性已成為每一次預訂的基礎,也印證了App體驗的永久轉型。早期採用者正在實施非接觸式取車、人工智慧聊天機器人和一鍵支付流程,以推動回頭客業務和高附加服務附加率。赫茲租車公司已在美國所有門市推出Apple Pay,顯示精簡的支付方式能夠縮短櫃檯時間並提升顧客滿意度。行動優先的介面還能根據本地事件進行動態定價,進而增強收益管理。從使用者旅程中收集的數據會輸入預測模型,以近乎即時地重新分配車輛,從而提高運轉率並降低資本強度。
新車供應持續受限,資本支出高企
由於信貸緊縮增加了借貸成本並擠壓了營運商的現金流,到 2024 年,車隊採購的融資利率大幅上升。晶片短缺和有利於零售買家的 OEM 配額限制了車隊交付,迫使租賃公司延長持有期或以高價爭奪二手二手車。不斷上升的購買成本擠壓了淨利率並使定價策略複雜化,尤其是在客戶仍然對價格敏感的情況下。經濟型車型的稀缺性(OEM 優先考慮利潤率更高的車型)正推動租賃客戶轉向更大的車輛,從而提高了每日費率並降低了折舊免稅額。車隊經理現在將更多資源投入轉售中,因為他們意識到轉售時機決定了動盪的批發市場的盈利。
報告中分析的其他促進因素和限制因素
- 原始設備製造商推動租賃車隊電氣化
- 混合工作公司對靈活車隊租賃的需求
- 低價中國電動車進口帶來的殘值風險
細分分析
休閒汽車租賃將佔 2024 年銷售額的 58.32%,成為美國汽車租賃市場最大的收入來源,預計到 2030 年的複合年成長率為 5.32%。公路旅行文化、國家公園旅遊以及混合工作政策下的彈性休假時間將增加租賃時長並提高平均每日房價 (ADR) 的表現。
隨著專業將商務旅行延長用於個人休閒,延長合約期限並提高盈利,休閒旅行正蓬勃發展。對於現有飯店企業而言,將免費升等忠誠度福利打包出售,可以鼓勵顧客留在品牌生態系統內,同時提高平季的運轉率。由此帶來的利用率提升,即使在購置成本增加的情況下,也能支持其實現投資回報目標。
經濟型車型仍佔據車隊總數的主導地位,佔59.87%。然而,SUV和跨界車類別的複合年成長率達到12.48%,由於消費者更重視空間和感知安全性,收益結構。業者利用大型車輛日均房價上漲的優勢,抵銷車隊採購帶來的通膨成本。
原廠生產轉向高階車型限制了經濟型汽車的供應,迫使租賃公司在客戶預算和車輛供應之間尋找平衡。如今,遠端資訊處理技術指導著微型車隊的配置,將SUV車型部署在家庭出行需求高峰期。這項策略最大限度地提高了車輛利用率,減少了車輛重新部署里程,即使在法定保費上漲的情況下,也有助於降低營運成本。
其他福利:
- Excel 格式的市場預測 (ME) 表
- 3個月的分析師支持
目錄
第1章 引言
- 研究假設和市場定義
- 調查範圍
第2章調查方法
第3章執行摘要
第4章 市場狀況
- 市場概況
- 市場促進因素
- 國內自駕遊/休閒需求快速成長
- 線上和行動預訂管道快速成長
- 原始設備製造商電動化租賃車輛
- 混合動力公司對靈活車隊租賃的需求
- P2P供應擴張和價格發現
- 透過遠端資訊處理最佳化營運成本
- 市場限制
- 新車供應持續受限,資本支出高企
- 低價中國電動車進口帶來的殘值風險
- 機場特許經營和地方稅收成本上升
- 透過叫車服務和固定費率 MaaS 實現模式替代
- 價值/供應鏈分析
- 技術展望
- 監管狀況
- 五力分析
- 新進入者的威脅
- 買家/消費者的議價能力
- 供應商的議價能力
- 替代品的威脅
- 競爭對手之間的競爭強度
第5章市場規模與成長預測:價值(美元)
- 按用途
- 休閒旅遊
- 商業和企業
- 按車輛類型
- 經濟型和廉價型汽車
- 豪華和高級汽車
- SUV與跨界車
- 透過預訂管道
- 線上(網頁和應用程式)
- 離線(櫃檯和電話)
- 按租賃期限
- 短期(30天以內)
- 長期/定期(30天或以上)
- 透過促銷
- 內燃機汽車
- 油電混合車
- 純電動車
- 按服務模式
- 傳統企業車隊
- P2P平台
- 按地區
- 東北
- 中西部
- 南部
- 西
第6章 競爭態勢
- 市場集中度
- 策略舉措和夥伴關係
- 市佔率分析
- 公司簡介
- Enterprise Holdings Inc.
- Hertz Global Holdings Inc.
- Avis Budget Group Inc.
- Sixt SE
- Fox Rent A Car
- Ace Rent A Car
- Advantage Rent A Car
- U-Save Car & Truck Rental
- Turo Inc.
- Getaround Inc.
- Kyte
- HyreCar Inc.
第7章 市場機會與未來展望
The US Car Rental market is valued at USD 38.90 billion in 2025 and is projected to reach USD 49.13 billion by 2030, expanding at a 4.78% CAGR.
The trajectory underscores the sector's resilience as domestic road-trip culture, hybrid-work patterns, and a swing back toward in-person meetings restore steady rental demand. Growth is reinforced by the 72.23% penetration of online booking channels, the South region's outsized traveler volumes, and accelerated fleet electrification programs that draw leisure and corporate customers. At the same time, persistent vehicle supply constraints and rising capital costs temper near-term expansion, prompting operators to optimize fleet mix and pursue data-driven pricing. Heightened competition from peer-to-peer marketplaces and ride-hailing services is nudging incumbents to invest in contactless experiences, predictive analytics, and diversified service models.
US Car Rental Market Trends and Insights
Surge in Domestic Road-Trip Leisure Demand
Pent-up wanderlust and cost-sensitive travelers have made cars the preferred mode for leisure trips, lifting the leisure segment. In response, operators are broadening their inventories to include more SUVs and crossovers, which command higher daily rental rates and cater better to family travel needs. The South and West remain hotspots, with national parks and scenic coastal routes driving consistent demand. Enhanced fuel efficiency in these larger vehicles, coupled with enticing loyalty program benefits, is making rentals more appealing than ownership for leisure trips.
Rapid Growth of Online & Mobile Booking Channels
Digital convenience now underpins all reservations, confirming a lasting pivot toward app-based experiences. Fast-acting firms introduced contactless pick-up, AI chatbots, and one-tap payment flows, driving repeat usage and higher ancillary-service attachment rates. Hertz's rollout of Apple Pay across US locations shows how streamlined payment options reduce counter time and boost customer satisfaction. Mobile-first interfaces also enable dynamic pricing that reacts to localized events, bolstering yield management. The data captured from user journeys feeds predictive models that reposition fleet units in near real time, lifting utilization ratios and moderating capital intensity.
Persistent New-Vehicle Supply Constraints & High CAPEX
Financing rates for fleet purchases surged during 2024 as monetary tightening raised borrowing costs, squeezing cash flows for operators. Chip shortages and OEM allocations that favor retail buyers have limited fleet deliveries, forcing rental firms to extend holding periods or compete for late-model used cars at premium prices. Elevated acquisition costs compress margins and complicate pricing strategies, especially when customers remain price sensitive. The scarcity of economy trims-OEMs have prioritized higher-margin variants-nudges renters toward bigger vehicles, driving higher daily rates and reducing depreciation. Fleet managers now dedicate more resources to remarketing execution, acknowledging that resale timing can determine profitability in a volatile wholesale market.
Other drivers and restraints analyzed in the detailed report include:
- OEM-Backed Electrification of Rental Fleets
- Flexible Fleet-Leasing Demand from Hybrid-Work Corporations
- Residual-Value Risk from Low-Priced Chinese EV Imports
For complete list of drivers and restraints, kindly check the Table Of Contents.
Segment Analysis
Leisure rentals captured 58.32% of 2024 revenue, generating the largest US car rental market income slice and posting a 5.32% CAGR outlook through 2030. Road trip culture, national park tourism, and flexible vacation timing under hybrid work policies lengthen rental durations and boost average daily rate (ADR) performance.
Leisure travel is adding momentum as professionals extend work trips for personal recreation, lengthening contracts and enhancing profitability. For incumbents, packaging loyalty benefits such as free class upgrades encourages customers to stay within the brand ecosystem while reinforcing occupancy during shoulder periods. The resulting utilization gains support capital-return targets even as acquisition outlays rise.
Economy models still dominate fleet counts with a 59.87% share. Yet the SUV and crossover category, noted for 12.48% CAGR, is redefining revenue mix as customers prioritize space and perceived safety. Operators capitalize on higher ADRs for larger vehicles, offsetting inflationary costs in fleet procurement.
OEM production shifts toward premium trims constrain economy-car supply, forcing rental companies to balance customer budgets against availability. Telematics now guides micro-fleet allocation, positioning SUVs where family vacation demand peaks. The strategy maximizes utilization and lowers repositioning miles, contributing to reduced operating expenses even as statutory insurance premiums climb.
The US Car Rental Market Report is Segmented by Application (Leisure and Tourism and Business and Corporate), Vehicle Type (Economy and Budget Cars, and More), Booking Channel (Online and Offline), Rental Duration (Short-Term, and More), Propulsion (ICE Vehicles, and More), Service Model (Traditional Corporate Fleets and Peer-To-Peer Platforms), and Geography. The Market Forecasts are Provided in Terms of Value (USD).
List of Companies Covered in this Report:
- Enterprise Holdings Inc.
- Hertz Global Holdings Inc.
- Avis Budget Group Inc.
- Sixt SE
- Fox Rent A Car
- Ace Rent A Car
- Advantage Rent A Car
- U-Save Car & Truck Rental
- Turo Inc.
- Getaround Inc.
- Kyte
- HyreCar Inc.
Additional Benefits:
- The market estimate (ME) sheet in Excel format
- 3 months of analyst support
TABLE OF CONTENTS
1 Introduction
- 1.1 Study Assumptions & Market Definition
- 1.2 Scope of the Study
2 Research Methodology
3 Executive Summary
4 Market Landscape
- 4.1 Market Overview
- 4.2 Market Drivers
- 4.2.1 Surge in domestic road-trip/leisure demand
- 4.2.2 Rapid growth of online & mobile booking channels
- 4.2.3 OEM-backed electrification of rental fleets
- 4.2.4 Flexible fleet-leasing demand from hybrid-work corporates
- 4.2.5 Peer-to-peer supply expansion & price discovery
- 4.2.6 Telematics-driven OPEX optimisation
- 4.3 Market Restraints
- 4.3.1 Persistent new-vehicle supply constraints & high CAPEX
- 4.3.2 Residual-value risk from low-priced Chinese EV imports
- 4.3.3 Escalating airport concession & local taxation costs
- 4.3.4 Modal substitution by ride-hailing & subscription MaaS
- 4.4 Value / Supply-Chain Analysis
- 4.5 Technological Outlook
- 4.6 Regulatory Landscape
- 4.7 Porter's Five Forces
- 4.7.1 Threat of New Entrants
- 4.7.2 Bargaining Power of Buyers/Consumers
- 4.7.3 Bargaining Power of Suppliers
- 4.7.4 Threat of Substitute Products
- 4.7.5 Intensity of Competitive Rivalry
5 Market Size & Growth Forecasts (Value (USD))
- 5.1 By Application
- 5.1.1 Leisure and Tourism
- 5.1.2 Business and Corporate
- 5.2 By Vehicle Type
- 5.2.1 Economy and Budget Cars
- 5.2.2 Luxury and Premium Cars
- 5.2.3 SUVs and Crossovers
- 5.3 By Booking Channel
- 5.3.1 Online (Web & App)
- 5.3.2 Offline (Counter & Phone)
- 5.4 By Rental Duration
- 5.4.1 Short-Term (less than 30 days)
- 5.4.2 Long-Term and Subscription (more than 30 days)
- 5.5 By Propulsion
- 5.5.1 ICE Vehicles
- 5.5.2 Hybrid-Electric Vehicles
- 5.5.3 Battery-Electric Vehicles
- 5.6 By Service Model
- 5.6.1 Traditional Corporate Fleets
- 5.6.2 Peer-to-Peer Platforms
- 5.7 By Geography
- 5.7.1 Northeast
- 5.7.2 Midwest
- 5.7.3 South
- 5.7.4 West
6 Competitive Landscape
- 6.1 Market Concentration
- 6.2 Strategic Moves & Partnerships
- 6.3 Market Share Analysis
- 6.4 Company Profiles (Includes Global Level Overview, Market Level Overview, Core Segments, Financials as Available, Strategic Information, Market Rank/Share for Key Companies, Products and Services, SWOT Analysis, and Recent Developments)
- 6.4.1 Enterprise Holdings Inc.
- 6.4.2 Hertz Global Holdings Inc.
- 6.4.3 Avis Budget Group Inc.
- 6.4.4 Sixt SE
- 6.4.5 Fox Rent A Car
- 6.4.6 Ace Rent A Car
- 6.4.7 Advantage Rent A Car
- 6.4.8 U-Save Car & Truck Rental
- 6.4.9 Turo Inc.
- 6.4.10 Getaround Inc.
- 6.4.11 Kyte
- 6.4.12 HyreCar Inc.
7 Market Opportunities & Future Outlook
 汽車租賃市場依租賃期限、燃料類型、服務特色、使用者類型、車輛類型和預訂方式分類-2025-2032 年全球預測汽車租賃市場按車型、客戶類型、租賃期限、動力類型、分銷管道和車輛等級分類 - 全球預測,2025-2032
 2025年全球租車保險市場報告2025年全球汽車租賃市場報告2025年全球汽車租賃市場報告
 全球汽車麥克風市場研究報告 - 產業分析、規模、佔有率、成長、趨勢及預測(2025 年至 2033 年)
 汽車租賃市場機會、成長動力、產業趨勢分析及2025-2034年預測全球汽車麥克風市場
 企業汽車租賃市場:依租賃類型、車輛類型和地區分類
 中國汽車租賃:市場佔有率分析、行業趨勢、統計數據和成長預測(2025-2030 年)