


 |
市場調查報告書
商品編碼
1693767
印度生物肥料:市場佔有率分析、行業趨勢和統計數據、成長預測(2025-2030 年)India Biofertilizer - Market Share Analysis, Industry Trends & Statistics, Growth Forecasts (2025 - 2030) |
||||||
※ 本網頁內容可能與最新版本有所差異。詳細情況請與我們聯繫。
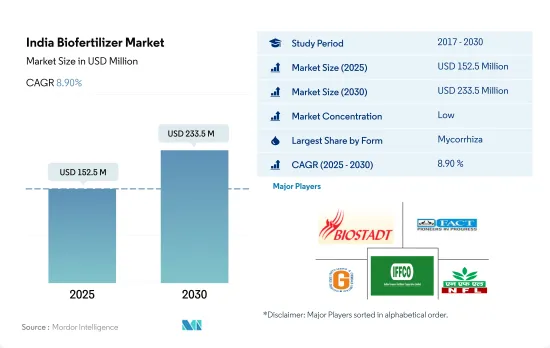
印度生物肥料市場規模預計在 2025 年為 1.525 億美元,預計到 2030 年將達到 2.335 億美元,預測期內(2025-2030 年)的複合年成長率為 8.90%。
- 生物肥料是含有促進植物生長的活微生物的有機物質。 2017 年至 2021 年期間,印度生物肥料市值成長了約 11.0%,這可以歸因於多種原因,例如農民意識的提高、印度註冊有機農場總數的增加以及對有機或永續種植產品的需求轉變。截至 2021 年,印度在有機農業用地面積方面排名世界第五,在生產者總數方面排名第一。
- 基於菌根真菌的生物肥料將佔據市場主導地位,2022 年的市場規模將達到 5,750 萬美元。這主要是因為菌根真菌保留了增強從土壤中吸收磷、其他營養物質和水的能力,支持植物的生長並提高產量。它還可以幫助植物抵抗不利的土壤條件。然而,與其他生物肥料相比,基於根瘤菌和固氮螺菌的生物肥料的市場規模預計將以更快的速度成長。
- 生物肥料消費以連續作物為主,約佔2022年市場價值的88.5%。連續作物的主導地位主要歸因於該國的種植面積較大,約佔同年有機作物總面積的59.8%。
- 國內和國際市場對有機產品的需求都很高。過度使用化學肥料是印度面臨的主要挑戰之一。印度政府正在透過各種計劃和方案推動永續有機農業,為生物肥料提供獎勵,預計這將在 2023 年至 2029 年期間推動市場發展。
印度生物肥料市場趨勢
有機種植者的增加推動了有機種植面積的增加,主要用於連續作物。
- 印度是世界上經過認證的有機生產者總數最多的國家,2019年擁有130萬名有機生產者。儘管有機生產者數量眾多,但該國有機種植面積僅佔全國農業總面積的2.0%左右。 2021年,該國有機種植面積為711,094.0公頃,比2017年增加約3.4%。該國的有機農業集中在幾個邦。全國排名前 10 名的有機作物州約佔有機作物總面積的 80.0%。中央邦、拉賈斯坦邦和馬哈拉斯特拉邦等幾個邦在擴大有機農業覆蓋率方面處於領先地位。光是中央邦一地,2019 年有機種植面積就佔印度全國的 27.0%。
- 該國以連續作物有機種植為主,2021 年有機作物連續種植面積約佔全國有機作物種植總面積的 59.7%。糧食生產以稻米、小麥、小米和玉米為主。大多數穀類作物在雨季(六月至九月)種植。這段時期種植的作物主要依賴雨水或需要大量的水,例如水稻、玉米、棉花和大豆。
- 有機經濟作物的總種植面積將從 2017 年的 27 萬公頃增加到 2021 年的 28 萬公頃。該國主要生產的經濟作物為棉花、甘蔗、茶葉和香辛料。目前,該國有機園藝作物的生長有限。由於對有機產品的需求不斷成長以及印度政府的有機農業計劃,預計2023-2029年期間有機作物面積將會增加。
透過電子商務管道不斷成長的需求和供應將推動人均有機食品支出的成長
- 印度人均有機產品支出為0.23美元,與亞太地區人均有機產品支出平均值相比相對較低。然而,近年來,消費者需求正在轉向有機產品,因為越來越多的消費者認為有機產品具有更強的免疫力、更好的品質並且更容易透過電子商務管道獲得。印度是有機食品和飲料的一個有前景的市場。預計到 2024 年,印度有機食品和飲料產業規模將達到 1.38 億美元,2019 年至 2024 年期間的複合年成長率為 13%。
- 2022 年該國消費的有機食品和飲料總合為 1.08 億美元。該國有機產品消費額從 2016 年的 4,500 萬美元成長至 2021 年的 9,600 萬美元。有機食品銷售趨勢呈上升趨勢,主要原因是消費者意識不斷增強,高所得消費者鼓勵消費有機食品和飲料。需求最大的類別包括有機雞蛋、乳製品、水果和蔬菜等必需食品。
- 有機飲料消費佔據市場主導地位,佔 2022 年有機食品和有機飲料總合市場價值的約 85.2%。有機飲料部分包括經核准認證機構認證的有機包裝食品和飲料產品。 2020 年至 2022 年,有機飲料消費量的複合年成長率為 14%。有機產品的價格溢價限制了低收入消費者的購買能力,是有機食品消費的主要限制因素。然而,積極的促銷和有機產品的優勢將在預測期內推動有機食品市場的發展。
印度生物肥料產業概況
印度生物肥料市場細分,前五大公司佔6.19%。市場的主要企業有 Biostadt India Limited、Fertilizers、Chemicals Travancore Limited、Gujarat State Fertilizers & Chemicals Ltd、Indian Farmers Fertiliser Cooperative Limited、National Fertilizers Limited 等。
其他福利
- Excel 格式的市場預測 (ME) 表
- 3個月的分析師支持
目錄
第1章執行摘要和主要發現
第2章 報告要約
第3章 引言
- 研究假設和市場定義
- 研究範圍
- 調查方法
第4章 產業主要趨勢
- 有機種植區
- 有機產品人均支出
- 法律規範
- 印度
- 價值鍊和通路分析
第5章市場區隔
- 形式
- 固氮螺菌
- 固氮菌
- 菌根真菌
- 解磷細菌
- 根瘤菌
- 其他生物肥料
- 作物類型
- 經濟作物
- 園藝作物
- 田間作物
第6章競爭格局
- 重大策略舉措
- 市場佔有率分析
- 商業狀況
- 公司簡介
- Biostadt India Limited
- Fertilizers and Chemicals Travancore Limited
- GrowTech Agri Science Private Limited
- Gujarat State Fertilizers & Chemicals Ltd
- Indian Farmers Fertiliser Cooperative Limited
- IPL Biologicals Limited
- Madras Fertilizers Limited
- National Fertilizers Limited
- Samriddhi Crops India Pvt. Ltd
- T.Stanes and Company Limited
第7章:CEO面臨的關鍵策略問題
第 8 章 附錄
- 世界概況
- 概述
- 五力分析框架
- 全球價值鏈分析
- 市場動態(DRO)
- 資訊來源及延伸閱讀
- 圖片列表
- 關鍵見解
- 數據包
- 詞彙表
The India Biofertilizer Market size is estimated at 152.5 million USD in 2025, and is expected to reach 233.5 million USD by 2030, growing at a CAGR of 8.90% during the forecast period (2025-2030).
- Biofertilizers are organic substances with living microorganisms that promote plant growth. The Indian biofertilizer market value increased by about 11.0% between 2017 to 2021, which can be attributed to various reasons like the increasing awareness among farmers, the increasing overall registered organic farms in India, and a shift in demand for organically or sustainably grown commodities. India ranks fifth in terms of world organic agriculture land and first in terms of the total number of producers as of 2021.
- Mycorrhizal-based biofertilizers dominated the market, which was valued at USD 57.5 million in 2022. This is mainly due to the mycorrhizal association holding the ability to boost phosphorus, other nutrients, and water absorption from the soil, supporting plant growth and development and increasing yield. It also helps the plant fight against adverse soil conditions. However, Rhizobium and Azospirillum-based biofertilizer market values are anticipated to grow at faster rates compared to other biofertilizers.
- The consumption of biofertilizers is dominant in row crops, and it accounted for about 88.5% of the market value in 2022. The dominance of row crops is mainly due to their large cultivation area in the country, which accounted for about 59.8% of the total organic crop area in the same year.
- There is a huge demand for organic products both in domestic and international markets. The overuse of chemical fertilizers is one of the major challenges in the country. The Indian government is promoting sustainable or organic cultivation practices through various schemes or programs by providing incentives for biofertilizers, which would drive the market between 2023 and 2029.
India Biofertilizer Market Trends
Growing number of organic producers helping the increase in area under organic cultivation, primarily in row crops
- India is the largest country, in terms of the total number of certified organic producers in the world, with 1.3 million organic producers in 2019. Despite having a large number of organic producers, organic cultivation areas in the country account for around 2.0% of the total agriculture area in the country. In 2021, the organic area in the country was recorded as 711,094.0 hectares, which increased by about 3.4% compared to 2017. Organic farming in the country is concentrated in only a few states. The top ten organic farming states in the country account for about 80.0% of the total organic crop area. A few states have taken the lead in improving organic farming coverage, like Madhya Pradesh, Rajasthan, and Maharashtra, which are the top three organic farming states in the country. Madhya Pradesh alone accounted for about 27.0% of India's total organic cultivation area in 2019.
- Organic cultivation of row crops is dominant in the country, which accounted for about 59.7% of the total organic crop area in 2021. Cereal crop production is dominant rice, wheat, millet, and maize are the major cereals produced. Most cereal crops are grown in the kharif season (June - September). The crops grown in this season are mainly rain dependent or require more water, like rice, maize, cotton, and soybean.
- The overall organic cash crop cultivation area increased from 0.27 million hectares in 2017 to 0.28 million hectares in 2021. The major cash crops produced in the country are cotton, sugarcane, tea, and spices. There is a limited growth of organic horticultural crops currently in the country. The increasing demand for organic products and Indian government initiatives to go organic are anticipated to increase organic crop area between 2023 and 2029.
Growing demand and their easy accessibility through e-commerce channels, rising the per capita spending on organic food
- India's per capita spending on organic products is relatively low at USD 0.23 compared to the average per capita spending on organic products in Asia-Pacific. However, in recent years, shifting consumer demand has increased toward organic products as more customers perceive these items offer better immunity, higher quality, and more accessibility through e-commerce channels. India is a promising and developing market for organic foods and beverages. India's domestic organic food and beverage industry is expected to be worth USD 138.0 million by 2024, rising at a compound annual growth rate of 13% between 2019 to 2024.
- In 2022, the total combined organic food and beverages worth USD 108.0 million consumed in the country. The consumption value of organic products in the country increased from USD 45 million in 2016 to USD 96.0 million in 2021. Organic food sales have seen an increasing trend mainly due to increasing consumer awareness, and high-income consumers are propelling organic food and beverage consumption. Categories that gained the most demand included essential foods, such as organic eggs, dairy, and fruits and vegetables.
- Organic beverage consumption dominated the market and accounted for about 85.2% of the total combined organic food and beverages market value in 2022. The organic beverages segment includes organic packaged food and beverages that are certified by the approved certification body. Organic beverage consumption value increased at a CAGR of 14% between 2020 to 2022. The price premium associated with organic products hampers lower-income consumer access and is the major limiting factor for organic food consumption. However, organic products' active promotion and advantages drive the organic food market during the forecast period.
India Biofertilizer Industry Overview
The India Biofertilizer Market is fragmented, with the top five companies occupying 6.19%. The major players in this market are Biostadt India Limited, Fertilizers and Chemicals Travancore Limited, Gujarat State Fertilizers & Chemicals Ltd, Indian Farmers Fertiliser Cooperative Limited and National Fertilizers Limited (sorted alphabetically).
Additional Benefits:
- The market estimate (ME) sheet in Excel format
- 3 months of analyst support
TABLE OF CONTENTS
1 EXECUTIVE SUMMARY & KEY FINDINGS
2 REPORT OFFERS
3 INTRODUCTION
- 3.1 Study Assumptions & Market Definition
- 3.2 Scope of the Study
- 3.3 Research Methodology
4 KEY INDUSTRY TRENDS
- 4.1 Area Under Organic Cultivation
- 4.2 Per Capita Spending On Organic Products
- 4.3 Regulatory Framework
- 4.3.1 India
- 4.4 Value Chain & Distribution Channel Analysis
5 MARKET SEGMENTATION (includes market size in Value in USD and Volume, Forecasts up to 2030 and analysis of growth prospects)
- 5.1 Form
- 5.1.1 Azospirillum
- 5.1.2 Azotobacter
- 5.1.3 Mycorrhiza
- 5.1.4 Phosphate Solubilizing Bacteria
- 5.1.5 Rhizobium
- 5.1.6 Other Biofertilizers
- 5.2 Crop Type
- 5.2.1 Cash Crops
- 5.2.2 Horticultural Crops
- 5.2.3 Row Crops
6 COMPETITIVE LANDSCAPE
- 6.1 Key Strategic Moves
- 6.2 Market Share Analysis
- 6.3 Company Landscape
- 6.4 Company Profiles (includes Global Level Overview, Market Level Overview, Core Business Segments, Financials, Headcount, Key Information, Market Rank, Market Share, Products and Services, and Analysis of Recent Developments).
- 6.4.1 Biostadt India Limited
- 6.4.2 Fertilizers and Chemicals Travancore Limited
- 6.4.3 GrowTech Agri Science Private Limited
- 6.4.4 Gujarat State Fertilizers & Chemicals Ltd
- 6.4.5 Indian Farmers Fertiliser Cooperative Limited
- 6.4.6 IPL Biologicals Limited
- 6.4.7 Madras Fertilizers Limited
- 6.4.8 National Fertilizers Limited
- 6.4.9 Samriddhi Crops India Pvt. Ltd
- 6.4.10 T.Stanes and Company Limited
7 KEY STRATEGIC QUESTIONS FOR AGRICULTURAL BIOLOGICALS CEOS
8 APPENDIX
- 8.1 Global Overview
- 8.1.1 Overview
- 8.1.2 Porter's Five Forces Framework
- 8.1.3 Global Value Chain Analysis
- 8.1.4 Market Dynamics (DROs)
- 8.2 Sources & References
- 8.3 List of Tables & Figures
- 8.4 Primary Insights
- 8.5 Data Pack
- 8.6 Glossary of Terms
 基於固氮菌的生物肥料市場:2026-2032年全球市場預測(按產品類型、作物類型、配方類型、應用方法、分銷管道和最終用戶分類)生物肥料市場:按類型、形態、作物類型、應用方法和分銷管道分類-2026-2032年全球市場預測
 2026年全球生物肥料市場報告
 2034年生物肥料接種劑市場預測-按產品類型、微生物類型、配方類型、應用方法、作物類型、通路和地區分類的全球分析
 生物肥料市場規模、佔有率、趨勢和預測:按類型、作物、微生物、應用方法和地區分類,2026-2034年
 生物有機肥料:市場佔有率分析、產業趨勢與統計、成長預測(2026-2031)
 生物肥料市場規模、佔有率、成長及全球產業分析:按類型和應用分類,區域洞察及2026-2034年預測生物肥料:市場佔有率分析、產業趨勢與統計、成長預測(2026-2031)全球生物肥料市場規模、佔有率、趨勢和成長分析報告(2026-2034年)2026年全球根瘤菌肥料市場報告