


 |
市場調查報告書
商品編碼
1667003
電動貨車市場機會、成長動力、產業趨勢分析及 2025 - 2034 年預測Electric Vans Market Opportunity, Growth Drivers, Industry Trend Analysis, and Forecast 2025 - 2034 |
||||||
2024 年全球電動貨車市場價值為 163 億美元,預計 2025 年至 2034 年期間的複合年成長率為 15.5%。世界各國政府都在推出激勵措施來推動電動車的普及,鼓勵企業轉型為環保車隊。電動貨車為傳統柴油車提供零排放替代品,符合這些監管架構和企業永續發展目標。電池技術的改進也提高了電動貨車的可行性,增加了行駛里程並降低了生產成本。這些進步,加上環保意識和監管支持,正在推動各行各業的需求,特別是在配送和物流領域。
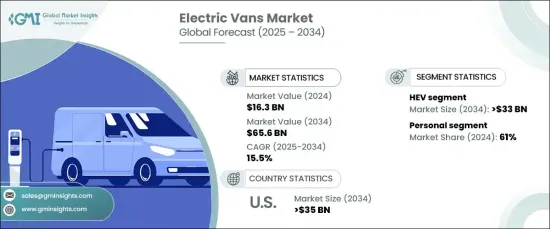
電動貨車市場依車輛類型分為商用車和個人車。個人汽車市場在 2024 年佔據了相當大的佔有率,這主要是由消費者對環保和經濟高效的汽車的偏好所驅動。然而,隨著企業採用電動貨車來降低營運成本並實現永續發展目標,預計商業領域的成長速度將超過電動貨車。擴大充電基礎設施和政府激勵措施等因素進一步促進了電動貨車的商業化應用,使其成為物流和配送車隊的實用解決方案。
| 市場範圍 | |
|---|---|
| 起始年份 | 2024 |
| 預測年份 | 2025-2034 |
| 起始值 | 163億美元 |
| 預測值 | 656億美元 |
| 複合年成長率 | 15.5% |
根據推進方式,市場分為電池電動車 (BEV) 和混合動力電動車 (HEV)。 2024 年,混合動力汽車由於其燃油效率和便利性的平衡而佔據了市場的主導地位,因為它們並不完全依賴電力充電基礎設施。儘管如此,由於電池技術的進步,純電動車 (BEV) 的續航里程增加、充電時間減少,其發展勢頭仍舊強勁。價格承受能力的提高和充電網路的擴大使得純電動車成為個人消費者和企業更有吸引力的選擇。隨著這些改進的不斷進行,預計未來純電動車將實現顯著成長並佔據更多的市場佔有率。
美國是電動貨車市場的主要參與者,佔 2024 年收入的很大佔有率,預計到 2034 年將超過 350 億美元。主要電動汽車製造商的存在和對先進技術的投資進一步推動了創新和生產。此外,該國充電基礎設施的擴建增強了廣泛應用電動車的可行性,滿足了對永續交通解決方案日益成長的需求。美國市場有能力引領更清潔的商業運輸的轉變,這反映了全球向電動車轉變的廣泛趨勢。
目錄
第 1 章:方法論與範圍
- 研究設計
- 研究方法
- 資料收集方法
- 基礎估計和計算
- 基準年計算
- 市場估計的主要趨勢
- 預測模型
- 初步研究與驗證
- 主要來源
- 資料探勘來源
- 市場定義
第 2 章:執行摘要
第 3 章:產業洞察
- 產業生態系統分析
- 供應商概況
- 電動貨車製造商
- 經銷商
- 最終用途
- 利潤率分析
- 定價分析
- 專利格局
- 成本明細
- 專利格局
- 技術與創新格局
- 重要新聞及舉措
- 監管格局
- 衝擊力
- 成長動力
- 提高對環境問題的認知和減少溫室氣體排放的必要性
- 政府推動汽車電氣化的舉措
- 企業和車隊營運商正在製定永續發展目標並引入電動車
- 整合智慧技術,提高效率
- 產業陷阱與挑戰
- 前期成本高
- 充電基礎設施有限
- 成長動力
- 成長潛力分析
- 波特的分析
- PESTEL 分析
第4章:競爭格局
- 介紹
- 公司市佔率分析
- 競爭定位矩陣
- 戰略展望矩陣
第 5 章:市場估計與預測:按推進方式,2021 - 2034 年
- 主要趨勢
- 純電動車
- 油電混合車
- 燃料電池汽車
- 插電式混合動力汽車
第6章:市場估計與預測:按範圍,2021 - 2034 年
- 主要趨勢
- 最多 100 英里
- 100 至 200 英里
- 200 英里以上
第7章:市場估計與預測:依車型,2021 - 2034 年
- 主要趨勢
- 搭乘用車
- 商用車
第 8 章:市場估計與預測:按電池,2021 - 2034 年
- 主要趨勢
- 密封鉛酸
- 鎳氫電池 (NiMH)
- 鋰離子
第 9 章:市場估計與預測:按地區,2021 - 2034 年
- 主要趨勢
- 北美洲
- 美國
- 加拿大
- 歐洲
- 英國
- 德國
- 法國
- 西班牙
- 義大利
- 俄羅斯
- 北歐
- 亞太地區
- 中國
- 印度
- 日本
- 韓國
- 澳新銀行
- 東南亞
- 拉丁美洲
- 巴西
- 墨西哥
- 阿根廷
- 中東及非洲
- 阿拉伯聯合大公國
- 南非
- 沙烏地阿拉伯
第10章:公司簡介
- Ashok Leyland
- Ford Motor
- General Motors
- Hyundai
- Isuzu
- IVECO
- JAC Motors
- Mahindra
- Maxus
- Mercedes-Benz Group
- Nissan Motor
- Renault
- Stellantis
- TOYOTA MOTOR
- Volkswagen
- Arrival
- Canoo
- Bollinger Motors
- Rivian Automotive
- Workhorse Group
The Global Electric Vans Market, valued at USD 16.3 billion in 2024, is projected to expand at a CAGR of 15.5% between 2025 and 2034. This growth stems from increasing global efforts to combat climate change and reduce air pollution, alongside stricter government regulations on emissions. Governments worldwide are introducing incentives to promote electric vehicle adoption, encouraging businesses to transition to eco-friendly fleets. Electric vans, offering zero-emission alternatives to conventional diesel-powered vehicles, align with these regulatory frameworks and corporate sustainability goals. Improvements in battery technology are also enhancing the viability of electric vans by increasing range and decreasing production costs. These advancements, combined with environmental awareness and regulatory support, are driving demand across industries, particularly in the delivery and logistics sectors.
The electric vans market is segmented by vehicle type into commercial and personal categories. The personal segment, which held a significant share in 2024, is driven by consumer preferences for eco-friendly and cost-efficient vehicles. However, the commercial segment is anticipated to outpace it in growth as businesses adopt electric vans to reduce operating costs and meet sustainability targets. Factors such as expanded charging infrastructure and government incentives further bolster the commercial adoption of electric vans, making them a practical solution for logistics and delivery fleets.
| Market Scope | |
|---|---|
| Start Year | 2024 |
| Forecast Year | 2025-2034 |
| Start Value | $16.3 Billion |
| Forecast Value | $65.6 Billion |
| CAGR | 15.5% |
By propulsion, the market is divided into battery electric vehicles (BEVs) and hybrid electric vehicles (HEVs). In 2024, HEVs held a dominant share of the market due to their balance of fuel efficiency and convenience, as they do not solely rely on electric charging infrastructure. Despite this, BEVs are gaining traction due to advancements in battery technology, which improve range and decrease charging times. Increasing affordability and expanding charging networks are making BEVs a more attractive choice for both individual consumers and businesses. As these improvements continue, BEVs are expected to experience significant growth and capture more market share in the future.
The US is a key player in the electric vans market, accounting for a substantial share of revenue in 2024, and is projected to exceed USD 35 billion by 2034. This growth is supported by favorable government policies, tax incentives, and grants aimed at promoting electric vehicle adoption. The presence of major EV manufacturers and investments in advanced technologies further drive innovation and production. Additionally, the expansion of the country's charging infrastructure enhances the feasibility of widespread EV adoption, meeting the rising demand for sustainable transportation solutions. The US market is well-positioned to lead the transition toward cleaner commercial transportation, reflecting the broader global shift toward electric mobility.
Table of Contents
Chapter 1 Methodology & Scope
- 1.1 Research design
- 1.1.1 Research approach
- 1.1.2 Data collection methods
- 1.2 Base estimates and calculations
- 1.2.1 Base year calculation
- 1.2.2 Key trends for market estimates
- 1.3 Forecast model
- 1.4 Primary research & validation
- 1.4.1 Primary sources
- 1.4.2 Data mining sources
- 1.5 Market definitions
Chapter 2 Executive Summary
- 2.1 Industry 3600 synopsis, 2021 - 2034
Chapter 3 Industry Insights
- 3.1 Industry ecosystem analysis
- 3.2 Supplier landscape
- 3.2.1 Electric van manufacturers
- 3.2.2 Distributors
- 3.2.3 End use
- 3.3 Profit margin analysis
- 3.4 Pricing analysis
- 3.5 Patent Landscape
- 3.6 Cost Breakdown
- 3.7 Patent Landscape
- 3.8 Technology & innovation landscape
- 3.9 Key news & initiatives
- 3.10 Regulatory landscape
- 3.11 Impact forces
- 3.11.1 Growth drivers
- 3.11.1.1 Increasing awareness about environmental issues and the need to reduce greenhouse gas emissions
- 3.11.1.2 Government initiatives towards electrification of vehicles
- 3.11.1.3 Businesses and fleet operators are setting sustainability goals and incorporating electric vehicles
- 3.11.1.4 Integration of smart technologies for enhanced efficiency
- 3.11.2 Industry pitfalls & challenges
- 3.11.2.1 High initial upfront costs
- 3.11.2.2 Limited charging infrastructure
- 3.11.1 Growth drivers
- 3.12 Growth potential analysis
- 3.13 Porter’s analysis
- 3.14 PESTEL analysis
Chapter 4 Competitive Landscape, 2024
- 4.1 Introduction
- 4.2 Company market share analysis
- 4.3 Competitive positioning matrix
- 4.4 Strategic outlook matrix
Chapter 5 Market Estimates & Forecast, By Propulsion, 2021 - 2034 ($Bn, Units)
- 5.1 Key trends
- 5.2 BEV
- 5.3 HEV
- 5.3.1 FCEV
- 5.3.2 PHEV
Chapter 6 Market Estimates & Forecast, By Range, 2021 - 2034 ($Bn, Units)
- 6.1 Key trends
- 6.2 Upto 100 miles
- 6.3 100 to 200 miles
- 6.4 Above 200 miles
Chapter 7 Market Estimates & Forecast, By Vehicle, 2021 - 2034 ($Bn, Units)
- 7.1 Key trends
- 7.2 Passenger vehicle
- 7.3 Commercial vehicle
Chapter 8 Market Estimates & Forecast, By Battery, 2021 - 2034 ($Bn, Units)
- 8.1 Key trends
- 8.2 Sealed lead acid
- 8.3 Nickel Metal Hydride (NiMH)
- 8.4 Lithium Ion
Chapter 9 Market Estimates & Forecast, By Region, 2021 - 2034 ($Bn, Units)
- 9.1 Key trends
- 9.2 North America
- 9.2.1 U.S.
- 9.2.2 Canada
- 9.3 Europe
- 9.3.1 UK
- 9.3.2 Germany
- 9.3.3 France
- 9.3.4 Spain
- 9.3.5 Italy
- 9.3.6 Russia
- 9.3.7 Nordics
- 9.4 Asia Pacific
- 9.4.1 China
- 9.4.2 India
- 9.4.3 Japan
- 9.4.4 South Korea
- 9.4.5 ANZ
- 9.4.6 Southeast Asia
- 9.5 Latin America
- 9.5.1 Brazil
- 9.5.2 Mexico
- 9.5.3 Argentina
- 9.6 MEA
- 9.6.1 UAE
- 9.6.2 South Africa
- 9.6.3 Saudi Arabia
Chapter 10 Company Profiles
- 10.1 Ashok Leyland
- 10.2 Ford Motor
- 10.3 General Motors
- 10.4 Hyundai
- 10.5 Isuzu
- 10.6 IVECO
- 10.7 JAC Motors
- 10.8 Mahindra
- 10.9 Maxus
- 10.10 Mercedes-Benz Group
- 10.11 Nissan Motor
- 10.12 Renault
- 10.13 Stellantis
- 10.14 TOYOTA MOTOR
- 10.15 Volkswagen
- 10.16 Arrival
- 10.17 Canoo
- 10.18 Bollinger Motors
- 10.19 Rivian Automotive
- 10.20 Workhorse Group
 電動貨車市場:2026-2032年全球市場預測(按車輛類型、應用、續航里程、電池容量、充電基礎設施和動力系統分類)
 2026年全球電動貨車市場報告
 電動貨車市場規模、佔有率、成長及全球產業分析:按類型、應用和地區分類的洞察,2026-2034年預測
 電動貨車市場-全球產業規模、佔有率、趨勢、機會與預測:動力系統、續航里程、電池容量、區域及競爭格局,2021-2031年
 全球電動貨車市場
 電動貨車市場規模、佔有率、成長分析、按距離、按電池容量、按電池類型、按地區 - 產業預測,2024-2031 年
 電動貨車市場,按推進力、按應用、按里程、按電池、按國家和地區 - 2024-2032 年行業分析、市場規模、市場佔有率和預測
 電動貨車市場規模、佔有率、趨勢分析報告:按推進力、按距離、按電池、按應用、按地區、細分市場預測,2024-2030