


 |
市場調查報告書
商品編碼
1693508
中國特種肥料市場佔有率分析、產業趨勢與統計、成長預測(2025-2030年)China Specialty Fertilizer - Market Share Analysis, Industry Trends & Statistics, Growth Forecasts (2025 - 2030) |
||||||
※ 本網頁內容可能與最新版本有所差異。詳細情況請與我們聯繫。
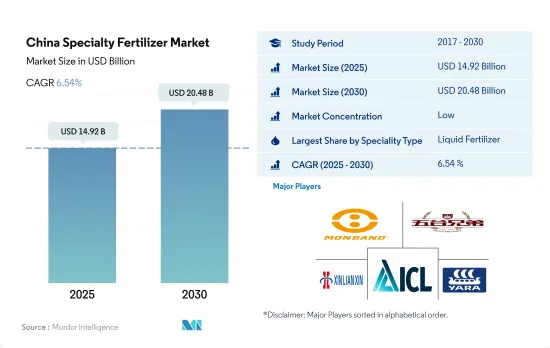
預計 2025 年中國特種肥料市場規模將達到 149.2 億美元,到 2030 年預計將達到 204.8 億美元,預測期內(2025-2030 年)的複合年成長率為 6.54%。
透過有效供應特定營養物質並減少施肥頻率來推動市場發展
- 2022年專用肥市場將佔中國化肥市場規模的約3.8%。專用肥市場佔有率較小,主要原因是農民對其效能認知度較低,且與傳統專用肥相比成本較高。
- 2022年,水溶性肥料佔中國專用肥料市場規模的51.0%。水溶性肥料的主導地位很大程度上得益於灌溉農業的普及和灌溉設備的技術進步。灌溉是該國小型灌溉系統中最普遍的應用方法。預計這將在 2023 年至 2030 年期間推動水溶性肥料市場的發展。
- 2022年液體肥料將佔中國專用肥料市場規模的48.8%。液體肥料易於被植物吸收,與灌溉或噴灑配合使用可以減少人事費用。葉面噴布是液體肥料最常使用的方法。
- 控制釋放肥料將佔據中國專用肥料市場容量的第二大市場佔有率,到2022年將佔0.1%。控制釋放肥料的市場佔有率主要歸功於其能夠提供長達六個月的養分的潛力。營養成分的流失也非常小。然而,在預測期內,農民意識的提高可能會增加控制釋放肥料的市場佔有率。
- 近年來,我國水溶肥產業在現代農業發展的利多政策和大力投入下,憑藉其在減少化肥、水、工、成本、提高產量和品質等方面的優勢,蓬勃發展。
中國特種肥料市場趨勢
種植面積的擴大是由於糧食需求的增加以及該國實現主食自給自足的目標。
- 中國田間作物種植面積將從2018年的1.266億公頃略微增加到2022年的1.278億公頃,佔全國耕地總面積的70.8%。 2022年,玉米將佔最大佔有率,為34.2%,其次是米,為23.6%,小麥為18.3%。預計耕地面積的增加將推動國內化肥需求。
- 中國通常將田間作物生產分為兩個季節:春季和夏季(4月至9月)和冬季。春季作物主要有早玉米、早稻、早小麥、棉花等,冬季作物主要有冬小麥、油菜等。但稻米和玉米是中國農業的重點作物,佔中國糧食產量的三分之一。中國是世界主要稻米生產國之一,預計2022年,稻米種植面積將達3,000萬公頃,稻米產量將達2.1億噸。水稻主產區分佈在黑龍江、湖南、江西、湖北、江蘇、四川、廣西、廣東、湖南等地。受豐收的支撐,中國2022-23年度玉米產量預計將達到2.772億噸,與前一年同期比較增加460萬噸。玉米主產區為東北黑龍江、吉林、內蒙古三省。
- 中國的種植季節以春季為主,但在六月和七月的炎熱月份面臨一些挑戰。米是數百萬人的主食,該地區的高溫和有限的降雨加劇了土壤中的礦物質消耗,因此必須增加施肥量。這些乾旱條件也導致作物產量下降。
全球約28%的氧化亞氮排放排放中國的農業用地。
- 主要營養素可改善植物體內的酵素活性等生化過程,促進植物細胞生長。主要營養素的缺乏會影響植物的健康、發育和作物產量。 2022年田間作物氮、鉀、磷平均施用量為159.9公斤/公頃。田間作物主要養分平均施用量為氮65.23%、磷28.07%、鉀6.68%。
- 氮是第一大主要營養素,因為它是植物新陳代謝所必需的,也是葉綠素和胺基酸的組成部分。平均施氮量為279.65公斤/公頃。其次是鉀肥,施用量為每公頃 105.3 公斤,磷肥,施用量為每公頃 94.9 公斤(2022 年)。人們認為,地表水和地下水受到氮和磷的污染是由於沒有向農民提供有關施肥率的建議不足所造成的。全球農業用地氧化亞氮排放有28%來自中國。
- 2022年,平均養分施用量最高的作物是棉花(255.41公斤/公頃)、小麥(232.25公斤/公頃)、玉米(198.44公斤/公頃)和水稻(157.76公斤/公頃)。中國是世界上最大的棉花生產國、消費國和進口國,預計2022年棉花產量將達640萬噸。全球消費的棉花約有20%產自中國,其中84%產自新疆維吾爾自治區。
- 擴大農業生產對於滿足不斷成長的人口的需求至關重要,因此,預計2023年至2030年間田間作物的主要養分施用量將會增加。
中國特種肥料產業概況
中國專用肥市場細分化,前五大企業市佔率合計為5.01%。該市場的主要企業包括河北蒙邦水溶肥、河北沃澤五豐生物科技、河南心連心化工Group Limited、以色列化工Group Limited、雅苒國際有限公司等。
其他福利
- Excel 格式的市場預測 (ME) 表
- 3個月的分析師支持
目錄
第1章執行摘要和主要發現
第2章 報告要約
第3章 引言
- 研究假設和市場定義
- 研究範圍
- 調查方法
第4章 產業主要趨勢
- 主要作物種植面積
- 田間作物
- 園藝作物
- 平均養分施用量
- 微量營養素
- 田間作物
- 園藝作物
- 主要營養素
- 田間作物
- 園藝作物
- 次要宏量營養素
- 田間作物
- 園藝作物
- 微量營養素
- 灌溉農田
- 法律規範
- 價值鍊和通路分析
第5章市場區隔
- 專業類型
- CRF
- 聚合物塗層
- 聚合硫塗層
- 其他
- 液體肥料
- SRF
- 水溶性
- CRF
- 施肥方式
- 受精
- 葉面噴布
- 土壤
- 作物類型
- 田間作物
- 園藝作物
- 草坪和觀賞植物
第6章競爭格局
- 關鍵策略趨勢
- 市場佔有率分析
- 商業狀況
- 公司簡介
- Grupa Azoty SA(Compo Expert)
- Haifa Group
- Hebei Monband Water Soluble Fertilizer Co. Ltd
- Hebei Sanyuanjiuqi Fertilizer Co., Ltd.
- Hebei Woze Wufeng Biological Technology Co., Ltd
- Henan XinlianXin Chemicals Group Company Limited
- ICL Group Ltd
- Sociedad Quimica y Minera de Chile SA
- Yara International ASA
- Zouping Hongyun BIoTechnology Co., Ltd.
第7章:CEO面臨的關鍵策略問題
第 8 章 附錄
- 世界概況
- 概述
- 五力分析框架
- 全球價值鏈分析
- 市場動態(DRO)
- 資訊來源及延伸閱讀
- 圖片列表
- 關鍵見解
- 數據包
- 詞彙表
The China Specialty Fertilizer Market size is estimated at 14.92 billion USD in 2025, and is expected to reach 20.48 billion USD by 2030, growing at a CAGR of 6.54% during the forecast period (2025-2030).
Efficiency in providing particular nutrients and reducing the number of fertilizations may drive the market
- The specialty fertilizer market accounted for about 3.8% of the market volume of the Chinese fertilizer market in 2022. The minimal market share of the specialty fertilizers market is majorly attributed to the less awareness among farmers regarding efficiency and higher cost compared to conventional specialty fertilizers.
- Water-soluble fertilizers accounted for 51.0% of the Chinese specialty fertilizer market volume in 2022. The dominance of water-soluble fertilizers is majorly due to the growing adoption of irrigation agriculture and technical advancements in irrigation equipment. Fertigation is the most popular application mode used in the country's micro irrigation systems. This will drive the soluble fertilizers market during 2023-2030
- Liquid fertilizers accounted for 48.8% of the Chinese specialty fertilizer market volume in 2022. Liquid fertilizers are more easily absorbed by plants and can be used with irrigation or spraying by reducing labor costs. Foliar is the most popular method used by the liquid fertilizer application.
- Controlled-release fertilizers accounted for the next largest market share in the Chinese specialty fertilizer market volume, accounting for 0.1% in 2022. The market share of controlled-release fertilizers is mainly due to their potential to provide nutrients for up to six months. The loss of nutrients is also very low. However, rising awareness among farmers can increase the market share of controlled-release fertilizers in the forecast period.
- In recent years, the soluble fertilizer industry in China has boomed because of its advantages in reducing fertilizer usage, water, labor, and cost, and increasing yield and quality, accompanied by favorable policies for modern agriculture development and substantial investment.
China Specialty Fertilizer Market Trends
The expansion of the cultivation area is driven by increasing demand for food and the country's goal to achieve self-sufficiency in staple food
- China's cultivation area for field crops expanded marginally from 126.6 million hectares in 2018 to 127.8 million hectares in 2022, representing 70.8% of the nation's total cultivated land. In 2022, corn claimed the largest share at 34.2%, trailed by rice and wheat at 23.6% and 18.3% respectively. This uptick in cultivation area is projected to drive up fertilizer demand in the country.
- China typically divides its field crop production into two seasons: spring/summer (April-September) and winter. Spring crops encompass early corn, early rice, early wheat, and cotton, while winter crops focus on winter wheat and rapeseed. Rice and corn, however, take precedence in China's agricultural landscape, accounting for a third of the nation's grain output. As the world's leading rice producer, China dedicated 30 million hectares to rice farming in 2022, yielding a bountiful 210 million tonnes. Key rice-growing regions span Heilongjiang, Hunan, Jiangxi, Hubei, Jiangsu, Sichuan, Guangxi, Guangdong, and Yunnan. China's corn production for 2022-23 was projected to hit 277.2 million tonnes, a 4.6 million-tonne increase from the previous year, buoyed by a successful harvest. The primary corn belts lie in the northeastern provinces of Heilongjiang, Jilin, and Inner Mongolia.
- While spring dominates China's cropping calendar, it faces some challenges during the hotter months of June and July. Given rice's status as a dietary staple for millions, the region's high temperatures and limited rainfall exacerbate mineral depletion in the soil, necessitating higher fertilizer application. These arid conditions can also curtail crop yields.
About 28% of global nitrous oxide emissions from croplands are from China's agricultural lands
- Primary nutrients improve biochemical processes like enzyme activity in plants and promote plant cell growth. Primary nutrient deficiencies can impact plant health, development, and crop production output. The average application rate of nitrogen, potassium, and phosphorus collectively in field crops was 159.9 kg/hectare in 2022. The average primary nutrient application in field crops included 65.23% nitrogen, 28.07% phosphorous, and 6.68% potassium.
- Nitrogen ranks first in primary nutrients, as it is essential for plant metabolism and is a component of chlorophyll and amino acids. Nitrogen had an average application rate of 279.65 kg/hectare. This was followed by potash at 105.3 kg/hectare and phosphorous at 94.9 kg/hectare in 2022. The contamination of surface and groundwater with nitrogen and phosphorus has been considered a result of inadequate advice given to farmers regarding fertilizer application rates. About 28% of global nitrous oxide emissions from croplands are from China's agricultural lands.
- In 2022, the crops with the highest average nutrient application rates were cotton (255.41 kg/hectare), wheat (232.25 kg/hectare), corn (198.44 kg/hectare), and rice (157.76 kg/hectare). In 2022, cotton production amounted to 6.4 million metric tons, making China the world's largest producer, consumer, and importer of cotton. Around 20% of the cotton consumed worldwide is produced in China, and 84% of that production comes from Xinjiang.
- To meet the demands of a growing population, boosting crop production is essential; as a result, the application of primary nutrients in field crops is expected to grow from 2023 to 2030.
China Specialty Fertilizer Industry Overview
The China Specialty Fertilizer Market is fragmented, with the top five companies occupying 5.01%. The major players in this market are Hebei Monband Water Soluble Fertilizer Co. Ltd, Hebei Woze Wufeng Biological Technology Co., Ltd, Henan XinlianXin Chemicals Group Company Limited, ICL Group Ltd and Yara International ASA (sorted alphabetically).
Additional Benefits:
- The market estimate (ME) sheet in Excel format
- 3 months of analyst support
TABLE OF CONTENTS
1 EXECUTIVE SUMMARY & KEY FINDINGS
2 REPORT OFFERS
3 INTRODUCTION
- 3.1 Study Assumptions & Market Definition
- 3.2 Scope of the Study
- 3.3 Research Methodology
4 KEY INDUSTRY TRENDS
- 4.1 Acreage Of Major Crop Types
- 4.1.1 Field Crops
- 4.1.2 Horticultural Crops
- 4.2 Average Nutrient Application Rates
- 4.2.1 Micronutrients
- 4.2.1.1 Field Crops
- 4.2.1.2 Horticultural Crops
- 4.2.2 Primary Nutrients
- 4.2.2.1 Field Crops
- 4.2.2.2 Horticultural Crops
- 4.2.3 Secondary Macronutrients
- 4.2.3.1 Field Crops
- 4.2.3.2 Horticultural Crops
- 4.2.1 Micronutrients
- 4.3 Agricultural Land Equipped For Irrigation
- 4.4 Regulatory Framework
- 4.5 Value Chain & Distribution Channel Analysis
5 MARKET SEGMENTATION (includes market size in Value in USD and Volume, Forecasts up to 2030 and analysis of growth prospects)
- 5.1 Speciality Type
- 5.1.1 CRF
- 5.1.1.1 Polymer Coated
- 5.1.1.2 Polymer-Sulfur Coated
- 5.1.1.3 Others
- 5.1.2 Liquid Fertilizer
- 5.1.3 SRF
- 5.1.4 Water Soluble
- 5.1.1 CRF
- 5.2 Application Mode
- 5.2.1 Fertigation
- 5.2.2 Foliar
- 5.2.3 Soil
- 5.3 Crop Type
- 5.3.1 Field Crops
- 5.3.2 Horticultural Crops
- 5.3.3 Turf & Ornamental
6 COMPETITIVE LANDSCAPE
- 6.1 Key Strategic Moves
- 6.2 Market Share Analysis
- 6.3 Company Landscape
- 6.4 Company Profiles
- 6.4.1 Grupa Azoty S.A. (Compo Expert)
- 6.4.2 Haifa Group
- 6.4.3 Hebei Monband Water Soluble Fertilizer Co. Ltd
- 6.4.4 Hebei Sanyuanjiuqi Fertilizer Co., Ltd.
- 6.4.5 Hebei Woze Wufeng Biological Technology Co., Ltd
- 6.4.6 Henan XinlianXin Chemicals Group Company Limited
- 6.4.7 ICL Group Ltd
- 6.4.8 Sociedad Quimica y Minera de Chile SA
- 6.4.9 Yara International ASA
- 6.4.10 Zouping Hongyun Biotechnology Co., Ltd.
7 KEY STRATEGIC QUESTIONS FOR FERTILIZER CEOS
8 APPENDIX
- 8.1 Global Overview
- 8.1.1 Overview
- 8.1.2 Porter's Five Forces Framework
- 8.1.3 Global Value Chain Analysis
- 8.1.4 Market Dynamics (DROs)
- 8.2 Sources & References
- 8.3 List of Tables & Figures
- 8.4 Primary Insights
- 8.5 Data Pack
- 8.6 Glossary of Terms
 亞太地區特種肥料:市場佔有率分析、產業趨勢與統計及成長預測(2026-2031)
 特種肥料市場-全球產業規模、佔有率、趨勢、機會和預測:按作物類型、形態、應用方法、技術、地區和競爭格局分類,2021-2031年
 晶體肥料市場:2026-2032年全球市場預測(依養分類型、應用、形態、作物類型、作用機制與銷售管道)特種肥料市場:2026-2032年全球市場預測(依產品形式、作物類型、養分類型、施用方法、通路和最終用途分類)
 特種肥料市場規模、佔有率和趨勢分析報告:按技術、作物、類型、應用、地區和細分市場預測(2026-2033 年)特種肥料:市場佔有率分析、產業趨勢與統計、成長預測(2026-2031)
 全球特種肥料市場規模、佔有率、趨勢和成長分析報告(2026-2034)
 2026年全球特種肥料市場報告
 特種肥料市場規模、佔有率和成長分析(按類型、技術、形態、作物類型、應用方法和地區分類)-2026-2033年產業預測全球特種肥料市場規模(依特種肥料類型、作物類型、施用方法、區域範圍及預測)