


 |
市場調查報告書
商品編碼
1693526
特種肥料:市場佔有率分析、產業趨勢與統計、成長預測(2025-2030)Specialty Fertilizer - Market Share Analysis, Industry Trends & Statistics, Growth Forecasts (2025 - 2030) |
||||||
※ 本網頁內容可能與最新版本有所差異。詳細情況請與我們聯繫。
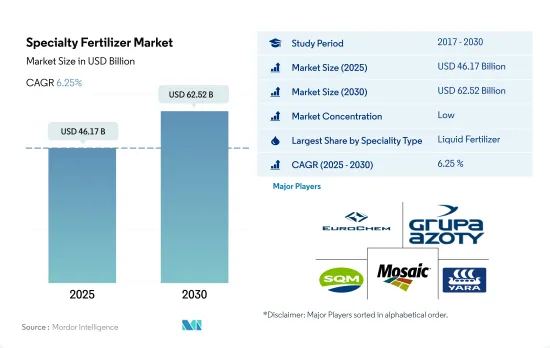
預計特種肥料市場規模到 2025 年將達到 461.7 億美元,到 2030 年將達到 625.2 億美元,預測期內(2025-2030 年)的複合年成長率為 6.25%。
對高效肥料的需求推動了對特殊肥料的需求
- 2022年,全球特種肥料市場約佔全球肥料市場總量的12.0%,價值約517.4億美元。在研究期間,市場以 83.8% 的強勁速度成長。這種快速成長是由於人們對環境問題的日益關注,預計這將推動特種肥料市場在 2023 年至 2030 年期間的發展。
- 水溶性肥料約佔整個市場的44.6%,其中亞太地區和北美佔據主導地位。到2022年,這些地區將佔全球水溶肥料市場的70.3%以上。
- 預計2023年至2030年緩釋肥料的消費量將大幅增加,複合年增率為3.7%。同時,這些肥料的市場價值預計將實現6.1%的複合年成長率。這種變化是由於農民和種植者認知到緩釋肥料在提高作物產量和品質的同時最大限度地減少對環境的影響的好處而發生的。
- 此外,易於施用、分佈均勻和成本效益導致人們明顯轉向使用液體肥料。這些因素將推動液體肥料市場的發展,預計 2023 年至 2030 年期間的複合年成長率為 5.8%。
- 預測期內推動全球特種肥料市場發展的關鍵因素是肥料利用效率的提高、特種肥料採用量的激增以及農田對噴灌和微灌系統的偏好日益成長。
亞太地區是特種肥料最大的市場。
- 2022年,亞太地區佔據特種肥料市場最大佔有率,佔總價值的45.8%。田間作物佔該地區專用肥料消費量的83.5%。緊隨其後的是園藝作物,佔 13.7%,而草皮和觀賞作物落後,佔不到 1%。
- 中國在農地作物領域處於領先地位,佔專用肥料市場佔有率的43.04%。緊隨其後的是印度(17.15%)、日本(16.35%)和印尼(5.67%)。 2022年,澳洲佔據亞太特種肥料市場4.07%的佔有率。
- 北美成為全球第二大特種肥料市場,2022年價值約125.9億美元,佔總價值的24.8%。在北美市場,田間作物佔消費量的86.8%,草坪和觀賞作物佔7.6%,園藝作物6.2%。
- 南美洲約佔全球特種肥料市場的18.48%,2021年價值約30.4億美元。巴西是南美洲市場的主導者,2022年其特殊肥料市場價值將達17.5億美元,消費量將達200萬噸。
- 2020 年,特種肥料市場產量和價值均持續成長,但因新冠疫情導致供應鏈中斷而下降。
- 由於全球過度使用化肥,人們對化肥污染的擔憂日益加劇,這將在未來幾年推動全球特種化肥市場的發展。
全球特種肥料市場趨勢
田間作物是世界各地的主食,未來幾年田間作物的種植面積將會擴大。
- 全球農業部門面臨許多挑戰。根據聯合國預測,到 2050 年,世界人口可能會超過 90 億。人口成長可能會對農業造成過度壓力,而由於勞動力短缺和都市化進程加劇導致農地面積減少,農業產量已經下降。根據聯合國糧食及農業組織預測,2050年,全球70%的人口預計將居住在城市。隨著全球可耕地面積減少,農民需要使用更多的肥料來提高作物產量。
- 亞太地區是世界上最大的農產品生產地區。農業對該地區的經濟至關重要,約佔總勞動力的 20%。該地區以田間作物種植為主,約佔全部區域作物總面積的95%以上。水稻、小麥和玉米是該地區的主要田間作物,約佔2022年總耕地面積的24.3%。
- 北美洲是世界上可耕地面積第二大的地區。北美的農場種植多種作物,以田間作物為主。根據美國農業部的數據,玉米、棉花、稻米、大豆和小麥是該地區的主要田間作物。美國佔市場主導地位,2022 年佔北美作物種植總面積的 46.2%。 2017 年至 2019 年間,該國作物種植面積大幅下降,主因是不利的環境條件導致德克薩斯州和休士頓等地區發生嚴重洪災。
在所有養分中,主要養分(N、P、K)的平均施用量最高,為164.3 kg/ha。
- 玉米、菜籽、棉花、高粱、水稻、小麥和大豆是全球主要的營養密集型作物。這些作物主要養分施用量如下:玉米:230.57 公斤/公頃,油菜籽:255.75 公斤/公頃,菜籽:172.70 公斤/公頃,高粱:158.46 公斤/公頃,水稻:154.49 公斤/公頃,高粱:135.35 公斤/公頃,水稻:154.49 公斤/公頃公頃。大量營養素對作物生長至關重要,因為它們促進植物的重要代謝過程,並有助於細胞、細胞膜和葉綠素等重要植物組織的形成。磷對於種植優質作物尤其重要,而鉀在激活植物生長所必需的酵素方面起著關鍵作用。
- 全球田間作物氮、鉀、磷的平均施用量為164.31公斤/公頃。使用最廣泛的基肥是氮肥,平均施用量為224.6公斤/公頃,其次是鉀肥,平均施用量為150.3公斤/公頃。磷排在第三位,2022 年的平均施用率為 117.9 公斤/公頃。
- 2022年油菜氮肥施用量最高,為347.4kg/ha,玉米/玉米磷肥施用量最高,為156.3kg/ha。菜籽鉀施用量最高,為每公頃 248.6 公斤。全球田間作物種植面積不斷增加,其中南美洲和亞太地區的成長最為顯著。這些地區正成為化肥的潛在市場。歐洲和北美等發展中地區以及營養不良地區擴大使用特種肥料來提高其功效。預計這些趨勢將在 2023 年至 2030 年期間推動主要營養肥料市場的發展。
特種肥料行業概況
專用肥市場分散,前五大企業佔30.38%。該市場的主要企業有:EuroChem Group、Grupa Azoty SA(Compo Expert)、Sociedad Quimica y Minera de Chile SA、The Mosaic Company 和 Yara International ASA(按字母順序排列)
其他福利
- Excel 格式的市場預測 (ME) 表
- 3個月的分析師支持
目錄
第1章執行摘要和主要發現
第2章 報告要約
第3章 引言
- 研究假設和市場定義
- 研究範圍
- 調查方法
第4章 產業主要趨勢
- 主要作物種植面積
- 田間作物
- 園藝作物
- 平均養分施用量
- 微量營養素
- 田間作物
- 園藝作物
- 主要營養素
- 田間作物
- 園藝作物
- 次要宏量營養素
- 田間作物
- 園藝作物
- 微量營養素
- 灌溉農田
- 法律規範
- 價值鍊和通路分析
第5章市場區隔
- 特殊類型
- CRF
- 聚合物塗層
- 聚合硫塗層
- 其他
- 液體肥料
- SRF
- 水溶性
- CRF
- 施肥方式
- 受精
- 葉面噴布
- 土壤
- 作物類型
- 田間作物
- 園藝作物
- 草坪和觀賞植物
- 地區
- 亞太地區
- 澳洲
- 孟加拉
- 中國
- 印度
- 印尼
- 日本
- 巴基斯坦
- 菲律賓
- 泰國
- 越南
- 其他亞太地區
- 歐洲
- 法國
- 德國
- 義大利
- 荷蘭
- 俄羅斯
- 西班牙
- 烏克蘭
- 英國
- 其他歐洲國家
- 中東和非洲
- 奈及利亞
- 沙烏地阿拉伯
- 南非
- 土耳其
- 其他中東和非洲地區
- 北美洲
- 加拿大
- 墨西哥
- 美國
- 北美其他地區
- 南美洲
- 阿根廷
- 巴西
- 南美洲其他地區
- 亞太地區
第6章 競爭格局
- 關鍵策略趨勢
- 市場佔有率分析
- 商業狀況
- 公司簡介
- Coromandel International Ltd.
- EuroChem Group
- Grupa Azoty SA(Compo Expert)
- Haifa Group
- Kingenta Ecological Engineering Group Co., Ltd.
- Koch Industries Inc.
- Nutrien Ltd.
- Sociedad Quimica y Minera de Chile SA
- The Mosaic Company
- Yara International ASA
第7章:CEO面臨的關鍵策略問題
第 8 章 附錄
- 世界概況
- 概述
- 五力分析框架
- 全球價值鏈分析
- 市場動態(DRO)
- 資訊來源及延伸閱讀
- 圖片列表
- 關鍵見解
- 資料包
- 詞彙表
The Specialty Fertilizer Market size is estimated at 46.17 billion USD in 2025, and is expected to reach 62.52 billion USD by 2030, growing at a CAGR of 6.25% during the forecast period (2025-2030).
The demand for high nutrient-efficient fertilizers is driving the demand for specialty fertilizers
- In 2022, the global specialty fertilizers market represented approximately 12.0% of the total global fertilizer market, with a valuation of around USD 51.74 billion. Over the study period, the market witnessed a robust growth of 83.8%. This surge can be attributed to the rising environmental concerns, which are anticipated to propel the specialty fertilizer market during 2023-2030.
- Water-soluble fertilizers, constituting roughly 44.6% of the market value, are predominantly dominated by Asia-Pacific and North America. Together, these regions commanded over 70.3% of the global water-soluble fertilizer market in 2022.
- Between 2023 and 2030, the consumption of slow-release fertilizers is projected to witness a notable uptick, with a CAGR of 3.7%. Simultaneously, the market value for these fertilizers is expected to register a CAGR of 6.1%. This shift is driven by farmers and growers recognizing the benefits of slow-release fertilizers in enhancing crop yields and quality while minimizing environmental impact.
- Moreover, there is a discernible shift toward liquid fertilizers, driven by their ease of application, uniform distribution, and cost-effectiveness. These factors are projected to fuel the liquid fertilizer market, with an estimated CAGR of 5.8% during 2023-2030.
- Key drivers for the global specialty fertilizer market in the forecast period include heightened fertilizer-use efficiency, a surge in specialty fertilizer adoption, and an increasing preference for sprinklers or micro-irrigation systems across agricultural lands.
Asia-Pacific region is the largest market for specialty fertilizers.
- In 2022, Asia-Pacific held the largest share of the specialty fertilizer market, accounting for 45.8% of its total value. Field crops dominated the region's specialty fertilizer consumption, representing 83.5% of the volume. Horticultural crops followed at 13.7%, while turf and ornamental crops lagged behind at under 1%.
- China led the pack in the field crops segment, commanding 43.04% of the specialty fertilizer market's value. India trailed at 17.15%, with Japan at roughly 16.35%, and Indonesia at 5.67%. Australia secured a 4.07% share of the Asia-Pacific specialty fertilizer market in 2022.
- North America emerged as the second-largest specialty fertilizer market globally, capturing 24.8% of its total value, amounting to approximately USD 12.59 billion in 2022. Field crops dominated the North American market, accounting for 86.8% of the consumption, while turf and ornamental crops held a 7.6% share, and horticultural crops claimed 6.2%.
- South America contributed around 18.48% to the global specialty fertilizer market, valued at roughly USD 3.04 billion in 2021. Brazil stood out as the dominant player in the South American market, with its specialty fertilizer market reaching USD 1.75 billion in 2022, and a consumption volume of 2.0 million metric tons.
- The specialty fertilizer market witnessed a consistent growth in volume and value, barring a dip in 2020 due to supply chain disruptions triggered by the COVID-19 pandemic.
- Mounting concerns over fertilizer pollution, stemming from global overuse, are poised to propel the global specialty fertilizer market in the coming years.
Global Specialty Fertilizer Market Trends
Field crops being the staple food across the globe, area under field crops will grow in the coming years.
- The global agricultural sector is facing many challenges. According to the UN, the world population will likely exceed nine billion by 2050. This population growth may overburden the agricultural industry, which is already experiencing an output loss due to a lack of laborers and the shrinkage of agricultural fields caused by rising urbanization. According to the Food and Agriculture Organization, 70% of the global population is expected to live in cities by 2050. Due to the global loss of arable land, farmers now need to utilize more fertilizers to increase crop yields.
- Asia-Pacific is the world's largest producer of agricultural products. Agriculture is critical to the region's economy, as it employs about 20% of the total available workforce. Field crop cultivation dominates the region, accounting for about more than 95% of the total crop area in the region. Rice, wheat, and corn are the major field crops produced in the region, together accounting for about 24.3% of the total crop area in 2022.
- North America is the second-largest arable region of the total agricultural land area in the world. Diverse varieties of crops are grown in North American farms, primarily field crops. As per the USDA, corn, cotton, rice, soybean, and wheat are among the region's dominant field crops. The United States dominated the market by accounting for 46.2% of the total area under crop cultivation in 2022 of the overall North American area under cultivation. Crop acreage in the country fell significantly between 2017 and 2019, primarily due to unfavorable environmental conditions that resulted in heavy floods in areas such as Texas and Houston.
Among all nutrients, primary nutrients (N, P, and K) have the highest average application rate at 164.3 kg/hectares.
- Corn/maize, rapeseed/canola, cotton, sorghum, rice, wheat, and soybean rank among the primary nutrient-intensive crops globally. The application rates for primary nutrients in these crops were as follows: corn/maize - 230.57 kg/ha, rapeseed/canola - 255.75 kg/ha, cotton - 172.70 kg/ha, sorghum - 158.46 kg/ha, rice - 154.49 kg/ha, wheat - 135.35 kg/ha, and soybean - 120.97 kg/ha. Primary nutrient fertilizers are pivotal for crop growth, facilitating vital plant metabolic processes and aiding in the formation of crucial plant tissues like cells, cell membranes, and chlorophyll. Phosphorus is particularly vital for cultivating high-quality crops, while potassium plays a key role in activating enzymes essential for plant growth.
- The global average application rate for nitrogen, potassium, and phosphorus in field crops stands at 164.31 kg/ha. Nitrogen emerges as the most widely used primary nutrient fertilizer, with an average application rate of 224.6 kg/ha, followed by potassic fertilizers at 150.3 kg/ha. Phosphorus ranks third, with an average application rate of 117.9 kg/ha in 2022.
- In 2022, rapeseed recorded the highest nitrogen application rate at 347.4 kg/ha, while corn/maize led in phosphorus application at 156.3 kg/ha. Canola took the lead in potassium application, with a rate of 248.6 kg/ha. The global cultivation area for field crops is on the rise, with South America and Asia-Pacific witnessing notable growth. These regions are emerging as potential markets for fertilizers. Developed regions like Europe and North America, along with areas grappling with nutrient deficiencies, are increasingly turning to specialty fertilizers for their efficacy. These trends are expected to propel the primary nutrient fertilizers market during 2023-2030.
Specialty Fertilizer Industry Overview
The Specialty Fertilizer Market is fragmented, with the top five companies occupying 30.38%. The major players in this market are EuroChem Group, Grupa Azoty S.A. (Compo Expert), Sociedad Quimica y Minera de Chile SA, The Mosaic Company and Yara International ASA (sorted alphabetically).
Additional Benefits:
- The market estimate (ME) sheet in Excel format
- 3 months of analyst support
TABLE OF CONTENTS
1 EXECUTIVE SUMMARY & KEY FINDINGS
2 REPORT OFFERS
3 INTRODUCTION
- 3.1 Study Assumptions & Market Definition
- 3.2 Scope of the Study
- 3.3 Research Methodology
4 KEY INDUSTRY TRENDS
- 4.1 Acreage Of Major Crop Types
- 4.1.1 Field Crops
- 4.1.2 Horticultural Crops
- 4.2 Average Nutrient Application Rates
- 4.2.1 Micronutrients
- 4.2.1.1 Field Crops
- 4.2.1.2 Horticultural Crops
- 4.2.2 Primary Nutrients
- 4.2.2.1 Field Crops
- 4.2.2.2 Horticultural Crops
- 4.2.3 Secondary Macronutrients
- 4.2.3.1 Field Crops
- 4.2.3.2 Horticultural Crops
- 4.2.1 Micronutrients
- 4.3 Agricultural Land Equipped For Irrigation
- 4.4 Regulatory Framework
- 4.5 Value Chain & Distribution Channel Analysis
5 MARKET SEGMENTATION (includes market size in Value in USD and Volume, Forecasts up to 2030 and analysis of growth prospects)
- 5.1 Speciality Type
- 5.1.1 CRF
- 5.1.1.1 Polymer Coated
- 5.1.1.2 Polymer-Sulfur Coated
- 5.1.1.3 Others
- 5.1.2 Liquid Fertilizer
- 5.1.3 SRF
- 5.1.4 Water Soluble
- 5.1.1 CRF
- 5.2 Application Mode
- 5.2.1 Fertigation
- 5.2.2 Foliar
- 5.2.3 Soil
- 5.3 Crop Type
- 5.3.1 Field Crops
- 5.3.2 Horticultural Crops
- 5.3.3 Turf & Ornamental
- 5.4 Region
- 5.4.1 Asia-Pacific
- 5.4.1.1 Australia
- 5.4.1.2 Bangladesh
- 5.4.1.3 China
- 5.4.1.4 India
- 5.4.1.5 Indonesia
- 5.4.1.6 Japan
- 5.4.1.7 Pakistan
- 5.4.1.8 Philippines
- 5.4.1.9 Thailand
- 5.4.1.10 Vietnam
- 5.4.1.11 Rest of Asia-Pacific
- 5.4.2 Europe
- 5.4.2.1 France
- 5.4.2.2 Germany
- 5.4.2.3 Italy
- 5.4.2.4 Netherlands
- 5.4.2.5 Russia
- 5.4.2.6 Spain
- 5.4.2.7 Ukraine
- 5.4.2.8 United Kingdom
- 5.4.2.9 Rest of Europe
- 5.4.3 Middle East & Africa
- 5.4.3.1 Nigeria
- 5.4.3.2 Saudi Arabia
- 5.4.3.3 South Africa
- 5.4.3.4 Turkey
- 5.4.3.5 Rest of Middle East & Africa
- 5.4.4 North America
- 5.4.4.1 Canada
- 5.4.4.2 Mexico
- 5.4.4.3 United States
- 5.4.4.4 Rest of North America
- 5.4.5 South America
- 5.4.5.1 Argentina
- 5.4.5.2 Brazil
- 5.4.5.3 Rest of South America
- 5.4.1 Asia-Pacific
6 COMPETITIVE LANDSCAPE
- 6.1 Key Strategic Moves
- 6.2 Market Share Analysis
- 6.3 Company Landscape
- 6.4 Company Profiles
- 6.4.1 Coromandel International Ltd.
- 6.4.2 EuroChem Group
- 6.4.3 Grupa Azoty S.A. (Compo Expert)
- 6.4.4 Haifa Group
- 6.4.5 Kingenta Ecological Engineering Group Co., Ltd.
- 6.4.6 Koch Industries Inc.
- 6.4.7 Nutrien Ltd.
- 6.4.8 Sociedad Quimica y Minera de Chile SA
- 6.4.9 The Mosaic Company
- 6.4.10 Yara International ASA
7 KEY STRATEGIC QUESTIONS FOR FERTILIZER CEOS
8 APPENDIX
- 8.1 Global Overview
- 8.1.1 Overview
- 8.1.2 Porter's Five Forces Framework
- 8.1.3 Global Value Chain Analysis
- 8.1.4 Market Dynamics (DROs)
- 8.2 Sources & References
- 8.3 List of Tables & Figures
- 8.4 Primary Insights
- 8.5 Data Pack
- 8.6 Glossary of Terms
 按養分類型、應用、形態、作物類型、作用機制和銷售管道的晶體肥料市場—2025-2032年全球預測特種肥料市場(依作物類型、產品形態、營養類型、施用方法、通路和最終用途)-2025-2032 年全球預測
 2025年特種肥料全球市場報告
 特種肥料市場規模、佔有率、趨勢分析報告:按技術、作物類型、應用、地區、細分市場預測,2025-2030 年
 全球特種肥料市場規模(依特種肥料類型、作物類型、施用方法、區域範圍及預測)
 特種肥料市場 - 全球產業規模、佔有率、趨勢、機會和預測,按作物類型、形式、應用方式、技術、地區和競爭細分,2020-2030 年
 中國特種肥料市場佔有率分析、產業趨勢與統計、成長預測(2025-2030年)中東和非洲特種肥料:市場佔有率分析、行業趨勢和統計數據、成長預測(2025-2030 年)北美特種肥料:市場佔有率分析、行業趨勢和成長預測(2025-2030 年)南美洲特種肥料:市場佔有率分析、產業趨勢與統計、成長預測(2025-2030 年)