


 |
市場調查報告書
商品編碼
1689870
歐洲電動自行車市場佔有率分析、產業趨勢與統計、成長預測(2025-2030)Europe E-bike - Market Share Analysis, Industry Trends & Statistics, Growth Forecasts (2025 - 2030) |
||||||
價格
※ 本網頁內容可能與最新版本有所差異。詳細情況請與我們聯繫。
簡介目錄
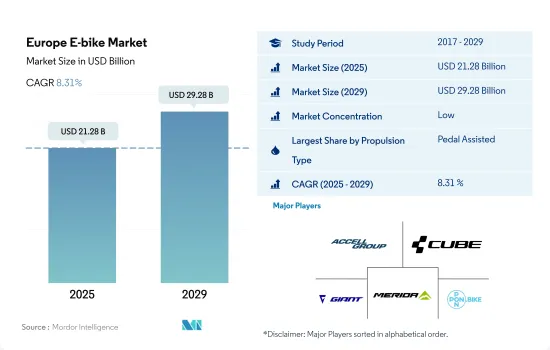
預計 2025 年歐洲電動自行車市場規模為 212.8 億美元,到 2029 年將達到 292.8 億美元,預測期內(2025-2029 年)的複合年成長率為 8.31%。
推進系統細分市場概覽
- 2022 年該地區共售出約 2,600 萬輛電動自行車,而 2021 年總合2,400 萬輛。電動城市/都市自行車、電動健行自行車和電動登山車是最受歡迎的公司,佔全國電動自行車總銷量的近 94%。推動電動自行車市場銷售的關鍵因素包括創新的產品功能、電池和驅動裝置的完全整合、有吸引力的設計以及高品質材料的使用。
- 荷蘭是繼德國之後歐洲第二大電動自行車市場。 2022年全國電動自行車銷量約55萬輛,較上年的約50萬輛略有成長。雖然與去年相比,全國電動自行車銷量增加,但並沒有出現太大的變化。這是因為共享單車和換車等做法影響了新車的銷售量。
- 歐洲國家採用電動自行車的主要原因包括健康益處、環境效益、減少開支、避免交通堵塞以及年輕人對電動自行車作為運動器材的需求不斷成長。預計所有這些因素都將在預測期內推動市場成長。
歐洲各國市場
歐洲電動自行車市場趨勢
德國以其極高的普及率脫穎而出,顯示其市場成熟且消費者支持度大。
- 近年來,歐洲對電動自行車的需求大幅增加。燃油價格上漲、尖峰時段交通堵塞和運動好處是推動英國、義大利、西班牙和德國等歐洲國家電動自行車普及率上升的一些因素。丹麥佔據電動自行車銷量的大部分,2019 年的普及率高於該地區的其他國家,例如盧森堡。電動自行車需求的不斷成長進一步加速了其在整個歐洲的普及率。
- 新冠疫情病例的增加對自行車業務產生了積極影響。由於人們為了保持社交距離而避免使用公共和租賃交通工具,他們改變了通勤方式,並投資購買電動自行車作為一種方便且經濟實惠的選擇。這些因素導致2020年歐洲各地電動自行車的普及率加速上升。
- 商業活動的恢復以及門鎖和貿易活動等限制的放寬促進了電動自行車的普及,並活性化了該地區的進出口活動。預計消費者對電動自行車的興趣日益濃厚,將在預測期內推動該地區電動自行車的普及。
特別是在比利時和荷蘭,5至15公里之間的通勤距離穩定增加,反映了高效率的交通途徑和城市規劃。
- 歐洲有許多自行車友善國家,例如荷蘭、波蘭和英國。這些國家最近對自行車的需求不斷成長。歐洲人擴大使用自行車進行短途通勤(5-15公里)和前往附近地區,包括企業和市場。在歐洲,比利時是通勤距離目的地 5-15 公里以內的人口比例最高的國家。
- 2020 年新冠疫情改變了人們對騎自行車作為安全且隔離的交通途徑的看法。 2021年,每天出遊5至15公里的通勤人數將增加0.3%,因為人們在疫情期間選擇騎自行車作為理想的運動方式,或是在週末在附近悠閒地騎自行車。每天通勤距離 5-15 公里的消費者對配備尖端電池組、續航里程可達 40-45 公里的電動自行車很感興趣。
- 在這個地區,許多人經常騎自行車上班,工作地點位於 5-15 公里半徑範圍內。在英國、德國、荷蘭和挪威等已開發國家,騎自行車上班越來越普遍。主要原因是它更健康、碳排放更低、更省油、節省旅行時間。預計這些因素將在預測期內增加歐洲每天通勤距離在 5 至 15 公里之間的人數。
歐洲電動自行車產業概況
歐洲電動自行車市場較為分散,前五大公司佔18.14%的市場。市場的主要企業有:Accell Group、CUBE Bikes、Giant Manufacturing、Merida Industry 和 Pon Holding BV(按字母順序排列)。
其他福利
- Excel 格式的市場預測 (ME) 表
- 3個月的分析師支持
目錄
第1章執行摘要和主要發現
第2章 報告要約
第3章 引言
- 研究假設和市場定義
- 研究範圍
- 調查方法
第4章 產業主要趨勢
- 自行車銷量
- 人均GDP
- 通貨膨脹率
- 電動自行車普及率
- 每天出遊 5 至 15 公里的人口/通勤者百分比
- 自行車租賃
- 電動自行車電池價格
- 電池化學價格表
- 超本地化配送
- 自行車道
- 徒步人數
- 電池充電容量
- 交通堵塞指數
- 法律規範
- 價值鍊和通路分析
第5章市場區隔
- 推進類型
- 踏板輔助
- 高速電動自行車
- 油門輔助
- 應用程式類型
- 貨運/多用途
- 城市/城區
- 健行
- 電池類型
- 鉛酸電池
- 鋰離子電池
- 其他
- 原產地
- 奧地利
- 比利時
- 捷克共和國
- 法國
- 德國
- 義大利
- 盧森堡
- 荷蘭
- 波蘭
- 西班牙
- 瑞士
- 英國
- 其他歐洲國家
第6章競爭格局
- 關鍵策略趨勢
- 市場佔有率分析
- 商業狀況
- 公司簡介
- Accell Group
- Brompton Bicycle
- CUBE Bikes
- Fritzmeier Systems GmbH & Co. KG(M1 Sporttechnik)
- Giant Manufacturing Co. Ltd.
- Kalkhoff Werke GmbH
- KTM Bike Industries
- Merida Industry Co. Ltd
- Pedego Electric Bikes
- Pon Holding BV
- Riese & Muller
- Royal Dutch Gazelle
- Swiss E-Mobility Group(SEMG)
- Trek Bicycle Corporation
- VanMoof BV
- Volt Electric Bikes
- Yamaha Bicycles
第7章:CEO面臨的關鍵策略問題
第 8 章 附錄
- 世界概況
- 概述
- 五力分析框架
- 全球價值鏈分析
- 市場動態(DRO)
- 資訊來源及延伸閱讀
- 圖片列表
- 關鍵見解
- 資料包
- 詞彙表
簡介目錄
Product Code: 69010
The Europe E-bike Market size is estimated at 21.28 billion USD in 2025, and is expected to reach 29.28 billion USD by 2029, growing at a CAGR of 8.31% during the forecast period (2025-2029).
PROPULSION SEGMENT MARKET OVERVIEW
- A total of around 26 million units of electric bicycles were sold in the region in 2022, compared to around 24 million units of bikes in 2021. E-city/urban, e-trekking, and e-MTB bikes were the most preferred companies, occupying nearly 94% of all the e-bike sales in the country. Some of the major factors driving the sales of the e-bike market are the innovative character of the product, fully integrated batteries and drives, appealing designs, and the use of high-quality materials.
- After Germany, the Netherlands is the second-largest e-bike market in Europe. In 2022, the country witnessed a sale of nearly 0.55 million e-bikes, which was a slight increase compared to the previous year, which recorded nearly 0.5 million unit sales. Though the volume of e-bikes in the country increased as compared to last year, it was not a considerable change. This can be attributed to the fact that new bike sales were affected by practices, such as bike-sharing systems and swap bikes.
- Some of the major reasons considered for adopting e-bikes in European countries are the health benefits, environmental benefits, reduction in expenditure, avoidance of traffic congestion, and rise in demand for e-bikes as sports equipment among youth. . All these factors are expected to help the market growth over the forecast period.
EUROPE COUNTRY LEVEL MARKET OVERVIEW
Europe E-bike Market Trends
Germany stands out with its notably high adoption rates, indicating a mature market and strong consumer acceptance
- Europe has witnessed a significant demand for e-bicycles over the past few years. Rising fuel prices, traffic jams during peak hours, and exercise benefits are some of the factors responsible for the increasing adoption rate of e-bikes in European countries, such as the United Kingdom, Italy, Spain, and Germany. Denmark accounted for the major share of e-bike sales and had a higher adoption rate in 2019 than other countries in the region, such as Luxembourg. The growing demand for e-bikes further accelerated their adoption rate across Europe.
- The growing number of COVID-19 cases affected the bicycle business positively. As people avoided public or rented transportation to maintain social distancing, they changed their commuting methods and invested in e-bikes as a convenient and price-friendly option. Such factors accelerated the adoption rate of e-bikes in 2020 across Europe.
- The resumption of business operations and the relaxation of restrictions, such as lockdowns and trade activities, boosted the adoption of e-bikes and increased the import and export activities in the region. The growing consumer interest in e-bikes is expected to increase their adoption in the region during the forecast period.
Steady growth in 5-15 km commutes, especially in Belgium and the Netherlands, reflects efficient transportation and urban planning
- Europe has many bicycle-friendly countries, including the Netherlands, Poland, and the United Kingdom. The demand for bicycles has grown recently in these countries. People in Europe are gradually shifting toward bicycles for shorter commutes (5-15 km) or trips to neighboring areas, including businesses and markets. Belgium has the highest percentage of daily commuters within 5-15 km in Europe.
- The COVID-19 pandemic in 2020 changed people's perceptions of bicycles as a secure, isolating means of transportation. People chose bicycles as an ideal form of exercise during the pandemic or engaged in weekend leisurely rides to neighboring areas, thus increasing the number of commuters with a daily travel distance of 5-15 km by 0.3% in 2021. Consumers commuting a daily distance of 5-15 km per day were drawn to e-bikes with their cutting-edge battery packs that offer an increased range of up to 40-45 km.
- Many people in the region regularly commute by bicycle to their places of employment within 5-15 km. Bicycle commuting is increasingly common in developed countries like the United Kingdom, Germany, Netherlands, and Norway, largely because it is healthy, carbon-free, fuel-efficient, and saves time in traffic. During the forecast period, these factors are anticipated to accelerate the number of commuters traveling a daily distance of 5-15 km across Europe.
Europe E-bike Industry Overview
The Europe E-bike Market is fragmented, with the top five companies occupying 18.14%. The major players in this market are Accell Group, CUBE Bikes, Giant Manufacturing Co. Ltd., Merida Industry Co. Ltd and Pon Holding B.V. (sorted alphabetically).
Additional Benefits:
- The market estimate (ME) sheet in Excel format
- 3 months of analyst support
TABLE OF CONTENTS
1 EXECUTIVE SUMMARY & KEY FINDINGS
2 REPORT OFFERS
3 INTRODUCTION
- 3.1 Study Assumptions & Market Definition
- 3.2 Scope of the Study
- 3.3 Research Methodology
4 KEY INDUSTRY TRENDS
- 4.1 Bicycle Sales
- 4.2 GDP Per Capita
- 4.3 Inflation Rate
- 4.4 Adoption Rate Of E-bikes
- 4.5 Percent Population/commuters With 5-15 Km Daily Travel Distance
- 4.6 Bicycle Rental
- 4.7 E-bike Battery Price
- 4.8 Price Chart Of Different Battery Chemistry
- 4.9 Hyper-local Delivery
- 4.10 Dedicated Bicycle Lanes
- 4.11 Number Of Trekkers
- 4.12 Battery Charging Capacity
- 4.13 Traffic Congestion Index
- 4.14 Regulatory Framework
- 4.15 Value Chain & Distribution Channel Analysis
5 MARKET SEGMENTATION (includes market size in Value in USD and Volume, Forecasts up to 2029 and analysis of growth prospects)
- 5.1 Propulsion Type
- 5.1.1 Pedal Assisted
- 5.1.2 Speed Pedelec
- 5.1.3 Throttle Assisted
- 5.2 Application Type
- 5.2.1 Cargo/Utility
- 5.2.2 City/Urban
- 5.2.3 Trekking
- 5.3 Battery Type
- 5.3.1 Lead Acid Battery
- 5.3.2 Lithium-ion Battery
- 5.3.3 Others
- 5.4 Country
- 5.4.1 Austria
- 5.4.2 Belgium
- 5.4.3 Czech Republic
- 5.4.4 France
- 5.4.5 Germany
- 5.4.6 Italy
- 5.4.7 Luxembourg
- 5.4.8 Netherlands
- 5.4.9 Poland
- 5.4.10 Spain
- 5.4.11 Switzerland
- 5.4.12 UK
- 5.4.13 Rest-of-Europe
6 COMPETITIVE LANDSCAPE
- 6.1 Key Strategic Moves
- 6.2 Market Share Analysis
- 6.3 Company Landscape
- 6.4 Company Profiles
- 6.4.1 Accell Group
- 6.4.2 Brompton Bicycle
- 6.4.3 CUBE Bikes
- 6.4.4 Fritzmeier Systems GmbH & Co. KG (M1 Sporttechnik)
- 6.4.5 Giant Manufacturing Co. Ltd.
- 6.4.6 Kalkhoff Werke GmbH
- 6.4.7 KTM Bike Industries
- 6.4.8 Merida Industry Co. Ltd
- 6.4.9 Pedego Electric Bikes
- 6.4.10 Pon Holding B.V.
- 6.4.11 Riese & Muller
- 6.4.12 Royal Dutch Gazelle
- 6.4.13 Swiss E-Mobility Group (SEMG)
- 6.4.14 Trek Bicycle Corporation
- 6.4.15 VanMoof BV
- 6.4.16 Volt Electric Bikes
- 6.4.17 Yamaha Bicycles
7 KEY STRATEGIC QUESTIONS FOR E BIKES CEOS
8 APPENDIX
- 8.1 Global Overview
- 8.1.1 Overview
- 8.1.2 Porter's Five Forces Framework
- 8.1.3 Global Value Chain Analysis
- 8.1.4 Market Dynamics (DROs)
- 8.2 Sources & References
- 8.3 List of Tables & Figures
- 8.4 Primary Insights
- 8.5 Data Pack
- 8.6 Glossary of Terms
02-2729-4219
+886-2-2729-4219
 全球電動自行車市場:依類別、馬達類型、電池類型、應用類型、地區、機會及預測,2018-2032
 山地電動自行車市場-全球產業規模、佔有率、趨勢、機會和預測,按電池、類型、應用、地區和競爭細分,2020-2030 年
 全球電動自行車訂閱平台市場
 電動自行車市場規模、佔有率及成長分析(按類別、速度、電池類型、馬達類型、模式、組件、應用、所有權類型、電池容量、馬達重量、馬達功率及地區)-2025-2032 年產業預測
 2032 年 Speed Pedelec 電動自行車市場預測:按電池類型、組件、額定速度、馬達類型、騎乘者類型、應用和地區進行全球分析
 日本電動自行車市場報告,按推進類型(踏板輔助、高速電動自行車、油門輔助)、應用類型(貨運/多用途、城市/都市、健行)、電池類型(鉛酸電池、鋰離子電池等)和地區分類,2025 年至 2033 年
 2025年全球電動自行車市場報告
 全球電動自行車訂閱平台市場:產業分析、規模、佔有率、成長、趨勢與預測(2025-2032年)
 Speed Pedelec 電動自行車:市場佔有率分析、產業趨勢與統計、成長預測(2025-2029 年)中國電動自行車市場:市場佔有率分析、產業趨勢與統計、成長預測(2025-2030)
▼