


 |
市場調查報告書
商品編碼
1687729
非洲生物肥料市場佔有率分析、產業趨勢與統計、成長預測(2025-2030)Africa Biofertilizer - Market Share Analysis, Industry Trends & Statistics, Growth Forecasts (2025 - 2030) |
||||||
※ 本網頁內容可能與最新版本有所差異。詳細情況請與我們聯繫。
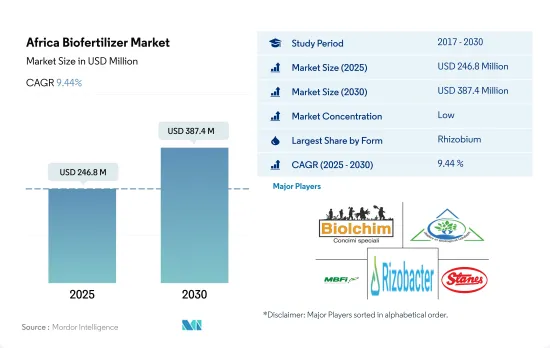
預計 2025 年非洲生物肥料市場規模為 2.468 億美元,到 2030 年將達到 3.874 億美元,預測期內(2025-2030 年)的複合年成長率為 9.44%。
- 生物肥料是活的微生物,透過調動或增加土壤中養分的可用性來改善植物的營養狀況。菌根真菌、固氮螺菌、固氮菌、根瘤菌和解磷細菌是農業中最常用作生物肥料的微生物。
- 在這些生物肥料中,根瘤菌在非洲應用最為廣泛,2022 年佔 45.6% 的市場佔有率,價值 8,750 萬美元。根瘤菌是最突出的固氮細菌,生活在豆科植物的根瘤中並與植物形成共生關係。
- 固氮螺菌佔據第二大市場佔有率,2022 年價值 4,380 萬美元。基於固氮螺菌的生物肥料可取代植物所需 25-30% 的氮,從而促進植物生長。
- 耕地作物將主導生物肥料市場,佔消費佔有率的 76.5%,到 2022 年約為 1.468 億美元,其次是園藝作物,為 3,050 萬美元。重茬作物生物肥料的市場規模不斷擴大。 2017年至2021年間,成長了約17.8%。預計到預測期結束時將成長約 69.6%,達到 2.7 億美元。
- 施用生物肥料可以減少化學氮肥的使用,降低整體種植成本。國內外市場對有機產品的需求不斷成長,推動了該地區對生物肥料的需求。
- 隨著埃及、奈及利亞和南非等許多非洲國家對有機食品的需求不斷成長,非洲已成為生物肥料的重要市場。在過去一段時間(2017-2022年),該地區的有機種植面積略有增加,從2017年的110萬公頃增加到2022年的130萬公頃。同期,非洲生物肥料市場成長了6.9%。該地區主要生產玉米、小麥和玉米等穀物。
- 根瘤菌是非洲國家最常使用的生物肥料,2022 年佔 45.6% 的市場佔有率,價值 8,760 萬美元。根瘤菌是最著名的固氮細菌,存在於豆科植物的根瘤中,與植物有共生關係。
- 在其他非洲國家中,以面積計算,突尼斯是 2021 年該地區最大的有機生產國。在突尼斯種植的 250產品類型中,約有 60 種用於出口,其中大部分是橄欖油,但也有椰棗、芳香草本和藥草,以及一些蔬菜和水果。突尼斯雖然國土面積不大,但其有機農業認證面積排名世界第30位,非洲第一。
- 有機農業面積領先的國家為埃及和南非,分別為4.51萬公頃和1.26萬公頃,合計佔5.0%。然而,非洲其他地區的有機農業面積為 120 萬公頃,佔非洲有機農業總面積的 95.0%。
- 由於消費者對有機產品的興趣日益濃厚,預測期內對生物肥料的需求預計會增加。農民開始意識到依賴化學投入農業的弊端,並正在增加有機種植面積,這也可能推動市場發展。
非洲生物肥料市場趨勢
該地區的有機農業部門擁有 834,000 名有機生產者,其中突尼斯擁有更多的有機土地。
- 非洲的有機農業有兩種形式:認證和非認證。在非洲,只有 0.2% 的農地獲得有機認證。然而,大多數有機農民並未獲得認證。許多獲得認證的農民都希望出口,其中大部分產品銷往非洲最大的農業市場—歐盟。另一方面,未經認證的有機農民則希望在自己的國家銷售產品。 2022年,非洲有機農地面積超過120萬公頃,佔全球有機農地面積的9.0%。
- 非洲地區主要的有機作物包括堅果、橄欖、咖啡、可可、油籽和棉花。經濟作物佔有機農地的大部分,2022 年為 817,400 公頃,佔 63.2%。連作作物佔有機農地面積的比例則位居第二,約25.6%,同年涵蓋範圍積為33.12萬公頃。 2022 年園藝作物佔有機種植面積的 11.2%,達到 144,900 公頃。
- 2020年,非洲將有近834,000家有機生產者。有機生產者數量最多的國家是衣索比亞(約 22 萬人)、坦尚尼亞(約 149,000 人)和烏干達(超過 139,000 人)。
- 從面積來看,突尼斯的有機種植面積最大(2020年超過29萬公頃)。島國聖多美和普林西比是該地區有機農業用地比例最高的國家,達 20.7%。
埃及、南非和奈及利亞的人均有機產品支出最高。
- 非洲的人均收入一直在增加,導致人們在營養食品上的支出增加。有機食品和飲料擴大出現在該地區的貨架上。
- 在非洲,有機產品的消費量大幅增加,尤其是在埃及、南非和奈及利亞。 2021年,埃及人均有機產品消費量為55.5美元,其次是南非7.1美元。在非洲,烏干達是最早採用有機農業的國家之一,並已成功發展成為有機產品的重要生產國和出口國。
- 非洲地區普遍消費的有機產品是新鮮蔬菜和水果。人們做出了巨大努力,將有機農業納入政策、國家推廣體系、行銷、價值鏈發展和消費者關注的主流。
- 由於人均飲料消費量(尤其是果汁)的增加、健康意識的增強以及消費者轉向無化學成分的有機食品和飲料,預計 2023 年至 2029 年間對有機食品的需求將會成長。
- 目前,有機食品在食品產業中所佔比例較小,但它在非洲消費者中越來越受歡迎。然而,較低的收入水平、缺乏有機標準和其他當地市場認證基礎設施可能會抑制該地區有機食品市場的成長。
非洲生物肥料產業概況
非洲生物肥料市場細分,前五大公司佔2.49%。該市場的主要企業有 Biolchim SPA、IPL Biologicals Limited、Microbial Biological Fertilizers International、Rizobacter、T. Stanes and Company Limited 等。
其他福利
- Excel 格式的市場預測 (ME) 表
- 3個月的分析師支持
目錄
第1章執行摘要和主要發現
第2章 報告要約
第3章 引言
- 研究假設和市場定義
- 研究範圍
- 調查方法
第4章 產業主要趨勢
- 有機種植區
- 有機產品人均支出
- 法律規範
- 埃及
- 伊朗
- 奈及利亞
- 南非
- 價值鍊和通路分析
第5章市場區隔
- 形式
- 固氮螺菌
- 固氮菌
- 菌根真菌
- 解磷細菌
- 根瘤菌
- 其他生物肥料
- 作物類型
- 經濟作物
- 園藝作物
- 田間作物
- 原產地
- 埃及
- 奈及利亞
- 南非
- 其他非洲國家
第6章 競爭格局
- 關鍵策略趨勢
- 市場佔有率分析
- 商業狀況
- 公司簡介.
- Atlantica Agricola
- Biolchim SPA
- IPL Biologicals Limited
- Mapleton Agri BIoTec Pt. Ltd
- Microbial Biological Fertilizers International
- Rizobacter
- T. Stanes and Company Limited
- Valent Biosciences LLC
- Vegalab SA
第7章:CEO面臨的關鍵策略問題
第 8 章 附錄
- 世界概況
- 概述
- 五力分析框架
- 全球價值鏈分析
- 市場動態(DRO)
- 資訊來源及延伸閱讀
- 圖片列表
- 關鍵見解
- 資料包
- 詞彙表
The Africa Biofertilizer Market size is estimated at 246.8 million USD in 2025, and is expected to reach 387.4 million USD by 2030, growing at a CAGR of 9.44% during the forecast period (2025-2030).
- Biofertilizers are living microorganisms that improve plant nutrition by mobilizing or increasing nutrient availability in soils. Mycorrhiza, Azospirillum, Azotobacter, Rhizobium, and phosphate-solubilizing bacteria are the most frequent microorganisms used as biofertilizers in agriculture.
- Among these biofertilizers, Rhizobium is most widely used in Africa, accounting for 45.6% of the market in 2022 and valued at USD 87.5 million. Rhizobium is the most prominent nitrogen-fixing bacteria that live in the root nodules of leguminous plants and has a symbiotic relationship with plants.
- Azospirillum accounted for the second-largest market share, valued at USD 43.8 million in 2022. Azospirillum-based biofertilizers promote plant vegetative growth by substituting 25-30% of plant nitrogen requirements.
- Row crops dominated the biofertilizer market, valued at about USD 146.8 million and accounting for 76.5% of the consumption share in 2022, followed by horticultural crops, valued at USD 30.5 million. The market value of biofertilizers in row crops is constantly expanding. It increased by about 17.8% between 2017 and 2021. It is anticipated to increase by about 69.6% by the end of the forecast period, reaching USD 270.0 million.
- The application of biofertilizers can reduce the use of chemical nitrogen fertilizers and the overall cost of cultivation. The demand for organic products in domestic and international markets is increasing, thus driving the demand for biofertilizers in the region.
- As the demand for organically cultivated food grows in many African countries such as Egypt, Nigeria, and South Africa, Africa is a significant market for biofertilizers. During the historical period (2017-2022), the region's organically cultivated area expanded slightly, from 1.1 million hectares in 2017 to 1.3 million hectares in 2022. During the same period, the African biofertilizer market grew by 6.9%. Major cereal crops are produced in the region, like maize, wheat, and corn.
- Rhizobium is the most often used biofertilizer in African countries, accounting for 45.6% of the market in 2022 and worth USD 87.6 million. Rhizobium is the most prominent nitrogen-fixing bacterium that resides in the root nodules of leguminous plants and has a symbiotic connection with plants.
- In the Rest of Africa, in terms of area, Tunisia was the region's largest organic producer in 2021. Around 60 of the 250 organic product categories cultivated in Tunisia are exported, mostly olive oil, but also dates, aromatic and medicinal herbs, and certain vegetables and fruits. Tunisia ranks 30th in the world and first in Africa in terms of organic farming area certification, despite its small size.
- The major countries with organic agricultural acreage include Egypt and South Africa accounting for 5.0% together, with 45.1 thousand hectares and 12.6 thousand hectares, respectively. However, the Rest of Africa accounted for 95.0% of total organic agricultural acreage in Africa, with 1.2 million hectares.
- The demand for biofertilizers is expected to rise during the forecast period owing to rising consumer interest in organic products. Farmers are becoming more aware of the disadvantages of relying on chemical inputs in agriculture and increasing organic acreage, which may also drive the market.
Africa Biofertilizer Market Trends
8,34,000 organic producers are in the region's organic sector with Tunisia is having more organic land
- Organic farming takes two forms in Africa: certified and uncertified. Only 0.2% of organic agricultural land may be certified in Africa. However, most organic farmers are not certified. Many certified farmers aim to export their products, with the majority being exported to the European Union, Africa's largest agricultural market. In contrast, non-certified organic farmers aim to sell their produce from home. In 2022, the area of organic agricultural land in Africa was over 1.2 million ha, representing 9.0% of the total organic agricultural area worldwide.
- In the African region, key organic crops include nuts, olives, coffee, cocoa, oilseeds, and cotton. Cash crops occupied a major share of organic agricultural land, accounting for 63.2% in 2022, with 817.4 thousand hectares. Row crops held the second-largest share of organic acreage, i.e., about 25.6%, accounting for 331.2 thousand hectares in the same year. Horticultural crops accounted for 11.2% of the organic acreage, with 144.9 thousand ha in 2022.
- In 2020, there were nearly 834,000 organic producers in Africa. The countries with the highest number of organic producers were Ethiopia (almost 220,000), Tanzania (nearly 149,000), and Uganda (over 139,000).
- In terms of area, Tunisia has the largest organic area under cultivation (more than 290,000 ha in 2020). The island state of Sao Tome and Principe has the region's highest percentage of land devoted to organic farming, i.e., 20.7%.
Per capita spending on organic product predominant in Egypt, South Africa, and Nigeria countries
- Africa's per capita income is consistently increasing, encouraging people to spend more on nutritious food. Organic foods and beverages are gaining more shelf space in the region.
- In Africa, consumption of organic products increased significantly, especially in Egypt, South Africa, and Nigeria. In 2021, the per capita consumption of organic products accounted for USD 55.5 in Egypt, followed by South Africa with USD 7.1. Within Africa, Uganda was an early adopter of organic farming and successfully established itself as a significant producer and exporter of organic products.
- In the African region, the commonly consumed organic products include fresh vegetables and fruits. Significant efforts have been made to mainstream organic agriculture into policy, national extension systems, marketing, and value chain development, thus gaining consumer attention.
- With the increasing per capita consumption of beverages, primarily fruit juices, growing health awareness, and consumers shifting toward organic food and drinks that do not contain chemical ingredients, the demand for organic food is expected to increase between 2023 and 2029.
- Though organic foods currently account for a small portion of the food industry, they are gaining popularity among African consumers. However, low income levels, lack of organic standards, and other infrastructure for local market certification may restrain the growth of the organic food market in the region.
Africa Biofertilizer Industry Overview
The Africa Biofertilizer Market is fragmented, with the top five companies occupying 2.49%. The major players in this market are Biolchim SPA, IPL Biologicals Limited, Microbial Biological Fertilizers International, Rizobacter and T. Stanes and Company Limited (sorted alphabetically).
Additional Benefits:
- The market estimate (ME) sheet in Excel format
- 3 months of analyst support
TABLE OF CONTENTS
1 EXECUTIVE SUMMARY & KEY FINDINGS
2 REPORT OFFERS
3 INTRODUCTION
- 3.1 Study Assumptions & Market Definition
- 3.2 Scope of the Study
- 3.3 Research Methodology
4 KEY INDUSTRY TRENDS
- 4.1 Area Under Organic Cultivation
- 4.2 Per Capita Spending On Organic Products
- 4.3 Regulatory Framework
- 4.3.1 Egypt
- 4.3.2 Iran
- 4.3.3 Nigeria
- 4.3.4 South Africa
- 4.4 Value Chain & Distribution Channel Analysis
5 MARKET SEGMENTATION (includes market size in Value in USD and Volume, Forecasts up to 2030 and analysis of growth prospects)
- 5.1 Form
- 5.1.1 Azospirillum
- 5.1.2 Azotobacter
- 5.1.3 Mycorrhiza
- 5.1.4 Phosphate Solubilizing Bacteria
- 5.1.5 Rhizobium
- 5.1.6 Other Biofertilizers
- 5.2 Crop Type
- 5.2.1 Cash Crops
- 5.2.2 Horticultural Crops
- 5.2.3 Row Crops
- 5.3 Country
- 5.3.1 Egypt
- 5.3.2 Nigeria
- 5.3.3 South Africa
- 5.3.4 Rest of Africa
6 COMPETITIVE LANDSCAPE
- 6.1 Key Strategic Moves
- 6.2 Market Share Analysis
- 6.3 Company Landscape
- 6.4 Company Profiles (includes Global Level Overview, Market Level Overview, Core Business Segments, Financials, Headcount, Key Information, Market Rank, Market Share, Products and Services, and Analysis of Recent Developments).
- 6.4.1 Atlantica Agricola
- 6.4.2 Biolchim SPA
- 6.4.3 IPL Biologicals Limited
- 6.4.4 Mapleton Agri Biotec Pt. Ltd
- 6.4.5 Microbial Biological Fertilizers International
- 6.4.6 Rizobacter
- 6.4.7 T. Stanes and Company Limited
- 6.4.8 Valent Biosciences LLC
- 6.4.9 Vegalab SA
7 KEY STRATEGIC QUESTIONS FOR AGRICULTURAL BIOLOGICALS CEOS
8 APPENDIX
- 8.1 Global Overview
- 8.1.1 Overview
- 8.1.2 Porter's Five Forces Framework
- 8.1.3 Global Value Chain Analysis
- 8.1.4 Market Dynamics (DROs)
- 8.2 Sources & References
- 8.3 List of Tables & Figures
- 8.4 Primary Insights
- 8.5 Data Pack
- 8.6 Glossary of Terms
 生物肥料市場-全球產業規模、佔有率、趨勢、機會和預測,按類型、形態、作物類型、應用、微生物類型、地區和競爭格局分類,2020-2030年預測
 基於固氮菌的生物肥料市場—按產品類型、作物類型、應用方法、分銷管道、最終用戶和配方類型分類—2025-2032年全球預測生物肥料市場按類型、形態、應用方法、作物類型和分銷管道分類-2025-2032年全球預測
 2032年生物肥料市場預測:按產品類型、微生物、作物類型、形態、應用和地區進行的全球分析
 2025年全球生物肥料市場報告
 生物肥料市場機會、成長動力、產業趨勢分析及2025-2034年預測固氮菌生物肥料市場機會、成長動力、產業趨勢分析及2025-2034年預測
 全球固氮菌生物肥料市場2025年全球根瘤菌肥料市場報告
 日本生物肥料市場報告(按類型、作物、微生物、應用方式和地區)2025-2033