


 |
市場調查報告書
商品編碼
1693766
亞太生物肥料市場佔有率分析、產業趨勢與成長預測(2025-2030)Asia-Pacific Biofertilizer - Market Share Analysis, Industry Trends & Statistics, Growth Forecasts (2025 - 2030) |
||||||
※ 本網頁內容可能與最新版本有所差異。詳細情況請與我們聯繫。
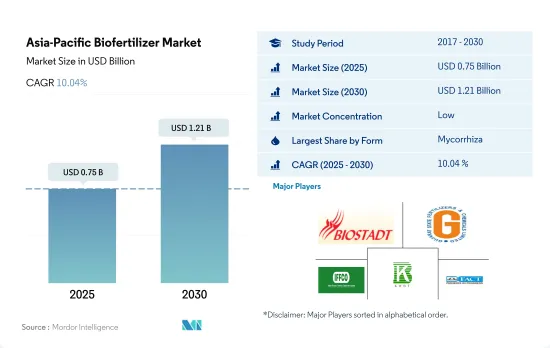
亞太生物肥料市場規模預計在 2025 年為 7.5 億美元,預計到 2030 年將達到 12.1 億美元,預測期內(2025-2030 年)的複合年成長率為 10.04%。
- 生物肥料是活的微生物,透過調動或增加土壤中的養分供應來促進植物營養。菌根真菌、固氮螺菌、固氮菌、根瘤菌和解磷細菌是農業中最常使用的生物肥料微生物。該地區的生物肥料市場以金額為準預計在 2017 年至 2022 年期間以 2.4% 的複合年成長率成長。然而,預計在 2023 年至 2029 年期間,生物肥料市場規模將以約 9.9%(複合年成長率)成長。
- 在這些生物肥料中,固氮菌是亞太地區使用第二廣泛的生物肥料,2022 年佔 24.6% 的市場佔有率,價值 1.418 億美元。固氮菌是一種固氮細菌,不需要共生關係,可以固定大氣中的氮,供植物利用。固氮菌可用作水稻、棉花和蔬菜等所有非反芻植物的生物肥料。
- 生物肥料消費將以連續作物為主,2022 年的價值約為 4.791 億美元。該地區種植的主要作物包括水稻、小麥、大麥、玉米和大豆。連續作物占主導地位的主要原因是有機種植面積大,2022 年有機種植面積約佔該地區作物種植面積的 67.5%。
- 隨著有機作物生產的擴大以及國內外市場對有機產品的需求不斷成長,該地區各國政府加強了推廣有機和永續農業的力度。這些因素可能會在整個預測期內影響市場。預計 2023 年至 2029 年期間亞太地區生物肥料市場的複合年成長率約為 9.9%。
- 2017年至2022年,亞太地區的有機種植面積將大幅擴大,分別從310萬公頃增加到380萬公頃。這是因為許多亞太國家對有機食品的需求不斷增加。因此,2017-2022年期間亞太生物肥料市場的複合年成長率為2.4%。
- 亞太地區第二受歡迎的生物肥料是固體氮菌,2022 年佔市佔率的 24.6%,價值 1.418 億美元。由於細菌具有固氮和溶解能力,固氮菌可用作農業生物肥料,使作物生產更永續76。
- 研究表明,固氮菌作為一種生物接種劑,可以合成大量生物活性化合物,如菸鹼酸、生物素、異固氮菌、維生素B和吉貝素,以支持根系發育和礦物質吸收,從而使農業生產力提高10-12%。大多數非草作物,包括水稻、小麥、小米、棉花、番茄、高麗菜、芥菜和紅花,都建議與固氮菌一起使用。
- 到2022年,中國將佔據生物肥料市場總量的93.5%,成為該地區的主導國家。 2022年中國生物肥料市場以行作物為主,佔82.3%。至2022年,有機種植面積將達210萬公頃。
- 消費者對有機產品的興趣日益濃厚,使農民意識到依賴農藥投入的弊端,從而增加了有機種植面積。預計 2023 年至 2029 年期間亞太地區對生物肥料的需求將以 8.6% 的複合年成長率成長。
亞太生物肥料市場趨勢
中國、印度、印尼和澳洲等國家擴大政府支持,以促進該地區的有機農業
- 根據FiBL統計,2021年亞太地區有機農地面積超過370萬公頃,佔全球有機農地面積的26.4%。 2017年至2022年間,有機種植面積增加了19.3%。截至 2020 年,該地區共有 183 萬家有機生產者,其中印度以 130 萬家位居榜首。中國、印度、印尼和澳洲是該地區有機種植面積最大的國家。中國和印度等國家的政府部門正在不斷推廣有機農業,以減少作物種植對化學物質的依賴。例如,印度實施了「Paramparagat Krishi Vikas Yojana」和「全印度有機農業網路計畫」(AI-NPOF)等計畫。
- 2021年,中國以250萬公頃的面積佔最大佔有率,為66.1%,其次是印度,為19.3%,印度尼西亞,為1.5%,澳大利亞,為1.4%。所有有機農地分為三種作物類型:連續作物、園藝作物和經濟作物。連作作物佔該地區有機土地的最大佔有率,2021 年為 67.5%,即 250 萬公頃。該地區種植的主要連作作物包括水稻、小麥、豆類、大豆和小米。
- 經濟作物將佔第二大佔有率,到2021年將達到70萬公頃,佔有機農地的18.5%。全球對糖和有機茶等有機經濟作物的需求正在增加。中國和印度分別是有機綠茶和有機紅茶的最大生產國。由於國際需求不斷成長,該地區有機種植面積預計會增加。
澳洲人均有機產品支出最高,而中國有機食品市場成長迅速
- 2021年該地區人均有機產品支出為85.1美元。同年澳洲人均有機產品支出較高,為34.49美元。根據全球有機貿易的數據,2021 年澳洲有機包裝食品和飲料市場價值 8.852 億美元。
- 預計2021年中國有機食品市場將成長13.3%,並將持續維持正成長模式,2023年至2029年的複合年成長率為7.1%。預計到2025年,有機市場規模將達到64億美元,這得益於年輕一代越來越重視有機產品,以及由於職業母親數量的增加和健康保健趨勢的普及,對有機嬰兒食品的需求不斷成長。
- 印度的有機產品遠遠落後於全球需求的 1.0%,2021 年的人均支出僅 0.08 美元。然而,印度市場在未來幾年可能會繼續成長,到 2025 年將達到 1.533 億美元。目前,該地區的有機市場高度分散,只有少數超級市場和專賣店銷售有機產品。增加消費者知識和改變購買模式可能會讓人們更了解該地區有機食品的永續性。人均收入的增加和消費者對有機食品重要性的認知的提高可能會推動亞太地區人均有機食品支出的增加。
亞太生物肥料產業概況
亞太生物肥料市場細分化,前五大公司佔30.04%。市場的主要企業有 Biostadt India Limited、Gujarat State Fertilizers & Chemicals Ltd、Indian Farmers Fertiliser Cooperative Limited、Kiwa Bio-Tech、The Fertilizers、Chemicals Travancore Limited 等。
其他福利
- Excel 格式的市場預測 (ME) 表
- 3個月的分析師支持
目錄
第1章執行摘要和主要發現
第2章 報告要約
第3章 引言
- 研究假設和市場定義
- 研究範圍
- 調查方法
第4章 產業主要趨勢
- 有機種植區
- 有機產品人均支出
- 法律規範
- 澳洲
- 中國
- 印度
- 印尼
- 日本
- 菲律賓
- 泰國
- 越南
- 價值鍊和通路分析
第5章市場區隔
- 形式
- 固氮螺菌
- 固氮菌
- 菌根真菌
- 解磷細菌
- 根瘤菌
- 其他生物肥料
- 作物類型
- 經濟作物
- 園藝作物
- 田間作物
- 原產地
- 澳洲
- 中國
- 印度
- 印尼
- 日本
- 菲律賓
- 泰國
- 越南
- 其他亞太地區
第6章競爭格局
- 關鍵策略趨勢
- 市場佔有率分析
- 商業狀況
- 公司簡介
- Atlantica Agricola
- Biolchim SpA
- Biostadt India Limited
- Gujarat State Fertilizers & Chemicals Ltd
- Indian Farmers Fertiliser Cooperative Limited
- IPL Biologicals Limited
- Kiwa Bio-Tech
- Sustane Natural Fertilizer Inc.
- Symborg Inc.
- The Fertilizers and Chemicals Travancore Limited
第7章:CEO面臨的關鍵策略問題
第 8 章 附錄
- 世界概況
- 概述
- 五力分析框架
- 全球價值鏈分析
- 市場動態(DRO)
- 資訊來源及延伸閱讀
- 圖片列表
- 關鍵見解
- 數據包
- 詞彙表
The Asia-Pacific Biofertilizer Market size is estimated at 0.75 billion USD in 2025, and is expected to reach 1.21 billion USD by 2030, growing at a CAGR of 10.04% during the forecast period (2025-2030).
- Biofertilizers are live microorganisms that promote plant nutrition by mobilizing or increasing nutrient availability in soils. Mycorrhiza, Azospirillum, Azotobacter, Rhizobium, and phosphate-solubilizing bacteria are the microorganisms most commonly utilized as biofertilizers in agriculture. The biofertilizer market in the region grew by 2.4% (CAGR) between 2017 and 2022 by value. However, the market value of biofertilizers is anticipated to increase by about 9.9% (CAGR) between 2023 and 2029.
- Among these biofertilizers, Azotobacter is the second most widely utilized in the Asia Pacific region, accounting for 24.6% of the market in 2022, with a value of USD 141.8 million. Azotobacter is a nitrogen-fixing bacterium that does not require symbiotic relationships to fix atmospheric nitrogen and make it available to plants. It is used as a biofertilizer for all non-leguminous plants, including rice, cotton, and vegetables.
- The consumption of biofertilizers is dominant in row crops, valued at about USD 479.1 million in 2022. The major row crops cultivated in the region include rice, wheat, barley, corn, and soybeans. The dominance of row crops is mainly due to their large organic cultivation area, which accounted for about 67.5% of the region's organic crop cultivation area in 2022.
- Government initiatives in various regional countries to promote organic or sustainable farming have increased in response to growing organic crop production and the rising demand for organic products in both domestic and international markets. These factors may have an impact on the market throughout the forecast period. The value of the Asia-Pacific biofertilizer market is anticipated to grow by about 9.9% (CAGR) between 2023 and 2029,.
- The organic area under cultivation in Asia-Pacific expanded significantly from 2017 to 2022, going from 3.1 million hectares to 3.8 million hectares, respectively. Owing to the growing demand for organically cultivated food in many Asia-Pacific countries. As a result, the Asia-Pacific biofertilizer market grew by 2.4% (CAGR) between 2017 and 2022.
- The second most popular biofertilizer in Asia-Pacific is Azotobacter, which accounted for 24.6% of the market in 2022, valued at USD 141.8 million. It can be used as a biofertilizer in agriculture to make crop production more sustainable through its ability to fix nitrogen and solubilize bacteria76
- Azotobacter as bioinoculants have been demonstrated to increase agricultural productivity by 10-12%, leading to the synthesis of significant amounts of biologically active compounds, including nicotinic acid, biotin, heteroauxins, vitamin B, and gibberellins, which support root development and mineral absorption. The majority of non-leguminous crops, including rice, wheat, millets, cotton, tomato, cabbage, mustard, and safflower, are recommended for Azotobacter use.
- China held 93.5% of the total biofertilizer market value in 2022, making it the dominant country in the region. Row crops dominated the Chinese biofertilizer market in 2022, accounting for 82.3%. Row crops held a major organic acreage in the country, which was 2.1 million hectares in 2022.
- Due to rising consumer interest in organic products, farmers have become more aware of the disadvantages of relying on agricultural chemical inputs and rising organic acreage. The demand for biofertilizers in Asia-Pacific is anticipated to increase between 2023 and 2029, with a CAGR of 8.6%.
Asia-Pacific Biofertilizer Market Trends
Growing government support in countries like China, India, Indonesia, and Australia, boosts organic farming in the region
- The area of organic agricultural land in Asia-Pacific was over 3.7 million ha in 2021, representing 26.4% of the global organic area, as per FiBL statistics. The organic area under cultivation grew by 19.3% between 2017-2022. As of 2020, the region had 1.83 million organic producers, with India topping the list with 1.3 million organic producers. China, India, Indonesia, and Australia are the major countries with large organic cultivation areas in the region. Government authorities in countries like China and India are constantly promoting organic agriculture to reduce reliance on chemical inputs for crop cultivation. For instance, India has implemented schemes like Paramparagat Krishi Vikas Yojana and the All India Network Programme on Organic Farming (AI-NPOF).
- In 2021, China accounted for a maximum share of 66.1%, with 2.5 million ha, followed by India, Indonesia, and Australia, with 19.3%, 1.5%, and 1.4%, respectively. The total organic land is divided into three crop types, namely row crops, horticultural crops, and cash crops. Row crops occupy a major share of organic agricultural land in the region, accounting for 67.5% share, i.e., 2.5 million ha in 2021. The major row crops grown in the region include paddy, wheat, pulses, soybeans, and millets.
- Cash crops held the second largest share, with 0.7 million ha in 2021, accounting for an 18.5% share of organic cropland. The demand for organic cash crops like sugar and organic tea is increasing worldwide. China and India are the largest organic green and black tea producers, respectively. The growing international demand is expected to increase the organic acreages in the region.
Per capita spending on organic product predominant in Australia and China's organic food market growing significantly
- The per capita spending on organic products in the region was recorded at USD 85.1 in 2021. Australia witnessed a higher per capita spending on organic products, with USD 34.49 in the same year, attributed to the higher demand due to consumers' perception of organic food as healthy. As per the Global Organic Trade data, the organic packaged food and beverage market in Australia was valued at USD 885.2 million in 2021.
- China's organic food market grew by 13.3% in 2021, and the positive growth pattern is expected to continue, with a CAGR of 7.1% between 2023 and 2029. With an increasing emphasis on the importance of organic products among the younger generation and the rising demand for organic baby food due to the growing number of mothers in the workforce and the increasing adoption of the health and wellness trend, organic products are expected to reach a value of USD 6.4 billion by 2025.
- Organic products in India represent far less than 1.0% of global demand, with a per capita expenditure of just USD 0.08 in 2021. However, the Indian market may grow over the coming years, reaching a value of USD 153.3 million by 2025. Currently, the region's organic goods market is highly fragmented, with just a few supermarkets and specialty stores selling them, as people from higher-income families are the only potential customers. Growing consumer knowledge and changing buying patterns may lead to a better understanding of organic food sustainability in the region. Increasing per capita income and increased consumer awareness of the importance of organic food can raise per capita expenditure on organic food items in the Asia-Pacific region.
Asia-Pacific Biofertilizer Industry Overview
The Asia-Pacific Biofertilizer Market is fragmented, with the top five companies occupying 30.04%. The major players in this market are Biostadt India Limited, Gujarat State Fertilizers & Chemicals Ltd, Indian Farmers Fertiliser Cooperative Limited, Kiwa Bio-Tech and The Fertilizers and Chemicals Travancore Limited (sorted alphabetically).
Additional Benefits:
- The market estimate (ME) sheet in Excel format
- 3 months of analyst support
TABLE OF CONTENTS
1 EXECUTIVE SUMMARY & KEY FINDINGS
2 REPORT OFFERS
3 INTRODUCTION
- 3.1 Study Assumptions & Market Definition
- 3.2 Scope of the Study
- 3.3 Research Methodology
4 KEY INDUSTRY TRENDS
- 4.1 Area Under Organic Cultivation
- 4.2 Per Capita Spending On Organic Products
- 4.3 Regulatory Framework
- 4.3.1 Australia
- 4.3.2 China
- 4.3.3 India
- 4.3.4 Indonesia
- 4.3.5 Japan
- 4.3.6 Philippines
- 4.3.7 Thailand
- 4.3.8 Vietnam
- 4.4 Value Chain & Distribution Channel Analysis
5 MARKET SEGMENTATION (includes market size in Value in USD and Volume, Forecasts up to 2030 and analysis of growth prospects)
- 5.1 Form
- 5.1.1 Azospirillum
- 5.1.2 Azotobacter
- 5.1.3 Mycorrhiza
- 5.1.4 Phosphate Solubilizing Bacteria
- 5.1.5 Rhizobium
- 5.1.6 Other Biofertilizers
- 5.2 Crop Type
- 5.2.1 Cash Crops
- 5.2.2 Horticultural Crops
- 5.2.3 Row Crops
- 5.3 Country
- 5.3.1 Australia
- 5.3.2 China
- 5.3.3 India
- 5.3.4 Indonesia
- 5.3.5 Japan
- 5.3.6 Philippines
- 5.3.7 Thailand
- 5.3.8 Vietnam
- 5.3.9 Rest of Asia-Pacific
6 COMPETITIVE LANDSCAPE
- 6.1 Key Strategic Moves
- 6.2 Market Share Analysis
- 6.3 Company Landscape
- 6.4 Company Profiles (includes Global Level Overview, Market Level Overview, Core Business Segments, Financials, Headcount, Key Information, Market Rank, Market Share, Products and Services, and Analysis of Recent Developments).
- 6.4.1 Atlantica Agricola
- 6.4.2 Biolchim SpA
- 6.4.3 Biostadt India Limited
- 6.4.4 Gujarat State Fertilizers & Chemicals Ltd
- 6.4.5 Indian Farmers Fertiliser Cooperative Limited
- 6.4.6 IPL Biologicals Limited
- 6.4.7 Kiwa Bio-Tech
- 6.4.8 Sustane Natural Fertilizer Inc.
- 6.4.9 Symborg Inc.
- 6.4.10 The Fertilizers and Chemicals Travancore Limited
7 KEY STRATEGIC QUESTIONS FOR AGRICULTURAL BIOLOGICALS CEOS
8 APPENDIX
- 8.1 Global Overview
- 8.1.1 Overview
- 8.1.2 Porter's Five Forces Framework
- 8.1.3 Global Value Chain Analysis
- 8.1.4 Market Dynamics (DROs)
- 8.2 Sources & References
- 8.3 List of Tables & Figures
- 8.4 Primary Insights
- 8.5 Data Pack
- 8.6 Glossary of Terms
 生物肥料市場-全球產業規模、佔有率、趨勢、機會和預測,按類型、形態、作物類型、應用、微生物類型、地區和競爭格局分類,2020-2030年預測
 基於固氮菌的生物肥料市場—按產品類型、作物類型、應用方法、分銷管道、最終用戶和配方類型分類—2025-2032年全球預測生物肥料市場按類型、形態、應用方法、作物類型和分銷管道分類-2025-2032年全球預測
 2032年生物肥料市場預測:按產品類型、微生物、作物類型、形態、應用和地區進行的全球分析
 2025年全球生物肥料市場報告
 生物肥料市場機會、成長動力、產業趨勢分析及2025-2034年預測固氮菌生物肥料市場機會、成長動力、產業趨勢分析及2025-2034年預測
 全球固氮菌生物肥料市場2025年全球根瘤菌肥料市場報告
 日本生物肥料市場報告(按類型、作物、微生物、應用方式和地區)2025-2033