


 |
市場調查報告書
商品編碼
2073656
生成式人工智慧:市場佔有率分析、產業趨勢和統計數據、成長預測(2026-2031 年)Generative AI - Market Share Analysis, Industry Trends & Statistics, Growth Forecasts (2026 - 2031) |
||||||

※ 本網頁內容可能與最新版本有所差異。詳細情況請與我們聯繫。
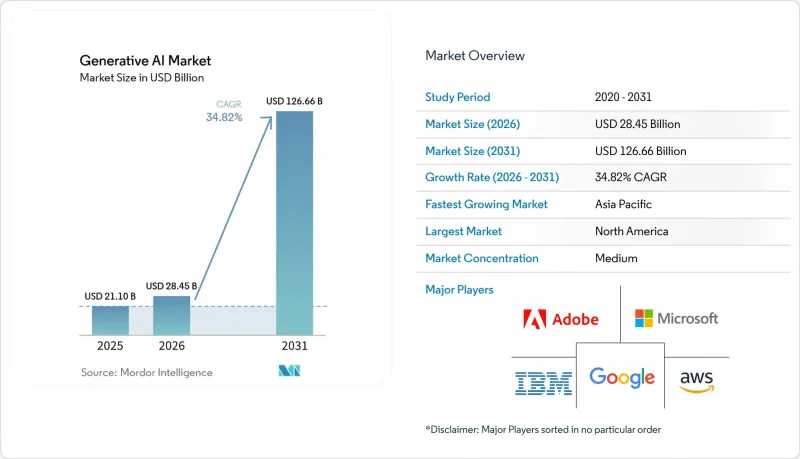
根據 Mordor Intelligence 預測,生成式人工智慧市場將從 2025 年的 211 億美元成長到 2026 年的 284.5 億美元,然後在 2031 年達到 1266.6 億美元,2026 年至 2031 年的複合年成長率為 34.82%。
本報告按元件(軟體、服務)、部署模式(雲端、本地部署等)、最終用戶產業(銀行、金融服務和保險、醫療保健等)、應用程式(內容創作、程式碼產生等)、模型架構(產生對抗網路、 變壓器等)、組織規模(大型企業、中小企業)和地區進行細分。市場預測以價值(美元)表示。
全球生成式人工智慧市場趨勢與洞察
促進公司整體生產力提升
人工智慧副駕駛和基於聊天功能的商務助理正被廣泛採用,並開始帶來可衡量的營運成果,尤其是在北美和歐洲的早期採用者中。財富500強企業將人工智慧整合到文件創建、會議總結和客戶服務工作流程中,並報告週期時間和錯誤率顯著降低。英國金融協會預測,金融服務公司分配給生成式人工智慧的技術預算比例將從2024年的12%提高到2025年的16%。儘管優勢顯而易見,但目前只有四分之一的專案達到了投資報酬率(ROI)目標,這凸顯了變革管理專業知識和健全管治結構的重要性。這種能力差距正在推動對實施服務的強勁需求,為擁有利用人工智慧的專業知識和能力的公司創造了永續的競爭優勢。
透過基礎模型降低模型訓練成本
基礎模型提供者透過讓企業能夠進行微調而非從零開始構建,顯著降低了高級功能所需的計算資源。這縮短了價值實現時間並減少了資金消耗。 NVIDIA 的 Blackwell 架構專為節能訓練和推理而設計,正是這一趨勢的典範,並幫助該公司實現其在 2025 會計年度之前 100% 使用可再生能源滿足其電力需求的目標。 GPU 市場的興起實現了透明的現貨定價,使中小企業能夠更輕鬆地根據專案規模獲取所需的資源。這種降低的實驗門檻正在加速全球的普及,尤其對於那些先前缺乏大規模運算資源的新興市場創新者而言更是如此。
資料隱私和人工智慧倫理合規風險
歐盟人工智慧法規定,違規者將被處以最高3500萬歐元(約4044萬美元)或全球銷售額7%的罰款,供應商必須創建詳細的技術文檔,並在向公眾發布模型前接受版權審查。日本新推出的《人工智慧商業準則》也對為日本國內用戶處理資料的外國供應商實施了管治標準。在美國,聯邦貿易委員會(FTC)正在審查雲端人工智慧合作協議中的壟斷條款,這表明反壟斷監管力道正在加強。跨國供應商現在被迫遵守多項重疊的法規,這些法規要求本地數據處理、演算法透明化和人工監督,這增加了市場准入門檻,而擁有強大法律資源的成熟企業則佔據優勢。
細分市場分析
到2025年,軟體仍將佔據生成式人工智慧市場63.45%的佔有率,體現了其作為模型開發、編配和應用交付核心促進者的作用。服務領域的成長速度更快,複合年成長率高達43.36%。這是因為許多組織缺乏內部資料科學技能,不得不依賴顧問公司進行整合、客製化和管治。雖然承包人工智慧平台的普及降低了進入門檻,但企業在變革管理方面仍面臨挑戰,這需要進行個人化培訓和流程重組。隨著合規性要求的增加,諮詢需求也隨之成長,預計服務領域的生成式人工智慧市場規模將穩定擴大。
服務需求的激增反映了在為醫療保健和銀行等受監管行業量身定做模型時,領域專業知識的戰略重要性。顧問公司透過將風險評估和道德審計與部署工作結合,打造了與持續模型監控相關的多年收入來源。隨著軟體供應商向第三方插件開放其生態系統,整合商也發現了新的交叉銷售機會。未來,基於訂閱的支援包可能會模糊軟體和服務之間的界限,但目前的收入組成表明,兩者之間的差異足以支撐各自的成長。
預計到2025年,雲端供應商將佔據生成式人工智慧市場71.80%的佔有率。這得益於資料中心的全球部署和託管服務模式,這些模式無需初始硬體投資。付費使用制的定價模式(根據尖峰使用量調整成本)對於實驗性工作負載仍然極具吸引力。然而,製造業、行動旅行和公共安全等領域對延遲高度敏感的任務凸顯了遠端推理的限制。隨著企業將加速器整合到閘道器、設備和手持設備中,預計分配給邊緣解決方案的生成式人工智慧市場將以49.88%的複合年成長率成長。
邊緣部署對那些在網路連線不穩定或因資料主權法規禁止向外部來源傳輸資料的情況下尋求容錯能力的企業極具吸引力。 2025 年邊緣人工智慧技術報告中詳述的技術進步表明,量化、剪枝和片上快取可以在不影響準確性的前提下顯著減少模型佔用空間。隨著客戶權衡延遲、成本和監管限制,能夠動態確定運算執行位置的混合架構有望成為主流。在預測期內,雲端供應商預計將發布託管邊緣堆疊,將開發者工具鏈與本地晶片更緊密地整合。
區域分析
北美地區擁有充裕的創業投資、豐富的技術人才和強大的雲端服務供應商環境,預計到2025年將佔據生成式人工智慧市場40.60%的收入佔有率。持續推進的公共部門計畫旨在促進可靠的人工智慧研究,這些計畫與私營主導的舉措相輔相成,共同維持該地區的創新勢頭。模型開發者和基礎設施供應商之間的密切合作進一步加速了商業化進程,而反壟斷調查則顯示監管機構對平台權力動態的關注度日益提高。
預計到2031年,亞太地區的複合年成長率將達到36.88%,主要得益於政府的獎勵策略、蓬勃發展的電子產品供應鏈以及快速成長的數位勞動力。印度對公共運算的大力投資清晰地表明了該地區彌合能力差距、實現關鍵人工智慧資產在地化的決心。澳洲、新加坡和韓國正利用國家安全和醫療保健方面的挑戰作為人工智慧創新的試驗場,從而獲得發展動力,而跨境創投基金則將資金投入高成長的新創公司。
歐洲正透過將產業政策獎勵與歐洲大陸最全面的AI管治架構結合,尋求平衡發展。歐盟人工智慧法的透明度規則預計將增加合規相關支出,同時為審計工具和認證資料集創造市場。北歐電力公司正在擴大可再生能源供給能力以滿足資料中心的需求,使歐盟成為低碳AI託管領域的潛在領導者。南美洲、中東和非洲正在探索自然資源和普惠金融等領域的專業應用,為全球AI應用版圖增添了多樣性。
其他好處:
- Excel格式的市場預測(ME)表
- 3個月的分析師支持
目錄
第1章:引言
- 研究假設和市場定義
- 調查範圍
第2章:調查方法
第3章執行摘要
第4章 市場狀況
- 市場概覽
- 市場促進因素
- 公司上下齊心協力提高生產力
- 利用基礎模型降低模型訓練成本
- 由創業投資和企業進行的大規模資金籌措。
- 合成數據市場的興起
- 在消費級硬體中實現設備內生成式人工智慧
- 對人工智慧驅動的程式碼產生的需求正在迅速成長。
- 市場限制因素
- 與資料隱私和人工智慧倫理相關的合規風險
- GPU和能源成本上升以及碳足跡
- 針對「高風險人工智慧」的行業特定法規(例如,歐盟人工智慧法)
- 先進製程GPU供不應求
- 監理情勢
- 技術影響分析
- 生成式對抗網路(GAN)
- 變壓器架構
- 變分自編碼器(VAE)
- 擴散模型
- 波特五力分析
- 宏觀經濟因素的影響
第5章 市場規模與成長預測
- 按組件
- 軟體
- 服務
- 部署模式
- 雲
- 現場
- 混合
- 邊緣/設備端
- 按最終用戶行業分類
- BFSI
- 衛生保健
- IT/通訊
- 政府
- 零售和消費品
- 製造業
- 媒體與娛樂
- 其他
- 透過使用
- 內容創作
- 程式碼生成
- 數據擴充
- 設計和原型製作
- 安全與風險分析
- 其他
- 模型架構
- GAN
- 變壓器
- VAE
- 擴散
- 自回歸類型/基於流的類型
- 按組織規模
- 大公司
- 小型企業
- 按地區
- 北美洲
- 美國
- 加拿大
- 墨西哥
- 南美洲
- 巴西
- 阿根廷
- 其他南美國家
- 歐洲
- 德國
- 英國
- 法國
- 義大利
- 其他歐洲國家
- 亞太地區
- 中國
- 日本
- 印度
- 韓國
- 其他亞太國家
- 中東
- 以色列
- 沙烏地阿拉伯
- 阿拉伯聯合大公國
- 土耳其
- 其他中東國家
- 非洲
- 南非
- 埃及
- 其他非洲國家
- 北美洲
第6章 競爭情勢
- 市場集中度
- 策略趨勢
- 市佔率分析
- 公司簡介
- Google LLC
- Microsoft Corporation
- OpenAI LP
- IBM Corporation
- Amazon Web Services Inc.
- Nvidia Corporation
- Adobe Inc.
- SAP SE
- Cohere Inc.
- Anthropic PBC
- Stability AI
- Midjourney Inc.
- Hugging Face Inc.
- Salesforce Inc.
- Databricks-MosaicML
- Oracle Corporation
- ServiceNow Inc.
- Arm Holdings plc
- Jasper AI
- Synthesia Ltd.
- Rephrase AI
- Konverge AI
第7章 市場機會與未來展望
According to Mordor Intelligence, the generative AI market size is expected to grow from USD 21.1 billion in 2025 to USD 28.45 billion in 2026 and is forecast to reach USD 126.66 billion by 2031 at 34.82% CAGR over 2026-2031.
This report is Segmented by Component (Software, Services), Deployment Mode (Cloud, On-Premise, and More), End-User Industry (BFSI, Healthcare, and More), Application (Content Creation, Code Generation, and More), Model Architecture (GAN, Transformer, and More), Organisation Size (Large Enterprises, Small and Medium Enterprises), and Geography. The Market Forecasts are Provided in Terms of Value (USD).
Global Generative AI Market Trends and Insights
Enterprise-wide Productivity Push
Widespread deployment of AI copilots and chat-based work assistants is beginning to translate into measurable operational gains, particularly among early adopters in North America and Europe. Fortune-class enterprises integrating AI into document creation, meeting summarization, and customer-service workflows report noticeable reductions in cycle time and error rates. UK Finance forecasts that financial services firms will raise the share of technology budgets dedicated to generative AI from 12% in 2024 to 16% in 2025. Despite clear upside, only one-quarter of projects currently meet return-on-investment targets, underscoring the importance of change-management expertise and robust governance frameworks. This capability gap sustains strong demand for implementation services and creates durable competitive advantages for firms that combine domain knowledge with AI fluency.
Falling Model-Training Costs via Foundation Models
Foundation-model providers have slashed the compute requirements for advanced capabilities by allowing enterprises to fine-tune rather than build from scratch, which compresses time-to-value and lowers cash burn. NVIDIA's Blackwell architecture, designed for energy-efficient training and inference, illustrates this trajectory while also pushing the company toward its goal of 100% renewable electricity by fiscal 2025. The rise of GPU marketplaces has created transparent spot pricing that helps smaller firms match resource needs to project scale. Lower thresholds for experimentation accelerate global diffusion, with particular benefits for innovators in emerging markets who previously lacked access to large-scale compute.
Data-Privacy and Ethical-AI Compliance Risk
The EU AI Act introduces fines reaching EUR 35 million (USD 40.44 million) or 7% of global turnover for non-compliance, compelling providers to produce detailed technical documentation and copyright-law checks before model release. Japan's new AI Business Guidelines extend governance standards to foreign suppliers that process domestic user data. In the United States, the Federal Trade Commission is examining exclusivity clauses in cloud-AI alliances, pointing to heightened antitrust scrutiny. Multinational vendors now juggle overlapping rules that mandate local data processing, algorithmic transparency, and human oversight, raising the cost of market entry and favoring incumbents with robust legal resources.
Other drivers and restraints analyzed in the detailed report include:
- VC and Corporate Mega-Funding Rounds
- Synthetic-Data Marketplaces Take-Off
- Escalating GPU and Energy Costs plus Carbon Footprint
For complete list of drivers and restraints, kindly check the Table Of Contents.
Segment Analysis
Software continued to capture 63.45% of the generative AI market in 2025, reflecting its role as the core enabler of model development, orchestration, and application delivery. The services segment is scaling faster at a 43.36% CAGR because many organizations lack in-house data-science skills and must rely on consultancies for integration, customization, and governance. Adoption of turnkey AI platforms lowers entry hurdles, yet enterprises still grapple with change management that requires bespoke training and process redesign. The generative AI market size for services is projected to grow steadily as compliance mandates create additional advisory demand.
The services surge also mirrors the strategic importance of domain expertise when tailoring models to regulated sectors such as healthcare and banking. Advisory firms bundle risk assessments and ethics audits with deployment work, creating multi-year revenue streams aligned to ongoing model monitoring. As software vendors open their ecosystems to third-party plug-ins, integrators gain new cross-selling avenues. Over time, subscription-based support packages may blur the line between software and services offerings, but the current revenue breakout suggests enough differentiation to sustain separate growth narratives.
Cloud vendors accounted for 71.80% of the generative AI market in 2025, leveraging global data-center footprints and managed-service models that eliminate upfront hardware spend. Consumption-based pricing aligns costs with usage peaks, a feature that remains attractive for experimental workloads. However, latency-sensitive tasks in manufacturing, mobility, and public safety highlight the limits of remote inference. The generative AI market size allocated to edge solutions is forecast to expand at a 49.88% CAGR as organizations embed accelerators into gateways, appliances, and handheld devices.
Edge deployment appeals to firms seeking resilience when connectivity is unreliable or data sovereignty rules forbid external transmission. Advances chronicled in the 2025 Edge AI Technology Report demonstrate that quantization, pruning, and on-chip caching can crush model footprints without compromising accuracy. Hybrid architectures that decide dynamically where computation runs will likely dominate as customers weigh latency, cost, and regulatory constraints. Over the forecast period, cloud providers are expected to launch managed edge stacks that bring their developer toolchains closer to local silicon.
Complete Report Scope:
- By Component
- Software
- Services
- By Deployment Mode
- Cloud
- On-Premise
- Hybrid
- Edge / On-Device
- By End-User Industry
- BFSI
- Healthcare
- IT and Telecommunication
- Government
- Retail and Consumer Goods
- Manufacturing
- Media and Entertainment
- Others
- By Application
- Content Creation
- Code Generation
- Data Augmentation
- Design and Prototyping
- Security and Risk Analytics
- Others
- By Model Architecture
- GAN
- Transformer
- VAE
- Diffusion
- Autoregressive / Flow-based
- By Organisation Size
- Large Enterprises
- Small and Medium Enterprises
- By Geography
- North America
- United States
- Canada
- Mexico
- South America
- Brazil
- Argentina
- Rest of South America
- Europe
- Germany
- United Kingdom
- France
- Italy
- Rest of Europe
- Asia-Pacific
- China
- Japan
- India
- South Korea
- Rest of Asia-Pacific
- Middle East
- Israel
- Saudi Arabia
- United Arab Emirates
- Turkey
- Rest of Middle East
- Africa
- South Africa
- Egypt
- Rest of Africa
- North America
Geography Analysis
North America generated 40.60% of 2025 revenue for the generative AI market, buoyed by abundant venture capital, deep pools of technical talent, and a robust cloud-provider landscape. Ongoing public-sector programs that promote trustworthy AI research complement private initiatives, maintaining the region's innovation momentum. Tight coupling between model developers and infrastructure vendors further accelerates commercialization, though antitrust probes signal growing regulatory interest in platform power dynamics.
The Asia-Pacific region is on track for a 36.88% CAGR through 2031, propelled by government stimulus, a thriving electronics supply chain, and rapid digital-workforce expansion. India's aggressive investment in public compute illustrates the region's determination to close capability gaps and localize key AI assets. Australia, Singapore, and South Korea add momentum by turning national-security and healthcare challenges into AI innovation sandboxes, while cross-border venture funds channel capital toward high-growth startups.
Europe pursues balanced progress by pairing industrial-policy incentives with the continent's most comprehensive AI governance regime. The EU AI Act's transparency rules are expected to raise compliance spending but also create a market for audit tooling and certified datasets. Northern European utilities accelerate renewable-energy capacity to meet data-center demand, positioning the bloc as a potential leader in low-carbon AI hosting. Emerging regions in South America, the Middle East, and Africa explore sector-specific deployments in natural resources and financial inclusion, adding diversity to the global adoption map.
- Google LLC
- Microsoft Corporation
- OpenAI LP
- IBM Corporation
- Amazon Web Services Inc.
- Nvidia Corporation
- Adobe Inc.
- SAP SE
- Cohere Inc.
- Anthropic PBC
- Stability AI
- Midjourney Inc.
- Hugging Face Inc.
- Salesforce Inc.
- Databricks - MosaicML
- Oracle Corporation
- ServiceNow Inc.
- Arm Holdings plc
- Jasper AI
- Synthesia Ltd.
- Rephrase AI
- Konverge AI
Additional Benefits:
- The market estimate (ME) sheet in Excel format
- 3 months of analyst support
TABLE OF CONTENTS
1 INTRODUCTION
- 1.1 Study Assumptions and Market Definition
- 1.2 Scope of the Study
2 RESEARCH METHODOLOGY
3 EXECUTIVE SUMMARY
4 MARKET LANDSCAPE
- 4.1 Market Overview
- 4.2 Market Drivers
- 4.2.1 Enterprise-wide productivity push
- 4.2.2 Falling model-training costs via foundation models
- 4.2.3 VC and corporate mega-funding rounds
- 4.2.4 Synthetic-data marketplaces take-off
- 4.2.5 On-device Gen-AI enablement in consumer hardware
- 4.2.6 AI-assisted code-generation demand spike
- 4.3 Market Restraints
- 4.3.1 Data-privacy and ethical-AI compliance risk
- 4.3.2 Escalating GPU/energy costs and carbon-footprint
- 4.3.3 Sector-specific "high-risk AI" regulation (EU AI Act, etc.)
- 4.3.4 Advanced-node GPU supply shortages
- 4.4 Regulatory Landscape
- 4.5 Technology Impact Analysis
- 4.5.1 Generative Adversarial Networks (GANs)
- 4.5.2 Transformer Architectures
- 4.5.3 Variational Autoencoders (VAEs)
- 4.5.4 Diffusion Models
- 4.6 Porter's Five Forces Analysis
- 4.6.1 Bargaining Power of Buyers
- 4.6.2 Bargaining Power of Suppliers
- 4.6.3 Threat of New Entrants
- 4.6.4 Threat of Substitutes
- 4.6.5 Intensity of Competitive Rivalry
- 4.7 Impact of Macro-Economic Factors
5 MARKET SIZE AND GROWTH FORECASTS (VALUES)
- 5.1 By Component
- 5.1.1 Software
- 5.1.2 Services
- 5.2 By Deployment Mode
- 5.2.1 Cloud
- 5.2.2 On-Premise
- 5.2.3 Hybrid
- 5.2.4 Edge / On-Device
- 5.3 By End-User Industry
- 5.3.1 BFSI
- 5.3.2 Healthcare
- 5.3.3 IT and Telecommunication
- 5.3.4 Government
- 5.3.5 Retail and Consumer Goods
- 5.3.6 Manufacturing
- 5.3.7 Media and Entertainment
- 5.3.8 Others
- 5.4 By Application
- 5.4.1 Content Creation
- 5.4.2 Code Generation
- 5.4.3 Data Augmentation
- 5.4.4 Design and Prototyping
- 5.4.5 Security and Risk Analytics
- 5.4.6 Others
- 5.5 By Model Architecture
- 5.5.1 GAN
- 5.5.2 Transformer
- 5.5.3 VAE
- 5.5.4 Diffusion
- 5.5.5 Autoregressive / Flow-based
- 5.6 By Organisation Size
- 5.6.1 Large Enterprises
- 5.6.2 Small and Medium Enterprises
- 5.7 By Geography
- 5.7.1 North America
- 5.7.1.1 United States
- 5.7.1.2 Canada
- 5.7.1.3 Mexico
- 5.7.2 South America
- 5.7.2.1 Brazil
- 5.7.2.2 Argentina
- 5.7.2.3 Rest of South America
- 5.7.3 Europe
- 5.7.3.1 Germany
- 5.7.3.2 United Kingdom
- 5.7.3.3 France
- 5.7.3.4 Italy
- 5.7.3.5 Rest of Europe
- 5.7.4 Asia-Pacific
- 5.7.4.1 China
- 5.7.4.2 Japan
- 5.7.4.3 India
- 5.7.4.4 South Korea
- 5.7.4.5 Rest of Asia-Pacific
- 5.7.5 Middle East
- 5.7.5.1 Israel
- 5.7.5.2 Saudi Arabia
- 5.7.5.3 United Arab Emirates
- 5.7.5.4 Turkey
- 5.7.5.5 Rest of Middle East
- 5.7.6 Africa
- 5.7.6.1 South Africa
- 5.7.6.2 Egypt
- 5.7.6.3 Rest of Africa
- 5.7.1 North America
6 COMPETITIVE LANDSCAPE
- 6.1 Market Concentration
- 6.2 Strategic Moves
- 6.3 Market Share Analysis
- 6.4 Company Profiles (includes Global level Overview, Market level overview, Core Segments, Financials as available, Strategic Information, Market Rank/Share for key companies, Products and Services, and Recent Developments)
- 6.4.1 Google LLC
- 6.4.2 Microsoft Corporation
- 6.4.3 OpenAI LP
- 6.4.4 IBM Corporation
- 6.4.5 Amazon Web Services Inc.
- 6.4.6 Nvidia Corporation
- 6.4.7 Adobe Inc.
- 6.4.8 SAP SE
- 6.4.9 Cohere Inc.
- 6.4.10 Anthropic PBC
- 6.4.11 Stability AI
- 6.4.12 Midjourney Inc.
- 6.4.13 Hugging Face Inc.
- 6.4.14 Salesforce Inc.
- 6.4.15 Databricks - MosaicML
- 6.4.16 Oracle Corporation
- 6.4.17 ServiceNow Inc.
- 6.4.18 Arm Holdings plc
- 6.4.19 Jasper AI
- 6.4.20 Synthesia Ltd.
- 6.4.21 Rephrase AI
- 6.4.22 Konverge AI
7 MARKET OPPORTUNITIES AND FUTURE OUTLOOK
- 7.1 White-space and Unmet-Need Assessment

 生成式人工智慧晶片組市場:全球市場預測,2026-2032年AI驅動的人臉生成工具市場:全球市場預測(2026-2032年)
 工業設計中的生成式人工智慧:市場規模、佔有率、成長、全球產業分析、區域趨勢及2026年至2034年預測
 2026年全球生成式人工智慧媒體軟體市場報告
 生成式人工智慧與基於代理的人工智慧市場:2026-2032年
 AI音樂產生市場規模、佔有率和趨勢分析報告:按經營模式、應用、最終用途、地區和細分市場預測(2026-2033年)
 擴增實境(AR)生成式人工智慧市場規模、佔有率和成長分析:按組件、部署模式、應用、最終用戶和地區分類 - 產業預測,2026-2033年人工智慧在全球汽車售後市場的應用
 2026-2030年全球生成式人工智慧(AI)市場
 全球工業生成式人工智慧自動化市場預測至2034年:按產品、組件、技術、部署、應用、最終用戶和地區分類