


 |
市場調查報告書
商品編碼
1639421
行動分析 -市場佔有率分析、產業趨勢與統計、成長預測(2025-2030)Mobile Analytics - Market Share Analysis, Industry Trends & Statistics, Growth Forecasts (2025 - 2030) |
||||||
※ 本網頁內容可能與最新版本有所差異。詳細情況請與我們聯繫。
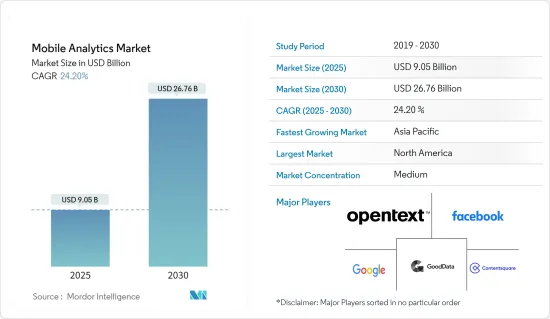
行動分析市場規模預計到 2025 年將達到 90.5 億美元,預計到 2030 年將達到 267.6 億美元,預測期內(2025-2030 年)複合年成長率為 24.2%。
推動市場的關鍵因素是多個行動分析營運商採用人工智慧、巨量資料和機器學習等創新技術。
主要亮點
- 消費者現在經常使用行動應用程式來執行日常任務。這些應用程式使用大量資料。為了有效地管理和分析如此龐大的資料,需要強大的分析系統。從這個意義上說,資料分析就顯得極為重要。這些應用程式幫助不同的企業獲得資料主導的見解。行動應用程式分析是對行動應用程式內活動的監控。這項研究可以揭示使用者如何與程式互動以及某些事件是否導致他們卸載程式。它還追蹤互動、技術資料、轉換管道和其他指標,以幫助您確定您的應用程式是否對您的受眾和您的業務有意義,從而使您能夠指導未來的開發。
- 根據國際電信聯盟的預測,去年有近 53 億人(約佔世界人口的 66%)使用了網路。增強的人工智慧 (AI) 和機器學習模型正在使行動分析解決方案(包括應用程式分析)變得更加智慧。該應用程式的大多數管理指標已經不再只是簡單地呈現訊息,而是融入了資料分析模型和儀表板。 Google 使用 Firebase 實現行動裝置分析的現代化。通知、歸因、邀請、儲存、深層連結、AdMob 和 AdWords 全部匯集在一起,為企業和消費者提供最大的洞察力。例如,Google Analytics 和 Microsoft Clarity 開發了一款應用程式分析助手,可協助企業領導者無需進行資料探勘即可發現令人信服的見解。
- 產品和行銷團隊可以使用行動分析資料來創建積極的回饋循環。當您更新網站或應用程式、啟動宣傳活動或發布新功能時,您可以測試這些變更如何影響您的受眾。根據受眾的反應,團隊可以做出進一步的更改並獲得更多資料以進行進一步測試。這創造了一個改進產品的良性循環。依賴應用程式的行動分析比傳統的基於網路的分析平台更加方便和準確。大多數行動分析工具使用 SDK 來追蹤使用者活動,允許供應商根據作業系統使用不同的程式碼來追蹤自訂事件。
- 與網路分析不同,SDK 不依賴 cookie 來唯一識別使用者。因此,與其他一些方法相比,移動分析可能會產生更準確的結果。此外,與典型的桌面使用相比,行動電話佔據了全球網路流量的大部分。
- 然而,行動分析業務必須解決資料安全問題。由於敏感資料洩露,應用程式分析公司損失了許多用戶和收入。一些盜版者闖入用戶帳戶以竊取合法用戶的重要資訊。這些憑證被出售,用戶的敏感資料透過P2P文件共用通訊協定或 VPN傳輸。注入攻擊、拒絕服務 (DoS) 攻擊和病毒攻擊允許存取資料管理軟體並損害資料機密性,從而對資料安全構成威脅。
- COVID-19 的爆發影響了多個行業,包括行動行銷和廣告。短期內,公司正在控制行銷支出,直到局勢穩定下來。然而,未來,廣告預算將從印刷和戶外活動等傳統行銷轉向數位和行動行銷,最終用戶將主要留在室內並主要在行動電話和電視上消費內容。因此,減少社交距離將對行動行銷分析的使用產生正面影響。
行動分析市場趨勢
零售業佔據主要市場佔有率
- 零售業務管理已成為一個複雜的過程,已從專注於產品轉向關注客戶滿意度。消費者的期望不斷增加。他們期望各層面的個人化、更快的履約選項以及統一的全通路體驗。競爭壓力不斷增加,商業的定義不斷演變。
- 零售公司正在利用行動作為強大的行銷平台。零售企業,尤其是電子商務企業,預計將成為行動分析解決方案的主要需求目的地。由於電子商務公司努力創造個人化購物體驗,行動分析市場預計將在全球範圍內產生可觀的收益。
- 隨著全球零售和電子商務行業的擴張,行動分析提供者擁有龐大的市場。隨著網路基礎設施的發展,這些產業持續顯著成長,為當地供應商創造了巨大潛力。例如,根據美國零售聯合會的數據,去年美國零售商店的收益超過 4.86 兆美元。此外,零售業銷售額預計將成長6%至8%,去年電子商務零售業超過1.17兆美元,年增率為11%至13%。用於電子商務和零售的行動分析解決方案在美國、印度、中國、韓國和台灣等國家越來越受歡迎。
- 此外,根據印度品牌資產基金會的數據,零售業已成為印度最具活力的產業之一,預計到 2024 年將達到近 1.3 兆美元。
- 市場上的供應商活動反映了零售商和行動分析平台之間不斷加強的合作,以滿足各種新興需求,包括新客戶的獲取和保留。這些長期合作夥伴關係為擴大我們的研究目標市場做出了巨大貢獻。
- 由於整個行業的數位化程度不斷提高、多通路業務的成長以及零售分析解決方案的創建,零售業變得越來越活躍。零售組織必須處理大量資料,包括客戶購買習慣,因此每一次接觸和資料點都有可能使零售部門更有效和成功。零售公司正在投資技術開發以改善勞動程序。行動分析的採用正在提高零售收益和客戶服務效率。
亞太地區佔主要市場佔有率
- 由於智慧型手機使用量的快速增加和行動商務電子郵件的增加,預計亞太地區行動分析市場將在預測期內顯著成長。根據TRAI的報告,截至去年10月底,印度通訊用戶數達到117,045萬戶。
- 此外,印度不斷擴張的零售和電子商務行業已成為行動分析提供商的龐大市場。隨著中國網路基礎設施的改善,這些產業預計將繼續大幅成長,為國內供應商創造巨大潛力。德里、孟買、班加羅爾和海得拉巴等城市正在成為電子商務和零售主導的行動分析解決方案的主要中心。根據IBEF 預測,到2025 年,印度社群電商產業規模可能會成長至160 億至200 億美元,複合年成長率為55%-60%,其中電子商務市場預計到2024 年將成長至1,110 億美元,到2026 年將成長至1,110 億美元預計將達到2,000億美元。
- 隨著智慧型手機的普及,亞太地區對行動分析服務的需求不斷增加。客戶還使用行動分析來對行動資料流量進行基本調查。行動電話和平板電腦的普及、智慧型網路安全解決方案的需求不斷成長以及網路服務收入推動了行動分析市場。
- 擁有大量用戶的公司正在效仿亞洲其他地區「超級應用程式」的成功,以使其服務產品脫穎而出。例如,GoJek 和 Grab 為東南亞用戶提供叫車、付款系統、食品配送、電子商務、出版等服務,他們的經營模式也在印度市場取得進展。例如,Truecaller 是一款擁有 1.4 億日有效用戶的應用程式,可以篩檢陌生人和機器人的來電,該應用程式計劃引入信用融資系統。印度用戶還可以使用該應用程式來錄音、發送訊息和付款。
- 此外,甚至在冠狀病毒之前,印度的大部分數位廣告支出就集中在行動裝置上,而這一世界性事件是這一趨勢的催化劑。該公司 45-55% 的數位廣告預算花在行動裝置上,預計去年這一比例將增至 65% 以上。據 Exchange4Media 稱,廣告預算大量投資於富媒體、社群媒體行銷和付費搜尋廣告。預計此類趨勢將進一步推動所研究市場的成長。
行動分析產業概述
全球行動分析市場由幾家大公司主導,市場佔有率OpenText Corporation、Facebook Inc.、Google LLC、Microsoft Corporation 和 Contentsquare SaaS。這些公司專注於與行動分析相關的研發活動。我們將介紹一些最近的市場趨勢。
- 2022 年 4 月 - Mobile Marketing 和 Roomvo 共同建置了一個視覺化分析模組,可在 Mobile Marketing 的用戶端網站上使用。據該公司稱,透過使用 Roomvo 強大的分析功能,商家可以對客戶有新的了解,並做出從庫存系統到促銷規劃的資料驅動的業務選擇。
- 2022 年 11 月 - Vianova 與按需運輸公司 Fenix 建立策略合作夥伴關係,展示其在中東的行動專業知識。 Fenix 在沙烏地阿拉伯、阿拉伯聯合大公國、巴林和卡達等五個國家使用 Vianova 的行動分析平台,以獲得車輛洞察並加強與城市的合作。
其他好處
- Excel 格式的市場預測 (ME) 表
- 3 個月分析師支持
目錄
第1章簡介
- 研究假設和市場定義
- 調查範圍
第2章調查方法
第3章執行摘要
第4章市場洞察
- 市場概況
- 產業價值鏈分析
- 產業吸引力-波特五力分析
- 供應商的議價能力
- 消費者議價能力
- 新進入者的威脅
- 替代品的威脅
- 競爭公司之間敵對關係的強度
- 評估 COVID-19 對行動分析市場的影響
第5章市場動態
- 市場促進因素
- 智慧型手機革命產生大量資料
- 電子商務資料爆炸可能推動市場
- 市場問題
- 安全漏洞挑戰
第6章 市場細分
- 按類型
- 應用分析
- 宣傳活動分析
- 服務分析
- 其他
- 按行業分類
- 零售
- BFSI
- 政府機構
- 資訊科技和電信
- 媒體娛樂
- 其他
- 按地區
- 北美洲
- 歐洲
- 亞太地區
- 其他
第7章 競爭格局
- 公司簡介
- OpenText Corporation
- Facebook Inc.
- GoodData Corporation
- Google LLC
- Contentsquare SaaS
- Microsoft Corporation
- Oracle Corp.
- Adobe Inc.
- Salesforce.com Inc
- AppsFlyer Ltd
第8章投資分析
第9章 市場機會及未來趨勢
The Mobile Analytics Market size is estimated at USD 9.05 billion in 2025, and is expected to reach USD 26.76 billion by 2030, at a CAGR of 24.2% during the forecast period (2025-2030).
The main factor driving the market is the adoption of innovative technologies like artificial intelligence, big data, and machine learning by several mobile analytics businesses.
Key Highlights
- Mobile apps are now more frequently used by consumers to do daily tasks. These applications use a huge amount of data. A powerful analytics system is needed to manage and analyze this enormous amount of data effectively. In this context, data analytics is quite important. It helps diverse businesses use these apps to gain data-driven insight. Mobile App Analytics is to monitor activity within mobile applications. This research can reveal how users interact with a program and whether a specific incident led users to uninstall it. Tracking interaction, technical data, conversion funnels, and other metrics can also assist in determining whether an app makes sense for both the audience and the business and can direct its future development.
- ITU predictions nearly 5.3 billion people or about 66% of the global population - were utilizing the Internet last year. With enhanced Artificial Intelligence (AI) and machine learning models, mobile analytics solutions, including app analytics, are becoming smarter. The majority of app management metrics are evolving beyond simply presenting information to incorporate data analytics modeling and dashboarding. Google is utilizing Firebase to reinvent analytics for mobile devices. Notifications, attribution, invitations, storage, deep links, AdMob, and AdWords are all packed together to give companies and consumers the greatest insights. For example, Google Analytics and Microsoft Clarity have developed app analytics assistants for corporate leaders to uncover fascinating insights without the need for data mining.
- Product and marketing teams can create positive feedback loops with mobile analytics data. As they update their site or app, launch campaigns, and release new features, they can test the impact of these changes on their audience. Based on how audiences respond, teams can make further changes that yield even more data and lead to more testing. This creates a virtuous cycle that polishes the product. Mobile analytics, which depends on apps, is far more convenient and accurate than traditional web-based analytics platforms. As most mobile analytics tools use an SDK to track user activity, vendors can use various codes to track custom events, depending on the operating system.
- Unlike web analytics, SDKs do not depend on cookies to uniquely identify a user. Hence, compared to several other approaches, mobile analytics will likely generate more accurate results. Also, mobile phones are responsible for most internet traffic globally compared to general desktop usage.
- However, mobile analytics businesses still need to address data security problems. Due to sensitive data breaches, app analytics firms lost a large number of users and income. Some pirates break into user accounts in order to steal important information from legitimate users. These credentials are sold, and users' sensitive data is transferred using peer-to-peer file-sharing protocols or a VPN. Injection attacks, Denial of Service (DoS) assaults, and virus attacks pose data security threats by allowing access to data management software and putting data confidentiality at risk.
- The COVID-19 pandemic impacted multiple sectors, including mobile marketing and advertising. In the short term, companies have curtailed their marketing spending till the situation stabilizes. However, in the future, the shift of advertising budget from traditional marketing like print and outdoor activities to digital and mobile marketing would witness a spike, with end-users being indoors and preferring to consume content primarily on their mobile phones or TV. Social distancing, thus positively impacting the usage of mobile marketing analytics.
Mobile Analytics Market Trends
Retail Industry Holds Significant Market Share
- Retail management has become an intricate process with customer satisfaction as its central theme, shifting from focusing on products. Shopper expectations are increasing where. They expect personalization at all levels, faster fulfillment options, and unified omnichannel experiences. Competitive pressures are also increasing, and the definition of commerce continues to evolve.
- Retailers are using mobile as a powerful marketing platform. The retail sector, especially e-commerce operations, is expected to be the primary demand for mobile analytics solutions. Efforts of e-commerce companies to create personalized shopping experiences are expected to draw considerable revenues to the mobile analytics market globally.
- An enormous market is available for mobile analytics providers because of the expanding global retail and e-commerce industries. The industries will continue to grow significantly with the development of internet infrastructure, creating a significant potential for local suppliers. For instance, According to the National Retail Federation, revenues from over retail outlets in the United States exceeded USD 4.86 trillion last year. Furthermore, retail industry sales are predicted to rise between 6% and 8%, and e-commerce retail sales exceeded USD 1.17 trillion last year, growing at an 11-13% annual pace. Mobile analytics solutions for e-commerce and retail are increasingly popular in nations including the United States, India, China, South Korea, Taiwan, and others.
- Moreover, the retail industry has emerged as one of the dynamic industries in India, which is anticipated to reach nearly USD 1.3 trillion by 2024, according to the India Brand Equity Foundation.
- The market's vendor activity points to expanding collaborations between retailers and mobile analytics platforms to meet various emerging needs, including new customer acquisition and retention. Such long-term alliances have significantly contributed to the market under study's expansion.
- The retail industry has become more dynamic as a result of increased digitization throughout the retail industry, the growth of multi-channel operations, and the creation of retail analytics solutions. Since retail organizations must handle a massive quantity of data, such as customer purchasing habits, every encounter and data point can potentially make the retail sector more effective and successful. Retailers are investing in developing technology to improve labor procedures. The adoption of mobile analytics boosts retail revenue and customer service effectiveness.
Asia Pacific to Occupy Significant Market Share
- The Asia Pacific, mobile analytics market, is expected to grow significantly over the forecast period owing to the surge of smartphone device utilization and an increasing number of mobile business emails. According to a TRAI report, India's telecom subscriber base reached 1170.45 million at the end of October last year.
- Additionally, the expanding Indian retail and e-commerce industry presents a sizable market for mobile analytics providers. The industries will continue to grow significantly with the improvement of the nation's internet infrastructure, creating a major potential for local suppliers. Major hubs for e-commerce and retail-driven mobile analytics solutions are emerging in cities like Delhi, Mumbai, Bangalore, and Hyderabad. According to IBEF, India's social commerce sector has the ability to develop to USS 16 to 20 billion in the year 2025, at a CAGR between 55% to 60%, while the country's e-commerce market is predicted to reach USD 111 billion by 2024, and USD 200 billion by 2026.
- As smartphones become more popular, there is an increasing need for mobile analytics services in the APAC area. Customers also employ mobile analytics for a fundamental study of mobile data traffic. The mobile analytics market is driven by the proliferation of phones and tablets, the rising need for smart cybersecurity solutions, and income from internet services.
- Companies with a large audience differentiate their offering, replicating the success of 'super-apps' seen elsewhere in Asia. For example, GoJek and Grab are offering users across South Eastasia a range of features, such as ride-hailing, payment systems, food delivery, e-commerce, publishing, and their business model, is one that is catching on in the Indian market. For instance, Truecaller - an app that allows its 140 million daily active users to screen calls from strangers and bots - plans to implement a credit loaning system. Users based in India can also use the app to record calls, send messages, and complete payments.
- Furthermore, most of India's digital ad spend was mobile-focused before the coronavirus pandemic, and this global event has acted as a catalyst for this trend. Between 45-55% of organizations' digital advertising budgets are spent on mobile, which is anticipated to increase to more than 65% in the last year. As per Exchange4Media, ad budgets invest heavily in rich media, social media marketing, and paid search. Such trends are expected to drive further the growth of the market studied.
Mobile Analytics Industry Overview
The Global Mobile Analytics Market is dominated by a few giants, like OpenText Corporation, Facebook Inc., Google LLC, Microsoft Corporation, and Contentsquare SaaS, which occupy most of the market share. They are emphasizing R&D activities related to mobile analytics. Some of the recent developments in the market are:
- April 2022 - Mobile Marketing and Roomvo collaborated to build a visualizer analytics module available on Mobile Marketing's client site. According to the firm, using strong analytics from Roomvo, merchants can acquire new levels of insight into their customers and make data-driven business choices, from inventory systems to promotion planning.
- November 2022 - Vianova established a strategic alliance with on-demand transportation company Fenix to deliver mobility expertise to the Middle East. Fenix employs Vianova's mobile analytics platform in five countries, including Saudi Arabia, United Arab Emirates, Bahrain, and Qatar, to get insights about its fleets and increase collaboration with cities.
Additional Benefits:
- The market estimate (ME) sheet in Excel format
- 3 months of analyst support
TABLE OF CONTENTS
1 INTRODUCTION
- 1.1 Study Assumptions and Market Definition
- 1.2 Scope of the Study
2 RESEARCH METHODOLOGY
3 EXECUTIVE SUMMARY
4 MARKET INSIGHTS
- 4.1 Market Overview
- 4.2 Industry Value Chain Analysis
- 4.3 Industry Attractiveness - Porter's Five Forces Analysis
- 4.3.1 Bargaining Power of Suppliers
- 4.3.2 Bargaining Power of Consumers
- 4.3.3 Threat of New Entrants
- 4.3.4 Threat of Substitute Products
- 4.3.5 Intensity of Competitive Rivalry
- 4.4 Assessment of the Impact of COVID-19 on the Mobile Analytics Market
5 MARKET DYNAMICS
- 5.1 Market Drivers
- 5.1.1 Smartphone Revolution to Generate Enormous Data
- 5.1.2 Data Explosion from E- commerce Likely to Propel the Market
- 5.2 Market Challenges
- 5.2.1 Challenges Regarding Security Breach
6 MARKET SEGMENTATION
- 6.1 By Type
- 6.1.1 Application Analytics
- 6.1.2 Campaign Analytics
- 6.1.3 Service Analytics
- 6.1.4 Other Applications
- 6.2 By End-User Vertical
- 6.2.1 Retail
- 6.2.2 BFSI
- 6.2.3 Government
- 6.2.4 IT and Telecom
- 6.2.5 Media and Entertainment
- 6.2.6 Other End-User Verticals
- 6.3 By Geography
- 6.3.1 North America
- 6.3.2 Europe
- 6.3.3 Asia Pacific
- 6.3.4 Rest of the World
7 COMPETITIVE LANDSCAPE
- 7.1 Company Profiles
- 7.1.1 OpenText Corporation
- 7.1.2 Facebook Inc.
- 7.1.3 GoodData Corporation
- 7.1.4 Google LLC
- 7.1.5 Contentsquare SaaS
- 7.1.6 Microsoft Corporation
- 7.1.7 Oracle Corp.
- 7.1.8 Adobe Inc.
- 7.1.9 Salesforce.com Inc
- 7.1.10 AppsFlyer Ltd


