


 |
市場調查報告書
商品編碼
1761192
非接觸付款市場資料:2025-2030年Contactless Payments Market Data: 2025-2030 |
||||||
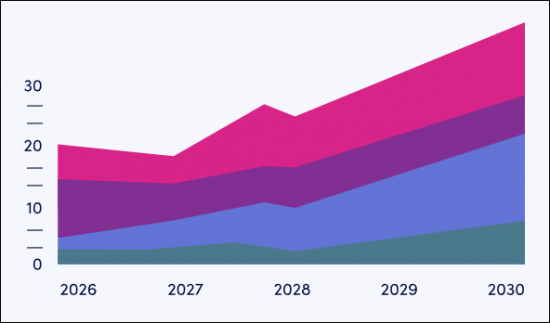
"到 2030 年,非接觸式支付市場規模將翻一番,達到 18.1 兆美元 - NFC 票務的推出推動成長"
| 主要統計 | |
|---|---|
| 2025年的整體交易額: | 8兆7,500億美元 |
| 2030年的整體交易額: | 18兆1,000億美元 |
| 從2025年~2030年的市場成長率: | 106.9% |
| 預測期間: | 2025-2030年 |
本報告提供全面的市場數據,包括採用非接觸式支付技術的行動錢包的普及率、非接觸式交易的成長及其相關價值。該數據套件包含一整套預測數據,包含 139 個表格和超過 60,000 個數據點,以及一份分析成長原因的隨附報告。研究套件中包含的指標包括:
- 非接觸式支付用戶數量
- 非接觸式支付交易總額
- 年度非接觸式支付交易總額
所有報告內容均提供英文版本。
主要的特徵:
這些指標按以下主要細分領域分類:
- 非接觸式卡
- 行動支付
- Apple Pay
- Google Pay
- Samsung Pay
- 其他OEM支付
- 穿戴式裝置支付
- 非接觸式票務支付
預測資料還包括非接觸式標記化和非接觸式ATM的市場規模。
資料與互動式預測
互動式預測(Excel)包含以下功能:
- 統計分析:您可以搜尋資料期間所有地區和國家顯示的特定指標。圖表可以輕鬆修改並匯出到剪貼簿。
- 國家/地區資料工具:您可以查看預測期間內所有地區和國家的指標。您可以使用搜尋欄縮小顯示的指標範圍。
- 國家比較工具:您可以選擇特定的國家進行比較。此工具包含匯出圖表的功能。
- 假設分析:五個互動式場景允許使用者比較預測假設。
樣品view
市場資料&預測報告
目錄
第1章 簡介
- 非接觸式支付的主要趨勢和發展
- 非接觸式支付是預設選擇
- A2A非接觸式支付在門市擴展
- Soft POS為非接觸式支付開闢新市場
- 跨境二維碼支付方案推動東南亞非接觸式支付發展亞洲
- 生物辨識身分驗證是非接觸式支付的下一代發展方向
- QR編碼付款
- i.優勢
- ii.弱點
- NFC
- i.優勢
- ii.弱點
- 結論
第2章 調查手法與前提
第3章 預測的摘要
- 非接觸付款的利用預測
- 非接觸機制:卡,行動,穿戴式
- 非接觸付款所使用的行動裝置的數
- 非接觸交易數量:零售付款及票務
- 非接觸交易額:零售付款及票務
第4章 非接觸卡片付款
- 非接觸卡的利用預測
- 非接觸支付卡的使用情形
- 非接觸卡交易預測
- 整體交易數量
- 整體交易額
第5章 行動非接觸付款
- 非接觸行動的利用預測
- 非接觸付款所使用的NFC支援終端
- OEM Pay非接觸用戶數
- 非接觸行動零售付款交易數量
- 非接觸行動零售付款交易額
第6章 穿戴式非接觸付款
- 智慧穿戴式非接觸付款的利用預測
- 非接觸付款實現的穿戴式
- 智慧穿戴式非接觸付款交易數量
- 智慧穿戴式非接觸付款交易額
第7章 NFC票
- NFC票利用預測
- NFC票用戶
- NFC票交易數量
- NFC票交易額
第8章 非接觸權標化
- 非接觸權標化的預測
- 非接觸權標化的數量
- 非接觸權標化的收益
第9章 非接觸ATM
- 非接觸ATM預測
- 非接觸ATM的運作情形
'Contactless Payment Value to Double by 2030, Reaching $18.1 Trillion, Accelerated by NFC Ticketing Roll-outs'
| KEY STATISTICS | |
|---|---|
| Total transaction value in 2025: | $8.75tn |
| Total transaction value in 2030: | $18.1tn |
| 2025 to 2030 market growth: | 106.9% |
| Forecast period: | 2025-2030 |
Overview
Our "Contactless Payments" market analysis provides exhaustive data coverage of the market in its entirety, including the adoption of mobile wallets featuring contactless payment technology, the growth of contactless transactions and its associated values. The data suite includes access to the full set of forecast data of 139 tables and over 60,000 datapoints, as well as an accompanying report analysing the reasons for growth. The metrics comprised in the research suite include:
- The number of users of contactless payments
- The total transaction value of contactless payments
- The total volume of contactless payments made annually.
All report content is delivered in the English language.
Key Features
These metrics are split by the following key segments:
- Contactless Cards
- Mobile Payments, further split by:
- Apple Pay
- Google Pay
- Samsung Pay
- Other Original Equipment Manufacturer (OEM) Pay
- Wearable Payments
- Contactless Ticketing Payments
The forecast data also includes market sizing for contactless tokenisation and contactless-enabled ATMs.
The data itself is accompanied by a Data & Forecasting report; analysing the main drivers of growth across key forecast metrics, as well as explaining the fundamental methodology and assumptions involved. Taken together, the research is a vital tool for sizing the contactless payments market.
Data & Interactive Forecast
Juniper Research's Interactive Forecast Excel contains the following functionality:
- Statistics Analysis: Users benefit from the ability to search for specific metrics, displayed for all regions and countries across the data period. Graphs are easily modified and can be exported to the clipboard.
- Country Data Tool: This tool lets users look at metrics for all regions and countries in the forecast period. Users can refine the metrics displayed via a search bar.
- Country Comparison Tool: Users can select and compare specific countries. The ability to export graphs is included in this tool.
- What-if Analysis: Here, users can compare forecast metrics against their own assumptions, via 5 interactive scenarios.
SAMPLE VIEW
Market Data & Forecasting Report
The numbers tell you what's happening, but our written report details why, alongside the methodologies.
Table of Contents
1. Introduction
- 1.1. Introduction
- 1.2. Key Trends & Developments Within Contactless Payments
- 1.2.1. Contactless Payments Are the Default Choice
- 1.2.2. Expansion of A2A Contactless Payments In-store
- Figure 1.1: Google Pay UPI Tap & Pay Methods
- 1.2.3. Soft POS Is Opening New Markets for Contactless
- Figure 1.2: How to Use Soft POS
- Figure 1.3: Tap to Pay on iPhone
- 1.2.4. Cross-border QR Code Payment Schemes Will Boost Contactless Payments in Southeast Asia
- Figure 1.4: Prominent Advances in Cross-border QR Code Schemes in 2025: Southeast Asia
- 1.2.5. Biometrics as the Next Evolution of Contactless Payments
- 1.2.6. QR Code Payments
- i. Strengths
- ii. Weaknesses
- Figure 1.5: QR Codes - Strengths & Weaknesses
- 1.2.7. NFC
- i. Strengths
- ii. Weaknesses
- Figure 1.6: NFC - Strengths & Weaknesses
- 1.2.8. Conclusion
2. Methodology & Assumptions
- 2.1. Methodology & Assumptions
- Figure 2.1: Contactless Cards Forecast Methodology
- Figure 2.2: NFC Mobile & Wearable Retail Payments Market Forecast Methodology
- Figure 2.3: NFC Mobile Ticketing Forecast Methodology
- Figure 2.4: Contactless Mobile Payment Tokenisation Methodology
3. Forecast Summary
- 3.1. Contactless Payments Usage Forecasts
- 3.1.1. Contactless Mechanisms: Cards, Mobiles and Wearables
- Figure & Table 3.1: Number of Contactless Devices or Cards in Use for Payments (m), Split by Payment Mechanism, 2025-2030
- 3.1.2. Number of Mobile Devices Used for Contactless Payments
- Figure & Table 3.2: Number of Mobile Devices Used for Contactless Payments (m), Split by Payment Provider, 2025-2030
- 3.1.3. Total Contactless Transaction Volume: Retail Payments & Ticketing
- Figure 3.3: Total Number of Contactless Transactions (m), Split by Retail Payments & Ticketing, 2025-2030
- 3.1.4. Total Contactless Transaction Value: Retail Payments & Ticketing
- Figure & Table 3.4: Total Contactless Transaction Value ($m), Split by Retail Payments & Ticketing, 2025-2030
- 3.1.1. Contactless Mechanisms: Cards, Mobiles and Wearables
4. Contactless Card Payments
- 4.1. Contactless Cards Usage Forecasts
- 4.1.1. Contactless Payment Cards in Use
- Figure & Table 4.1: Number of Contactless Payment Cards Used for Contactless Payment (m), Split by 8 Key Regions, 2025-2030
- 4.1.1. Contactless Payment Cards in Use
- 4.2. Contactless Cards Transaction Forecasts
- 4.2.1. Total Transaction Volume
- Figure & Table 4.2: Total Number of Contactless Card Transactions per annum (m), Split by 8 Key Regions, 2025-2030
- 4.2.2. Total Transaction Value
- Figure & Table 4.3: Total Value of Contactless Card Transactions per annum ($m), Split by 8 Key Regions, 2025-2030
- 4.2.1. Total Transaction Volume
5. Mobile Contactless Payments
- 5.1. Contactless Mobile Usage Forecast
- 5.1.1. NFC-enabled Handsets in Use for Contactless Payments
- Figure & Table 5.1: Number of NFC-enabled Handsets (including FeliCa) Using Contactless Payments (m), Split by 8 Key Regions, 2025-2030
- 5.1.2. Number of OEM Pay Contactless Users
- Figure & Table 5.2: Number of OEM Pay Contactless Users (m), Split by Apple Pay, Samsung Pay, Google Pay & Other OEM Pay, 2025-2030
- 5.1.3. Contactless Mobile Retail Payment Transactions Volume
- Figure & Table 5.3: Total Contactless Mobile Retail Payments Transaction Volume per annum (m), Split by 8 Key Regions, 2025-2030
- 5.1.4. Contactless Mobile Retail Payment Transaction Value
- Figure & Table 5.4: Total Value of NFC Retail Payments Transactions ($m), Split by 8 Key Regions, 2025-2030
- 5.1.1. NFC-enabled Handsets in Use for Contactless Payments
6. Wearable Contactless Payments
- 6.1. Smart Wearables Contactless Payment Usage Forecasts
- 6.1.1. Wearables Making Contactless Payments
- Figure & Table 6.1: Number of Active Smart Wearable Devices Making Contactless Payments per annum (m), Split by 8 Key Regions, 2025-2030
- 6.1.2. Smart Wearables Contactless Payment Transaction Volume
- Figure & Table 6.2: Smart Wearable Contactless Payment Transaction Volume per annum (m), Split by 8 Key Regions, 2025-2030
- 6.1.3. Smart Wearable Contactless Payment Transaction Value
- Figure & Table 6.3: Total Smart Wearable Contactless Payment Transaction Value ($m), Split by 8 Key Regions, 2025-2030
- 6.1.1. Wearables Making Contactless Payments
7. NFC Ticketing
- 7.1. NFC Ticketing Usage Forecasts
- 7.1.1. NFC Ticketing Users
- Figure & Table 7.1: Mobile Phone Users Who Use NFC Ticketing (m), Split by 8 Key Regions, 2025-2030
- 7.1.2. NFC Ticketing Transaction Volume
- Figure & Table 7.2: Transaction Volume of NFC Tickets Delivered or Validated (m), Split by 8 Key Regions, 2025-2030
- 7.1.3. NFC Ticketing Transaction Value
- Figure & Table 7.3: Total Transaction Value for NFC Tickets Purchased or Validated per annum ($m), Split by 8 Key Regions, 2025-2030
- 7.1.1. NFC Ticketing Users
8. Contactless Tokenisation
- 8.1. Contactless Tokenisation Forecasts
- 8.1.1. Contactless Tokenisation Volume
- Figure & Table 8.1: Number of Contactless Payments That Are Tokenised per annum (m), Split by 8 Key Regions, 2025-2030
- 8.1.2. Contactless Tokenisation Revenue
- Figure &Table 8.2: Contactless Tokenisation Revenue per annum ($m), Split by Key Regions, 2025-2030
- 8.1.1. Contactless Tokenisation Volume
9. Contactless ATMs
- 9.1. Contactless ATM Forecasts
- 9.1.1. Contactless ATMs in Use
- Figure & Table 9.1: Number of Contactless-enabled ATMs, Split by 8 Key Regions, 2025-2030
- 9.1.1. Contactless ATMs in Use
 Android Tap To Pay 市場規模、佔有率和成長分析:按服務產品、商家類型、最終用戶產業、支付類型、部署模式、銷售管道和地區分類-2026-2033 年產業預測
 非接觸式支付技術市場預測至2034年-全球設備類型、技術、組件、支付方式、應用、最終用戶和區域分析
 2026年全球數據尊嚴支付市場報告
 非接觸式支付市場:按設備、組件、行業和地區分類
 非接觸式支付市場規模、佔有率、趨勢和預測:按技術、設備、解決方案、應用和地區分類,2026-2034 年2026年Android非接觸式支付全球市場報告
 非接觸式支付市場:按技術、終端、終端用戶和應用分類-2026-2032年全球市場預測工業PDA市場:按類型、作業系統、連接方式、分銷管道、應用和最終用戶分類,全球預測,2026-2032年
 行動NFC支付市場分析及預測(至2035年):依類型、產品類型、服務、技術、組件、應用、設備、部署模式、最終用戶及功能分類非接觸式支付市場分析及預測(至2035年):依類型、產品類型、服務、技術、組件、應用、設備、部署模式及最終用戶分類