


 |
市場調查報告書
商品編碼
2109308
2026 年至 2035 年糖果甜點配料市場的商業機會、成長要素、產業趨勢分析與預測。Confectionery Ingredients Market Opportunity, Growth Drivers, Industry Trend Analysis, and Forecast 2026 - 2035 |
||||||

預計到 2025 年,全球糖果甜點原料市場價值將達到 922 億美元,並將以 3.9% 的複合年成長率成長,到 2035 年達到 1,350 億美元。
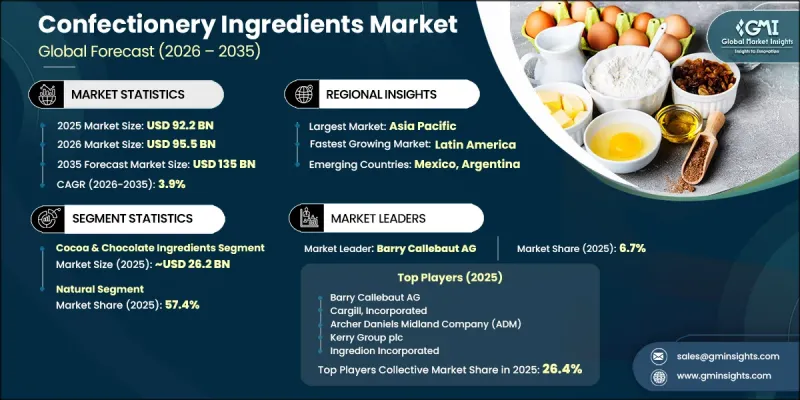
消費者對優質、手工和高品質糖果甜點產品的日益偏好,正推動全球市場對先進配料解決方案的持續需求。製造商擴大採用優質原料、天然成分和特殊配方,以提升產品品質並滿足不斷變化的消費者期望。影響糖果甜點配料市場最顯著的結構性變化之一,是從人工色素、人工香精、乳化劑和人工甜味劑轉向天然替代品。這項轉變正在重塑產品開發策略,並推動整個產業的配料創新。同時,利用人工智慧 (AI) 和機器學習的數位技術正在革新配料配方,加速產品開發,提高配方精度,並最佳化感官特性。這些先進的開發平台使製造商能夠更有效率地評估食材組合,顯著縮短開發週期,同時提高產品品質的一致性。隨著對「潔淨標示」產品、優質配料和創新糖果甜點配方的需求持續成長,預計糖果甜點配料市場將在預測期內保持穩定成長。
| 市場範圍 | |
|---|---|
| 開始年份 | 2025 |
| 預測期 | 2026-2035 |
| 初始市場規模 | 922億美元 |
| 預測金額 | 1350億美元 |
| 複合年成長率 | 3.9% |
預計到2025年,可可和巧克力配料市場佔有率將達到28.4%,銷售額將達到262億美元。預計到2035年,該細分市場將以3.8%的複合年成長率成長。由於工業規模和手工糖果甜點生產對可可基配料的需求強勁,該細分市場將繼續保持領先地位。甜味劑仍然是第二大配料類別,製造商擴大採用替代甜味劑舉措來支持產品改進計劃。牛奶和乳製品配料在高階糖果甜點應用中仍然至關重要,高品質的配料在產品差異化方面繼續發揮關鍵作用。
到2025年,天然成分市佔率將達到57.4%。隨著製造商積極回應消費者對潔淨標示產品、永續性目標以及不斷變化的監管要求的偏好,對天然成分的需求持續成長。這一行業趨勢進一步推動了對加工最少、發酵和天然成分的採用。植物來源的乳化劑、天然色素和植物甜味劑正日益取代合成替代品,進一步促進了配方向更天然成分方向的長期轉變。
預計到2025年,北美糖果甜點原料市佔率將達到21.5%。該地區市場成長的主要驅動力是消費者對潔淨標示原料配方的需求不斷成長,以及糖果甜點供應鏈中採購標準日益嚴格。製造商正在拓展其高級產品線,以滿足不斷變化的消費者偏好,同時更加重視天然來源、可追溯和永續採購的原料。這種對產品透明度和原料品質的持續關注預計將推動全部區域市場的穩定發展。
目錄
第1章:調查方法和範圍
第2章執行摘要
第3章 行業洞察
- 產業生態系分析
- 供應商情況
- 利潤率
- 每個階段增加的價值
- 影響價值鏈的因素
- 中斷
- 影響產業的因素
- 促進因素
- 產業潛在風險與挑戰
- 市場機遇
- 成長潛力分析
- 監理情勢
- 波特的分析
- PESTLE分析
- 價格趨勢
- 按地區
- 依成分類型
- 未來市場趨勢
- 技術與創新展望
- 最新科技趨勢
- 新興技術
- 專利趨勢
- 貿易統計
- 主要進口國
- 主要出口國
- 永續性和環境方面
- 永續計劃
- 減少廢棄物策略
- 生產中的能源效率
- 具有環保意識的舉措
- 考慮碳足跡
第4章 競爭情勢
- 介紹
- 企業市佔率分析
- 按地區
- 北美洲
- 歐洲
- 亞太地區
- LATAM
- 中東和非洲
- 按地區
- 主要市場公司的競爭分析
- 競爭定位矩陣
- 主要進展
- 併購
- 夥伴關係和聯盟
- 新產品發布
- 業務拓展計劃
第5章 市場估算與預測:依原料類型分類,2022-2035年
- 可可和巧克力原料
- 乳製品原料
- 甜味劑
- 乳化劑、穩定劑和親水膠體
- 油脂和起酥油
- 調味劑/色素
- 麥芽和穀物原料
- 堅果和水果
- 其他
第6章 市場估算與預測:依供應來源分類,2022-2035年
- 自然的
- 合成
第7章 市場估計與預測:依類型分類,2022-2035年
- 乾粉
- 液體
- 凝膠/膏狀
第8章 市場估計與預測:依應用領域分類,2022-2035年
- 巧克力糖果甜點
- 黑巧克力
- 牛奶巧克力
- 白巧克力和紅寶石巧克力
- 含有複雜餡料的巧克力產品
- 糖果甜點
- 硬糖和棒棒糖
- 焦糖、太妃糖、軟糖
- 棉花糖、翻糖、牛軋糖
- 麵包糖果甜點
- 巧克力餡和巧克力塗層的糕點
- 奶油餡餅乾、曲奇、威化餅
- 糖果甜點裝飾和糖果釉料
- 口香糖和果凍糖果甜點
- 口香糖和泡泡糖
- 軟糖和軟果凍
- 果膠基和明膠基糖果甜點
- 其他
第9章 市場估計與預測:依地區分類,2022-2035年
- 北美洲
- 美國
- 加拿大
- 歐洲
- 德國
- 英國
- 法國
- 西班牙
- 義大利
- 其他歐洲國家
- 亞太地區
- 中國
- 印度
- 日本
- 澳洲
- 韓國
- 其他亞太國家
- 拉丁美洲
- 巴西
- 墨西哥
- 阿根廷
- 其他拉丁美洲國家
- 中東和非洲
- 沙烏地阿拉伯
- 南非
- UAE
- 其他中東和非洲國家
第10章:公司簡介
- Archer Daniels Midland Company(ADM)
- Balchem Corporation
- Barry Callebaut AG
- Cargill, Incorporated
- Corbion NV
- DSM-Firmenich AG
- Ingredion Incorporated
- Kerry Group plc
- Natra SA
- Olam Food Ingredients(OFI)
- Prova SAS
- Puratos Group
- Sensient Technologies Corporation
- Tate & Lyle PLC
The Global Confectionery Ingredients Market was valued at USD 92.2 billion in 2025 and is estimated to grow at a CAGR of 3.9% to reach USD 135 billion by 2035.
Rising consumer preference for premium, artisanal, and high-quality confectionery products is driving steady demand for advanced ingredient solutions across global markets. Manufacturers are increasingly utilizing premium raw materials, naturally derived ingredients, and specialty formulations to enhance product quality and meet evolving consumer expectations. One of the most significant structural shifts influencing the confectionery ingredients market is the growing replacement of artificial colors, flavors, emulsifiers, and sweeteners with naturally sourced alternatives. This transition is reshaping product development strategies and encouraging ingredient innovation across the industry. At the same time, digital technologies powered by artificial intelligence and machine learning are transforming ingredient formulation by accelerating product development, improving formulation precision, and enhancing sensory optimization. These advanced development platforms enable manufacturers to evaluate ingredient combinations more efficiently, significantly reducing development timelines while improving product consistency. As demand for clean-label products, premium ingredients, and innovative confectionery formulations continues to increase, the confectionery ingredients market is expected to maintain stable growth throughout the forecast period.
| Market Scope | |
|---|---|
| Start Year | 2025 |
| Forecast Year | 2026-2035 |
| Start Value | $92.2 Billion |
| Forecast Value | $135 Billion |
| CAGR | 3.9% |
The cocoa and chocolate ingredients segment accounted for a 28.4% share in 2025, generating USD 26.2 billion, and is expected to grow at a CAGR of 3.8% through 2035. The segment continues to dominate due to consistent demand for cocoa-based ingredients across both industrial-scale and artisanal confectionery production. Sweeteners remain the second-largest ingredient category, with manufacturers increasingly incorporating alternative sweetening solutions to support product reformulation initiatives. Milk and dairy ingredients also remain essential for premium confectionery applications, where high-quality raw materials continue to play a critical role in product differentiation.
The natural ingredients segment held a 57.4% share in 2025. Demand for naturally sourced ingredients continues to accelerate as manufacturers respond to consumer preferences for clean-label products, sustainability objectives, and evolving regulatory expectations. This industry-wide transition is driving greater adoption of minimally processed, fermentation-derived, and naturally sourced ingredients. Plant-based emulsifiers, natural color solutions, and botanical sweeteners are increasingly replacing synthetic alternatives, reinforcing the long-term shift toward more natural ingredient formulations.
North America Confectionery Ingredients Market accounted for 21.5% share in 2025. Market growth across the region is primarily supported by increasing demand for clean-label ingredient formulations and stricter sourcing standards throughout the confectionery supply chain. Manufacturers are placing greater emphasis on natural, traceable, and sustainably sourced ingredients while expanding premium product offerings to meet changing consumer preferences. Continued focus on product transparency and ingredient quality is expected to support steady market development across the region.
Key players operating in the global confectionery ingredients market include Archer Daniels Midland Company (ADM), Balchem Corporation, Barry Callebaut AG, Cargill, Incorporated, Corbion N.V., DSM-Firmenich AG, Ingredion Incorporated, Kerry Group plc, Natra S.A., Olam Food Ingredients (OFI), Prova SAS, Puratos Group, Sensient Technologies Corporation, and Tate & Lyle PLC. Companies operating in the confectionery ingredients market are strengthening their competitive position by expanding premium ingredient portfolios, investing in research and development, and introducing innovative clean-label solutions that align with evolving consumer preferences. Manufacturers are increasing investments in natural ingredients, sustainable sourcing programs, and advanced formulation technologies to improve product quality and accelerate innovation. Strategic collaborations with food manufacturers, ingredient suppliers, and distribution partners are helping companies broaden market reach and strengthen customer relationships. Businesses are also enhancing production capabilities, improving supply chain efficiency, and developing customized ingredient solutions tailored to changing formulation requirements.
Table of Contents
Chapter 1 Methodology & Scope
- 1.1 Research approach
- 1.2 Quality Commitments
- 1.2.1 GMI AI policy & data integrity commitment
- 1.2.1.1 Source consistency protocol
- 1.2.1 GMI AI policy & data integrity commitment
- 1.3 Research Trail & Confidence Scoring
- 1.3.1 Research Trail Components
- 1.3.2 Scoring Components
- 1.4 Data Collection
- 1.4.1 Partial list of primary sources
- 1.5 Data mining sources
- 1.5.1 Paid sources
- 1.5.1.1 Sources, by region
- 1.5.1 Paid sources
- 1.6 Base estimates and calculations
- 1.6.1 Base year calculation for any one approach
- 1.7 Forecast model
- 1.7.1 Quantified market impact analysis
- 1.7.1.1 Mathematical impact of growth parameters on forecast
- 1.7.1 Quantified market impact analysis
- 1.8 Research transparency addendum
- 1.8.1 Source attribution framework
- 1.8.2 Quality assurance metrics
- 1.8.3 Our commitment to trust
Chapter 2 Executive Summary
- 2.1 Industry 360° synopsis
- 2.2 Key market trends
- 2.2.1 Regional
- 2.2.2 Ingredient type
- 2.2.3 Source
- 2.2.4 Form
- 2.2.5 Application
Chapter 3 Industry Insights
- 3.1 Industry ecosystem analysis
- 3.1.1 Supplier landscape
- 3.1.2 Profit margin
- 3.1.3 Value addition at each stage
- 3.1.4 Factor affecting the value chain
- 3.1.5 Disruptions
- 3.2 Industry impact forces
- 3.2.1 Growth drivers
- 3.2.2 Industry pitfalls and challenges
- 3.2.3 Market opportunities
- 3.3 Growth potential analysis
- 3.4 Regulatory landscape
- 3.4.1 North America
- 3.4.2 Europe
- 3.4.3 Asia Pacific
- 3.4.4 Latin America
- 3.4.5 Middle East & Africa
- 3.5 Porter’s analysis
- 3.6 PESTEL analysis
- 3.7 Price trends
- 3.7.1 By region
- 3.7.2 By ingredient type
- 3.8 Future market trends
- 3.9 Technology and innovation landscape
- 3.9.1 Current technological trends
- 3.9.2 Emerging technologies
- 3.10 Patent Landscape
- 3.11 Trade statistics (HS code)
- 3.11.1 Major importing countries
- 3.11.2 Major exporting countries
- 3.12 Sustainability and environmental aspects
- 3.12.1 Sustainable practices
- 3.12.2 Waste reduction strategies
- 3.12.3 Energy efficiency in production
- 3.12.4 Eco-friendly initiatives
- 3.13 Carbon footprint consideration
Chapter 4 Competitive Landscape, 2025
- 4.1 Introduction
- 4.2 Company market share analysis
- 4.2.1 By region
- 4.2.1.1 North America
- 4.2.1.2 Europe
- 4.2.1.3 Asia Pacific
- 4.2.1.4 LATAM
- 4.2.1.5 MEA
- 4.2.1 By region
- 4.3 Competitive analysis of major market players
- 4.4 Competitive positioning matrix
- 4.5 Key developments
- 4.5.1 Mergers & acquisitions
- 4.5.2 Partnerships & collaborations
- 4.5.3 New Product Launches
- 4.5.4 Expansion Plans
Chapter 5 Market Estimates and Forecast, By Ingredient Type, 2022–2035 (USD Billion) (Kilo Tons)
- 5.1 Key trends
- 5.2 Cocoa & chocolate ingredients
- 5.3 Dairy ingredients
- 5.4 Sweeteners
- 5.5 Emulsifiers, stabilizers & hydrocolloids
- 5.6 Oils & shortenings
- 5.7 Flavors & colors
- 5.8 Malts & cereal ingredients
- 5.9 Nuts & fruits
- 5.10 Others
Chapter 6 Market Estimates and Forecast, By Source, 2022–2035 (USD Billion) (Kilo Tons)
- 6.1 Key trends
- 6.2 Natural
- 6.3 Synthetic
Chapter 7 Market Estimates and Forecast, By Form, 2022–2035 (USD Billion) (Kilo Tons)
- 7.1 Key trends
- 7.2 Dry/powder
- 7.3 Liquid
- 7.4 Gel/paste
Chapter 8 Market Estimates and Forecast, By Application, 2022–2035 (USD Billion) (Kilo Tons)
- 8.1 Key trends
- 8.2 Chocolate confectionery
- 8.2.1 Dark chocolate
- 8.2.2 Milk chocolate
- 8.2.3 White & ruby chocolate
- 8.2.4 Compound & filled chocolate products
- 8.3 Sugar confectionery
- 8.3.1 Hard candies & lollipops
- 8.3.2 Caramels, toffees & fudge
- 8.3.3 Marshmallows, fondants & nougat
- 8.4 Bakery confectionery
- 8.4.1 Chocolate-filled & enrobed pastries
- 8.4.2 Cream-filled cookies, biscuits & wafers
- 8.4.3 Confectionery cake decorations & glazing coatings
- 8.5 Chewing gum & jelly confectionery
- 8.5.1 Chewing gum & bubble gum
- 8.5.2 Gummy candies & soft jellies
- 8.5.3 Pectin-based & gelatin-based confections
- 8.6 Others
Chapter 9 Market Estimates and Forecast, By Region, 2022–2035 (USD Billion) (Kilo Tons)
- 9.1 Key trends
- 9.2 North America
- 9.2.1 U.S.
- 9.2.2 Canada
- 9.3 Europe
- 9.3.1 Germany
- 9.3.2 UK
- 9.3.3 France
- 9.3.4 Spain
- 9.3.5 Italy
- 9.3.6 Rest of Europe
- 9.4 Asia Pacific
- 9.4.1 China
- 9.4.2 India
- 9.4.3 Japan
- 9.4.4 Australia
- 9.4.5 South Korea
- 9.4.6 Rest of Asia Pacific
- 9.5 Latin America
- 9.5.1 Brazil
- 9.5.2 Mexico
- 9.5.3 Argentina
- 9.5.4 Rest of Latin America
- 9.6 Middle East and Africa
- 9.6.1 Saudi Arabia
- 9.6.2 South Africa
- 9.6.3 UAE
- 9.6.4 Rest of Middle East and Africa
Chapter 10 Company Profiles
- 10.1 Archer Daniels Midland Company (ADM)
- 10.2 Balchem Corporation
- 10.3 Barry Callebaut AG
- 10.4 Cargill, Incorporated
- 10.5 Corbion N.V.
- 10.6 DSM-Firmenich AG
- 10.7 Ingredion Incorporated
- 10.8 Kerry Group plc
- 10.9 Natra S.A.
- 10.10 Olam Food Ingredients (OFI)
- 10.11 Prova SAS
- 10.12 Puratos Group
- 10.13 Sensient Technologies Corporation
- 10.14 Tate & Lyle PLC


