


 |
市場調查報告書
商品編碼
2101956
固定式起重機市場商機、成長要素、產業趨勢分析及2026-2035年預測Fixed Crane Market Opportunity, Growth Drivers, Industry Trend Analysis, and Forecast 2026 - 2035 |
||||||

預計到 2025 年,全球固定式起重機市場規模將達到 104 億美元,年複合成長率為 5.7%,到 2035 年將達到 181 億美元。
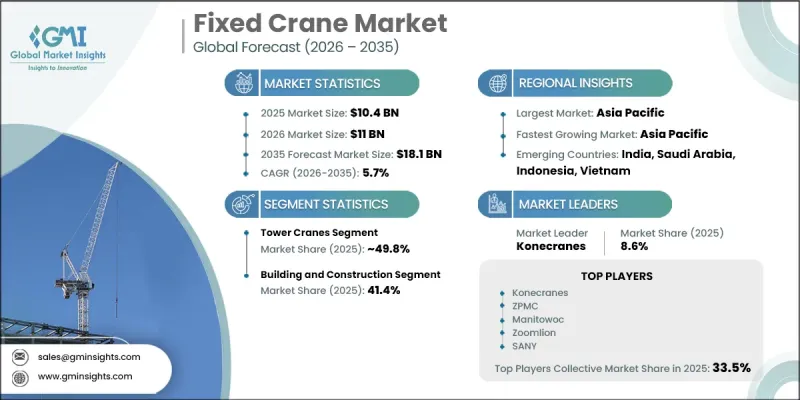
市場成長主要受大規模基礎設施建設投資增加、工業建設活動擴張以及商業、住宅和工業項目整體高承載能力起重設備需求不斷成長的推動。快速的都市化和大都會圈持續擴張,使得能夠處理複雜施工和物料輸送需求的固定式起重機需求持續旺盛。同時,對交通網路、工業設施、能源基礎設施和物流樞紐的持續投資,正在加速已開發市場和新興市場的設備部署。數位化技術、自動化和預測性維護解決方案的日益普及,也透過提高設備可靠性、減少停機時間和提升營運效率,正在改變起重機的運作方式。此外,製造商正在部署技術先進的起重機系統,這些系統具有更強的監控能力和更高的起重精度,以滿足不斷變化的客戶需求。製造設施和施工方法的持續現代化預計將為固定式起重機製造商提供長期發展機遇,並在整個預測期內支持市場的穩步擴張。
| 市場範圍 | |
|---|---|
| 開始年份 | 2025 |
| 預測期 | 2026-2035 |
| 上市時的市場規模 | 104億美元 |
| 預測金額 | 181億美元 |
| 複合年成長率 | 5.7% |
塔式起重機市佔率佔49.8%,預計到2025年市場規模將達到51.8億美元。塔式起重機仍然是全球高層住宅、商業和基礎設施建設的首選起重解決方案,因此在該領域保持主導地位。其在高空高效吊裝重物的能力使其被廣泛應用於大規模建設項目。預計在整個預測期內,城市發展和商業建設的持續投資將維持對塔式起重機安裝的強勁需求。
預計到2025年,建築和施工領域將佔據41.4%的市場佔有率,達到43億美元,並在2035年之前保持5.5%的複合年成長率。該領域的主導地位反映了固定式起重機在大型開發案中支撐多層建築、結構組裝和物料輸送的關鍵作用。住宅、商業、工業和基礎設施領域的建設活動持續成長,不斷推高對固定式起重機解決方案的需求,這些解決方案能夠提高專案效率並縮短工期。
美國固定式起重機市場預計到2025年將達到16.6億美元,並在2035年之前以5.5%的複合年成長率成長。市場成長的驅動力主要來自基礎設施現代化、工業設施擴建、交通網路發展以及可再生能源相關建設的持續投資。強勁的建設活動,加上各終端用戶產業對先進起重設備的日益普及,進一步鞏固了美國在全球固定式起重機市場的主導地位。
目錄
第1章:調查方法和範圍
第2章執行摘要
第3章 行業洞察
- 產業生態系分析
- 供應商情況
- 原物料供應商
- 零件供應商
- 製造商
- 服務供應商
- 分銷管道
- 最終用途
- 成本結構
- 利潤率
- 每個階段增加的價值
- 垂直整合趨勢
- 顛覆者
- 供應商情況
- 影響產業的因素
- 促進因素
- 全球基礎建設投資與城市建設活動
- 港口基礎設施現代化和海上貿易擴張
- 工業自動化與工業4.0的融合
- 對可再生能源領域的資本投資
- 產業潛在風險與挑戰
- 巨額資本投資和資金籌措限制
- 熟練操作人員和維護人員短缺
- 監理複雜性和安全合規成本
- 市場機遇
- 智慧製造設施的擴建
- 海上能源和海洋基礎設施的成長
- 工業設施現代化
- 促進因素
- 成長潛力分析
- 技術與創新展望
- 最新技術
- 新興技術
- 價格分析
- 對過去價格趨勢的分析
- 依球員類型分類的定價策略(高級球員、超值球員、成本加成球員)
- 監理情勢
- 北美洲
- 起重機和吊運設備的 OSHA 標準
- ASME B30.5 - 移動式和機車起重機
- NCCCO起重機操作員認證
- CSA Z150 - 移動式起重機安全標準
- 歐洲
- 歐盟機械法規
- 歐盟第五階段排放氣體標準
- EN 13000 - 起重機安全標準
- LOLER-起重設備相關法規
- 亞太地區
- GB/T 14560 - 行動起重機安全標準(中國)
- CCMA起重機型式認可(中國)
- JCMA安全標準(日本)
- DGFASLI起重機安全規章(印度)
- AS 2550.5 - 起重機操作安全(澳洲)
- 拉丁美洲
- NR-11 和 NR-12 機械安全法規(巴西)
- NOM-009-STPS 起重設備法規(墨西哥)
- 中東和非洲
- OSHAD起重作業規格(阿拉伯聯合大公國)
- 沙烏地阿美公司起重設備標準
- 南非起重機相關法規 (SANS)
- 北美洲
- 波特的分析
- PESTLE分析
- 專利分析
- 貿易數據分析
- 進出口量及進口額趨勢
- 主要貿易路線及關稅的影響
- 成本細分分析
- 人工智慧和生成式人工智慧對市場的影響
- 利用人工智慧改造現有經營模式
- 設計自動化最佳化
- 用於需求預測的供應鏈人工智慧
- 按細分市場分類的生成式人工智慧用例和部署藍圖
- 風險、限制和監管考量
- 生產能力和生產情況
- 設備產能:按地區和主要生產商分類
- 運轉率和擴張計劃
- 預測假設和情境分析
- 基本案例:驅動複合年成長率的關鍵宏觀經濟與產業變量
- 樂觀情境:宏觀經濟與產業的順風
- 悲觀情景:宏觀經濟放緩或產業逆風
第4章 競爭情勢
- 介紹
- 企業市佔率分析
- 北美洲
- 歐洲
- 亞太地區
- 拉丁美洲
- 中東和非洲
- 競爭定位矩陣
- 主要進展
- 併購
- 夥伴關係和聯盟
- 新產品發布
- 業務拓展計劃及資金籌措
- 按公司規模進行基準測試
- 排名分類標準與遴選標準
- 按銷售額、地區和創新能力分類的層級定位矩陣。
第5章 市場估計與預測:依類型分類,2022-2035年
- 塔式起重機
- 少於5噸
- 6-20噸
- 21-50噸
- 51-80噸
- 超過80噸
- 高架起重機
- 不到25噸
- 26噸至50噸
- 51噸至80噸
- 超過80噸
- 僵腿鶴
- 最大25噸
- 26噸至50噸
- 51噸至80噸
- 超過80噸
- 單軌起重機
- 最大25噸
- 26噸至50噸
- 51噸至80噸
- 超過80噸
第6章 市場估計與預測:依應用領域分類,2022-2035年
- 建築/施工
- 港口、物流、造船
- 工業生產和倉儲業
- 能源和採礦
- 其他
第7章 市場估計與預測:依最終用戶分類,2022-2035年
- 建設公司和房地產開發商
- 運輸、物流、港口營運商
- 工業製造公司
- 政府、地方當局和能源公共產業
- 起重機租賃公司
- 其他
第8章 市場估計與預測:依地區分類,2022-2035年
- 北美洲
- 美國
- 加拿大
- 歐洲
- 英國
- 德國
- 法國
- 義大利
- 西班牙
- 比利時
- 荷蘭
- 瑞典
- 俄羅斯
- 亞太地區
- 中國
- 印度
- 日本
- 澳洲
- 新加坡
- 韓國
- 越南
- 印尼
- 泰國
- 拉丁美洲
- 巴西
- 墨西哥
- 阿根廷
- 中東和非洲
- 南非
- 沙烏地阿拉伯
- UAE
- 土耳其
第9章:公司簡介
- 世界公司
- Konecranes
- Liebherr
- Manitowoc
- Palfinger
- SANY
- Tadano
- Terex
- XCMG
- Zoomlion
- ZPMC
- 當地公司
- ABUS Kransysteme
- GH Cranes & Components
- Henan Mine Crane
- KITO Crosby
- Nucleon Crane
- Street Crane
- Weihua
- 新興企業/顛覆者
- Bocker Maschinenwerke
- Maeda Seisakusho
- Sennebogen
The Global Fixed Cranes Market was valued at USD 10.4 billion in 2025 and is estimated to grow at a CAGR of 5.7% to reach USD 18.1 billion by 2035.
Market growth is supported by rising investments in large-scale infrastructure development, expanding industrial construction activities, and increasing demand for high-capacity lifting equipment across commercial, residential, and industrial projects. Rapid urbanization and continuous expansion of metropolitan areas are creating sustained demand for fixed cranes capable of supporting complex construction operations and material handling requirements. At the same time, ongoing investments in transportation networks, industrial facilities, energy infrastructure, and logistics hubs are strengthening equipment deployment across developed and emerging economies. The growing adoption of digital technologies, automation, and predictive maintenance solutions is also transforming crane operations by improving equipment reliability, minimizing downtime, and enhancing operational efficiency. In addition, manufacturers are introducing technologically advanced crane systems with enhanced monitoring capabilities and greater lifting precision to meet evolving customer requirements. The continued modernization of manufacturing facilities and construction practices is expected to generate long-term opportunities for fixed cranes manufacturers while supporting steady market expansion throughout the forecast period.
| Market Scope | |
|---|---|
| Start Year | 2025 |
| Forecast Year | 2026-2035 |
| Start Value | $10.4 Billion |
| Forecast Value | $18.1 Billion |
| CAGR | 5.7% |
The tower crane segment held 49.8% share, generating USD 5.18 billion in 2025. The segment continues to lead because tower cranes remain the preferred lifting solution for high-rise residential, commercial, and infrastructure developments worldwide. Their ability to efficiently handle heavy materials at significant heights supports widespread adoption across large construction projects. Continued investments in urban development and commercial construction are expected to sustain strong demand for tower crane installations throughout the forecast period.
The building and construction application segment accounted for 41.4% share in 2025, representing USD 4.30 billion, and is anticipated to grow at a CAGR of 5.5% through 2035. The segment's leadership reflects the critical role of fixed cranes in supporting multi-story construction, structural assembly, and material handling across large-scale development projects. Increasing construction activity in residential, commercial, industrial, and infrastructure sectors continues to create stable demand for fixed crane solutions capable of improving project efficiency and reducing construction timelines.
United States Fixed Cranes Market reached USD 1.66 billion in 2025 and is projected to grow at a CAGR of 5.5% through 2035. Market growth is supported by ongoing investments in infrastructure modernization, industrial facility expansion, transportation development, and renewable energy construction. Strong construction activity, combined with increasing adoption of advanced lifting equipment across multiple end-use industries, continues to reinforce the country's leading position within the global fixed crane market.
Major companies operating in the global fixed cranes market include: Liebherr, Konecranes, SANY, Manitowoc (Potain), ZPMC (Shanghai Zhenhua Heavy Industries), Zoomlion, and Weihua Group. Companies operating in the fixed cranes market are strengthening their market position through continuous investments in product innovation, automation technologies, and digital equipment management solutions. Manufacturers are expanding their portfolios with high-capacity, energy-efficient, and intelligent crane systems equipped with remote monitoring, predictive maintenance, and advanced safety features. Strategic collaborations with construction companies, industrial contractors, and equipment rental providers are helping businesses expand their customer base and secure long-term projects. Companies are also increasing investments in manufacturing capacity, regional service networks, and aftermarket support to improve customer satisfaction and equipment lifecycle performance.
Table of Contents
Chapter 1 Methodology & Scope
- 1.1 Research approach
- 1.2 Quality Commitments
- 1.2.1 GMI AI policy & data integrity commitment
- 1.2.1.1 Source consistency protocol
- 1.2.1 GMI AI policy & data integrity commitment
- 1.3 Research Trail & Confidence Scoring
- 1.3.1 Research Trail Components
- 1.3.2 Scoring Components
- 1.4 Data Collection
- 1.4.1 Partial list of primary sources
- 1.5 Data mining sources
- 1.5.1 Paid sources
- 1.5.1.1 Sources, by region
- 1.5.1 Paid sources
- 1.6 Base estimates and calculations
- 1.6.1 Base year calculation
- 1.7 Forecast model
- 1.7.1 Quantified market impact analysis
- 1.7.1.1 Mathematical impact of growth parameters on forecast
- 1.7.1 Quantified market impact analysis
- 1.8 Research transparency addendum
- 1.8.1 Source attribution framework
- 1.8.2 Quality assurance metrics
- 1.8.3 Our commitment to trust
Chapter 2 Executive Summary
- 2.1 Industry 360° synopsis
- 2.2 Key market trends
- 2.2.1 Type
- 2.2.2 Application
- 2.2.3 End-User
- 2.2.4 Region
- 2.3 TAM Analysis, 2026-2035
- 2.4 CXO perspectives: Strategic imperatives
Chapter 3 Industry Insights
- 3.1 Industry ecosystem analysis
- 3.1.1 Supplier landscape
- 3.1.1.1 Raw material suppliers
- 3.1.1.2 Component suppliers
- 3.1.1.3 Manufacturers
- 3.1.1.4 Service providers
- 3.1.1.5 Distribution channel
- 3.1.1.6 End Use
- 3.1.2 Cost structure
- 3.1.3 Profit margin
- 3.1.4 Value addition at each stage
- 3.1.5 Vertical integration trends
- 3.1.6 Disruptors
- 3.1.1 Supplier landscape
- 3.2 Industry impact forces
- 3.2.1 Growth drivers
- 3.2.1.1 Global Infrastructure Investment and Urban Construction Activity
- 3.2.1.2 Port Infrastructure Modernization and Maritime Trade Expansion
- 3.2.1.3 Industrial Automation and Industry 4.0 Integration
- 3.2.1.4 Renewable Energy Sector Capital Investment
- 3.2.2 Industry pitfalls & challenges
- 3.2.2.1 High Capital Expenditure and Financing Constraints
- 3.2.2.2 Skilled Operator and Maintenance Workforce Shortage
- 3.2.2.3 Regulatory Complexity and Safety Compliance Costs
- 3.2.3 Market opportunities
- 3.2.3.1 Expansion of Smart Manufacturing Facilities
- 3.2.3.2 Growth of Offshore Energy and Marine Infrastructure
- 3.2.3.3 Modernization of Industrial Facilities
- 3.2.1 Growth drivers
- 3.3 Growth potential analysis
- 3.4 Technology and Innovation landscape
- 3.4.1 Current technologies
- 3.4.2 Emerging technologies
- 3.5 Pricing Analysis (Driven by Primary Research)
- 3.5.1 Historical Price Trend Analysis
- 3.5.2 Pricing Strategy by Player Type (Premium / Value / Cost-plus)
- 3.6 Regulatory landscape
- 3.6.1 North America
- 3.6.1.1 OSHA Crane & Derrick Standards
- 3.6.1.2 ASME B30.5 - Mobile & Locomotive Cranes
- 3.6.1.3 NCCCO Crane Operator Certification
- 3.6.1.4 CSA Z150 - Safety Code on Mobile Cranes
- 3.6.2 Europe
- 3.6.2.1 EU Machinery Regulation
- 3.6.2.2 EU Stage V Emission Standards
- 3.6.2.3 EN 13000 - Crane Safety Standard
- 3.6.2.4 LOLER - Lifting Equipment Regulations
- 3.6.3 Asia-Pacific
- 3.6.3.1 GB/T 14560 - Mobile Crane Safety Standard (China)
- 3.6.3.2 CCMA Crane Type Certification (China)
- 3.6.3.3 JCMA Safety Standards (Japan)
- 3.6.3.4 DGFASLI Crane Safety Regulations (India)
- 3.6.3.5 AS 2550.5 - Cranes Safety in Use (Australia)
- 3.6.4 Latin America
- 3.6.4.1 NR-11 & NR-12 Machinery Safety Regulations (Brazil)
- 3.6.4.2 NOM-009-STPS Lifting Equipment Regulations (Mexico)
- 3.6.5 Middle East & Africa
- 3.6.5.1 OSHAD Lifting Operations Code (UAE)
- 3.6.5.2 Saudi Aramco Lifting Equipment Standards
- 3.6.5.3 South Africa Lifting Machinery Regulations (SANS)
- 3.6.1 North America
- 3.7 Porter's analysis
- 3.8 PESTEL analysis
- 3.9 Patent analysis (Driven by Primary Research)
- 3.10 Trade Data Analysis (Driven by paid database)
- 3.10.1 Import/export volume & value trends
- 3.10.2 Key trade corridors & tariff impact
- 3.11 Cost breakdown analysis
- 3.12 Impact of AI & generative AI on the market
- 3.12.1 AI-Driven Disruption of Existing Business Models
- 3.12.2 Automated design optimization
- 3.12.3 Supply chain AI for demand forecasting
- 3.12.4 GenAI use cases & adoption roadmap by segment
- 3.12.5 Risks, Limitations & Regulatory Considerations
- 3.13 Capacity & Production Landscape (Driven by Primary Research)
- 3.13.1 Installed Capacity by Region & Key Producer
- 3.13.2 Capacity Utilization Rates & Expansion Pipelines
- 3.14 Forecast assumptions & scenario analysis (Driven by Primary Research)
- 3.14.1 Base Case - key macro & industry variables driving CAGR
- 3.14.2 Optimistic Scenarios - Favorable Macro and Industry Tailwinds
- 3.14.3 Pessimistic Scenario - Macroeconomic slowdown or industry headwinds
Chapter 4 Competitive Landscape, 2025
- 4.1 Introduction
- 4.2 Company market share analysis
- 4.2.1 North America
- 4.2.2 Europe
- 4.2.3 Asia-Pacific
- 4.2.4 Latin America
- 4.2.5 Middle East & Africa
- 4.3 Competitive positioning matrix
- 4.4 Key developments
- 4.4.1 Mergers & acquisitions
- 4.4.2 Partnerships & collaborations
- 4.4.3 New product launches
- 4.4.4 Expansion plans and funding
- 4.5 Company tier benchmarking
- 4.5.1 Tier classification criteria & qualifying thresholds
- 4.5.2 Tier positioning matrix by revenue, geography & innovation
Chapter 5 Market Estimates & Forecast, By Type, 2022 - 2035 ($Mn, Units)
- 5.1 Key trends
- 5.2 Tower Crane
- 5.2.1 Below 5 Tons
- 5.2.2 6 to 20 Tons
- 5.2.3 21 to 50 Tons
- 5.2.4 51 to 80 Tons
- 5.2.5 Above 80 Tons
- 5.3 Gantry Crane
- 5.3.1 Below 25 Tons
- 5.3.2 26 Tons to 50 Tons
- 5.3.3 51 Tons to 80 Tons
- 5.3.4 Above 80 Tons
- 5.4 Stiffleg Crane
- 5.4.1 Up to 25 Tons
- 5.4.2 26 Tons to 50 Tons
- 5.4.3 51 Tons to 80 Tons
- 5.4.4 Above 80 Tons
- 5.5 Monorail Crane
- 5.5.1 Up to 25 Tons
- 5.5.2 26 Tons to 50 Tons
- 5.5.3 51 Tons to 80 Tons
- 5.5.4 Above 80 Tons
Chapter 6 Market Estimates & Forecast, By Application, 2022 - 2035 ($Mn, Units)
- 6.1 Key trends
- 6.2 Building & Construction
- 6.3 Port, Logistics & Shipbuilding
- 6.4 Industrial Manufacturing & Warehousing
- 6.5 Energy & Mining
- 6.6 Others
Chapter 7 Market Estimates & Forecast, By End-User, 2022 - 2035 ($Mn, Units)
- 7.1 Key trends
- 7.2 Construction Companies & Real Estate Developers
- 7.3 Transportation, Logistics & Port Operators
- 7.4 Industrial Manufacturing Enterprises
- 7.5 Government, Municipal & Energy Utilities
- 7.6 Crane Rental Companies
- 7.7 Others
Chapter 8 Market Estimates & Forecast, By Region, 2022 - 2035 ($Mn, Units)
- 8.1 North America
- 8.1.1 US
- 8.1.2 Canada
- 8.2 Europe
- 8.2.1 UK
- 8.2.2 Germany
- 8.2.3 France
- 8.2.4 Italy
- 8.2.5 Spain
- 8.2.6 Belgium
- 8.2.7 Netherlands
- 8.2.8 Sweden
- 8.2.9 Russia
- 8.3 Asia Pacific
- 8.3.1 China
- 8.3.2 India
- 8.3.3 Japan
- 8.3.4 Australia
- 8.3.5 Singapore
- 8.3.6 South Korea
- 8.3.7 Vietnam
- 8.3.8 Indonesia
- 8.3.9 Thailand
- 8.4 Latin America
- 8.4.1 Brazil
- 8.4.2 Mexico
- 8.4.3 Argentina
- 8.5 MEA
- 8.5.1 South Africa
- 8.5.2 Saudi Arabia
- 8.5.3 UAE
- 8.5.4 Turkey
Chapter 9 Company Profiles
- 9.1 Global Players
- 9.1.1 Konecranes
- 9.1.2 Liebherr
- 9.1.3 Manitowoc
- 9.1.4 Palfinger
- 9.1.5 SANY
- 9.1.6 Tadano
- 9.1.7 Terex
- 9.1.8 XCMG
- 9.1.9 Zoomlion
- 9.1.10 ZPMC
- 9.2 Regional Players
- 9.2.1 ABUS Kransysteme
- 9.2.2 GH Cranes & Components
- 9.2.3 Henan Mine Crane
- 9.2.4 KITO Crosby
- 9.2.5 Nucleon Crane
- 9.2.6 Street Crane
- 9.2.7 Weihua
- 9.3 Emerging Players/Disruptors
- 9.3.1 Bocker Maschinenwerke
- 9.3.2 Maeda Seisakusho
- 9.3.3 Sennebogen

 2026-2034年全球硬腿起重機市場規模、佔有率、趨勢和成長分析報告全球固定式起重機市場規模、佔有率、趨勢和成長分析報告(2026-2034年)
 林業起重機市場規模、佔有率和成長分析:按產品類型、臂架類型、起重能力、最終用戶、分銷管道和地區分類-2026-2033年產業預測
 氫動力建築起重機市場分析及預測(至2035年):類型、產品、服務、技術、組件、應用、最終用戶、功能、安裝配置
 印度起重機市場:市場佔有率分析、產業趨勢與統計、成長預測(2026-2031)
 全地形起重機市場-2026-2032年全球市場預測起重機:市場佔有率分析、行業趨勢和統計數據、成長預測(2026-2031 年)
 起重機市場機會、成長要素、產業趨勢分析及2026-2035年預測。剛性腿起重機市場機會、成長要素、產業趨勢分析及 2026-2035 年預測。
 2026-2030年全球起重機市場