


 |
市場調查報告書
商品編碼
2083312
2026 年至 2035 年商用暖氣設備市場的商業機會、成長要素、產業趨勢與預測。Commercial Heating Equipment Market Opportunity, Growth Drivers, Industry Trend Analysis, and Forecast 2026 - 2035 |
||||||

全球商用暖氣設備市場預計到 2025 年將達到 673 億美元,年複合成長率為 8%,到 2035 年將達到 1,457 億美元。
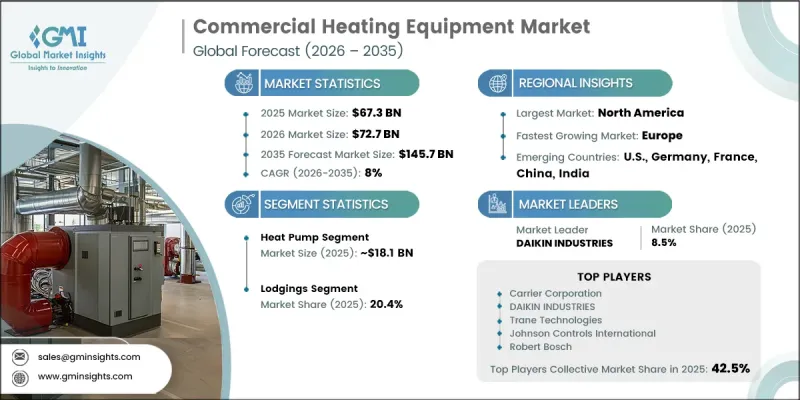
在全球主要經濟體建設活動日益活性化以及對節能型商業基礎設施的持續投資、老舊供暖系統的更換等因素的推動下,全球商用供暖設備市場呈現強勁成長勢頭。隨著減少碳排放、提高建築能源效率和遵守不斷變化的環境法規變得日益重要,向電力加熱商用暖氣技術的轉型正在加速。業主和設施管理人員正擴大用更先進的系統取代傳統的暖氣系統,這些系統具有更高的運作效率和更低的長期能源成本。政府推行的節能基礎建設舉措,以及極具吸引力的財政獎勵和現代化改造計劃,持續推動商業建築的大規模設備升級。傳統暖氣技術不斷上漲的營運成本也促使市場對性能更佳、生命週期成本更低的現代化替代技術的需求不斷成長。這些長期行業趨勢表明,在預測期內,全球商用暖氣設備市場將持續成長。
| 市場範圍 | |
|---|---|
| 開始年份 | 2025 |
| 預測期 | 2026-2035 |
| 上市時的市場規模 | 673億美元 |
| 預測金額 | 1457億美元 |
| 複合年成長率 | 8% |
商用暖氣設備市場持續受益於對永續建築技術和現代化改造專案投資的增加。企業越來越注重降低能耗,同時提升環境績效和運作可靠性。智慧建築管理系統和節能供暖解決方案的日益普及,正在推動商業設施對商用暖氣設備的需求。除了產品性能的不斷提升,更嚴格的建築能源效率標準以及老舊供暖基礎設施的持續現代化改造,也為市場的長期成長創造了有利條件。
預計到2025年,熱泵市佔率將達到26.9%,市場規模將達到181億美元,並在2035年之前以12%的複合年成長率成長。這一成長率顯著高於整體市場平均水平,主要得益於新建商業建築和建築維修項目需求的成長。人們對節能供暖技術的日益青睞、支持低排放系統的有利監管政策以及製造效率的不斷提高,都在加速熱泵技術的普及。此外,熱泵系統與傳統暖氣系統安裝成本差距的縮小,也促進了其在商業領域的廣泛應用。
預計到2025年,住宿設施業將佔據20.4%的市場佔有率(價值137億美元),並在2035年之前以8%的複合年成長率成長。該行業的主導地位主要得益於住宿設施持續的供暖需求以及對節能建築運營投資的不斷增加。商業不動產所有者正優先考慮暖氣系統升級,以提高營運效率、降低能源成本並協助實現永續性目標,這些因素共同推動了該終端用戶產業的持續需求。
預計到2025年,北美商用暖氣設備市場將佔據28.2%的市場佔有率(價值190億美元),並在2035年之前以5.9%的複合年成長率成長。該地區市場的特點是設備裝機量成熟,成長主要由替換需求而非新建需求驅動。商業建築的持續現代化、對能源效率日益重視以及對先進供暖技術的持續投資,預計將在整個預測期內支撐全部區域市場的擴張。
目錄
第1章:調查方法和範圍
第2章執行摘要
第3章 行業洞察
- 產業生態系分析
- 原物料供應及採購分析
- 生產能力評估
- 供應鏈韌性與風險因素
- 配電網路分析
- 影響產業的因素
- 促進因素
- 產業潛在風險與挑戰
- 監理情勢
- 成長潛力分析
- 波特的分析
- 供應商的議價能力
- 買方的議價能力
- 新進入者的威脅
- 替代品的威脅
- PESTLE分析
- 成本結構分析:商用暖氣設備
- 熱泵
- 鍋爐
- 爐
- 熱水器
- 新機會和趨勢
- 數位化和物聯網整合
- 未開發市場和應用領域的成長
- 投資分析及未來展望
- 價格趨勢分析
- 按地區
- 透過技術
- 貿易數據分析
- 進出口額趨勢
- 主要貿易路線及關稅的影響
- 人工智慧和生成式人工智慧對市場的影響
- 利用人工智慧最佳化生產
- 預測性維護和故障檢測
第4章 競爭情勢
- 介紹
- 企業市佔率分析:按地區分類
- 北美洲
- 歐洲
- 亞太地區
- 中東和非洲
- 拉丁美洲
- 主要市場公司的競爭分析
- 競爭定位矩陣
- 主要進展
- 併購
- 夥伴關係和聯盟
- 新產品發布
- 業務拓展計劃及資金籌措
- 按公司規模進行基準測試
- 排名分類標準與遴選標準
- 按銷售額、地區和創新能力分類的層級定位矩陣。
第5章 市場規模及預測:依技術分類,2022-2035年
- 熱泵
- 鍋爐
- 爐
- 熱水器
- 其他
第6章 市場規模與預測:依最終用途分類,2022-2035年
- 辦公室
- 醫療機構
- 教育機構
- 住宿設施
- 零售店
- 其他
第7章 市場規模及預測:依通路分類,2022-2035年
- 線上
- 經銷商
- 零售
第8章 市場規模及預測:依地區分類,2022-2035年
- 北美洲
- 美國
- 加拿大
- 歐洲
- 德國
- 法國
- 英國
- 義大利
- 西班牙
- 葡萄牙
- 羅馬尼亞
- 荷蘭
- 瑞士
- 亞太地區
- 中國
- 日本
- 印度
- 韓國
- 澳洲
- 中東和非洲
- 沙烏地阿拉伯
- UAE
- 埃及
- 南非
- 拉丁美洲
- 巴西
- 阿根廷
第9章:公司簡介
- AO Smith
- Ariston Holding NV
- Baxi Heating
- BDR Thermea Group
- Bradford White Corporation
- Carrier Corporation
- Cleaver-Brooks
- DAIKIN INDUSTRIES
- Danfoss
- Emerson Electric Co.
- Ferroli
- Fujitsu General
- Fulton
- Goodman Manufacturing Company
- Honeywell International Inc.
- Hoval
- Johnson Controls International
- Lennox International
- LG Electronics
- Midea
- Mitsubishi Electric Corporation
- Miura America
- Navien
- NIBE Industrier AB
- Panasonic Corporation
- Rheem Manufacturing Company
- Rinnai Corporation
- Robert Bosch
- SAMSUNG
- STIEBEL ELTRON GmbH
- Thermax Limited
- Trane Technologies
- Vaillant Group
- Viessmann Group
- WM Technologies
- WOLF GmbH
The Global Commercial Heating Equipment Market was valued at USD 67.3 billion in 2025 and is estimated to grow at a CAGR of 8% to reach USD 145.7 billion by 2035.
The market is experiencing strong momentum, supported by continuous investments in energy-efficient commercial infrastructure, replacement of aging heating systems, and growing construction activity across major global economies. Increasing emphasis on reducing carbon emissions, improving building energy efficiency, and complying with evolving environmental regulations is accelerating the transition toward electrically powered commercial heating technologies. Building owners and facility managers are increasingly replacing conventional heating equipment with advanced systems that deliver higher operational efficiency and lower long-term energy costs. Government initiatives promoting energy-efficient infrastructure, combined with favorable financial incentives and modernization programs, continue to encourage large-scale equipment upgrades across commercial buildings. Rising operational expenses associated with traditional heating technologies are also driving demand for modern alternatives that offer improved performance and lower lifecycle costs. These long-term industry trends are expected to support sustained growth across the global commercial heating equipment market throughout the forecast period.
| Market Scope | |
|---|---|
| Start Year | 2025 |
| Forecast Year | 2026-2035 |
| Start Value | $67.3 Billion |
| Forecast Value | $145.7 Billion |
| CAGR | 8% |
The commercial heating equipment market continues to benefit from increasing investments in sustainable building technologies and modernization projects. Businesses are placing greater emphasis on reducing energy consumption while improving environmental performance and operational reliability. Growing adoption of intelligent building management systems and energy-efficient heating solutions is strengthening demand across commercial facilities. Continuous improvements in product performance, combined with stricter building efficiency standards and ongoing replacement of outdated heating infrastructure, are creating favorable conditions for long-term market expansion.
The heat pump segment accounted for 26.9% share in 2025, generating USD 18.1 billion, and is projected to grow at a CAGR of 12% through 2035. This growth rate significantly exceeds the overall market average due to increasing demand across both new commercial construction and building renovation projects. Growing preference for energy-efficient heating technologies, favorable regulatory policies supporting low-emission systems, and continuous improvements in manufacturing efficiency are accelerating adoption. Declining installation cost differences between heat pump systems and conventional heating equipment are also supporting broader commercial acceptance.
The lodging segment held 20.4% share in 2025, equivalent to USD 13.7 billion, and is expected to grow at a CAGR of 8% through 2035. The segment maintains its leadership due to the continuous heating requirements of hospitality facilities and increasing investments in energy-efficient building operations. Commercial property owners are prioritizing heating system upgrades to improve operational efficiency, reduce energy costs, and support sustainability objectives, contributing to continued demand across this end-use sector.
North America Commercial Heating Equipment Market accounted for 28.2% share in 2025, representing USD 19 billion, and is forecast to grow at a CAGR of 5.9% through 2035. The regional market is characterized by a mature installed equipment base, with growth primarily supported by replacement demand rather than new construction. Ongoing modernization of commercial buildings, increasing focus on energy efficiency, and continued investment in advanced heating technologies are expected to sustain market expansion across the region throughout the forecast period.
Major players operating in the global commercial heating equipment market are Carrier Corporation, Daikin Industries, Mitsubishi Electric Corporation, Panasonic Corporation, Trane Technologies, Johnson Controls International, Lennox International, LG Electronics, Viessmann Group, Rheem Manufacturing Company, Robert Bosch, Vaillant Group, Danfoss, Honeywell International Inc., Ariston Holding N.V., BDR Thermea Group, A.O. Smith, STIEBEL ELTRON GmbH, Fujitsu General, Midea, Navien, Rinnai Corporation, Cleaver-Brooks, Goodman Manufacturing Company, Hoval, Thermax Limited, Miura America, Baxi Heating, Bradford White Corporation, Emerson Electric Co., Ferroli, Fulton, NIBE Industrier AB, SAMSUNG, WM Technologies, and WOLF GmbH. Companies operating in the commercial heating equipment market are strengthening their market position through continuous product innovation, expansion of energy-efficient product portfolios, and strategic investments in advanced heating technologies. Manufacturers are prioritizing research and development to improve system efficiency, smart connectivity, and sustainability while meeting evolving regulatory requirements. Businesses are also expanding production capabilities, strengthening distribution networks, and forming strategic partnerships to improve market reach and customer support. Digital monitoring solutions, intelligent building integration, and customized heating systems are becoming important competitive differentiators.
Table of Contents
Chapter 1 Methodology & Scope
- 1.1 Research approach
- 1.2 Quality commitments
- 1.2.1 GMI AI policy & data integrity commitment
- 1.2.1.1 Source consistency protocol
- 1.2.1 GMI AI policy & data integrity commitment
- 1.3 Research trail & confidence scoring
- 1.3.1 Research trail components
- 1.3.2 Scoring components
- 1.4 Data collection
- 1.4.1 Partial list of primary sources
- 1.5 Data mining sources
- 1.5.1 Paid sources
- 1.5.1.1 Sources, by region
- 1.5.1 Paid sources
- 1.6 Base estimates and calculations
- 1.6.1 Base year calculation for any one approach
- 1.7 Market estimates & forecasts parameters
- 1.8 Forecast model
- 1.8.1 Quantified market impact analysis
- 1.8.1.1 Mathematical impact of growth parameters on forecast
- 1.8.1 Quantified market impact analysis
- 1.9 Research transparency addendum
- 1.9.1 Source attribution framework
- 1.9.2 Quality assurance metrics
- 1.9.3 Our commitment to trust
- 1.10 Market definitions
Chapter 2 Executive Summary
- 2.1 Industry synopsis, 2022 - 2035
- 2.1.1 Business trends
- 2.1.2 Technology trends
- 2.1.3 End use trends
- 2.1.4 Channel trends
- 2.1.5 Regional trends
Chapter 3 Industry Insights
- 3.1 Industry ecosystem analysis
- 3.1.1 Raw material availability & sourcing analysis
- 3.1.2 Manufacturing capacity assessment
- 3.1.3 Supply chain resilience & risk factors
- 3.1.4 Distribution network analysis
- 3.2 Industry impact forces
- 3.2.1 Growth drivers
- 3.2.2 Industry pitfalls & challenges
- 3.3 Regulatory landscape
- 3.4 Growth potential analysis
- 3.5 Porter's analysis
- 3.5.1 Bargaining power of suppliers
- 3.5.2 Bargaining power of buyers
- 3.5.3 Threat of new entrants
- 3.5.4 Threat of substitutes
- 3.6 PESTEL analysis
- 3.6.1 Political factors
- 3.6.2 Economic factors
- 3.6.3 Social factors
- 3.6.4 Technological factors
- 3.6.5 Legal factors
- 3.6.6 Environmental factors
- 3.7 Cost structure analysis of commercial heating equipment
- 3.7.1 Heat pump
- 3.7.2 Boiler
- 3.7.3 Furnace
- 3.7.4 Water heater
- 3.8 Emerging opportunities & trends
- 3.9 Digitalization & IoT integration
- 3.10 Growth in untapped markets & applications
- 3.11 Investment analysis & future prospects
- 3.12 Price trend analysis (USD/Unit) (Driven by Primary Research)
- 3.12.1 By region (Driven by Primary Research)
- 3.12.2 By technology (Driven by Primary Research)
- 3.13 Trade data analysis (Driven by Primary Research)
- 3.13.1 Import/export value trends (Driven by Primary Research)
- 3.13.2 Key trade corridors & tariff impact (Driven by Primary Research)
- 3.14 Impact of AI & Generative AI on the market (Driven by Primary Research)
- 3.14.1 AI-Driven production optimization (Driven by Primary Research)
- 3.14.2 Predictive maintenance & fault detection (Driven by Primary Research)
Chapter 4 Competitive Landscape, 2026
- 4.1 Introduction
- 4.2 Company market share analysis, by region, 2025
- 4.2.1 North America
- 4.2.2 Europe
- 4.2.3 Asia Pacific
- 4.2.4 Middle East & Africa
- 4.2.5 Latin America
- 4.3 Competitive analysis of major market players
- 4.4 Competitive positioning matrix
- 4.5 Key developments
- 4.5.1 Mergers & acquisitions
- 4.5.2 Partnerships & collaborations
- 4.5.3 New product launches
- 4.5.4 Expansion plans & funding
- 4.6 Company tier benchmarking
- 4.6.1 Tier classification criteria & qualifying thresholds
- 4.6.2 Tier positioning matrix by revenue, geography & innovation
Chapter 5 Market Size and Forecast, By Technology, 2022 - 2035 (USD Million & '000 Units)
- 5.1 Key trends
- 5.2 Heat pump
- 5.3 Boiler
- 5.4 Furnace
- 5.5 Water heater
- 5.6 Others
Chapter 6 Market Size and Forecast, By End Use, 2022 - 2035 (USD Million & '000 Units)
- 6.1 Key trends
- 6.2 Offices
- 6.3 Healthcare facilities
- 6.4 Educational institutions
- 6.5 Lodgings
- 6.6 Retail stores
- 6.7 Others
Chapter 7 Market Size and Forecast, By Channel, 2022 - 2035 (USD Million & '000 Units)
- 7.1 Key trends
- 7.2 Online
- 7.3 Dealer
- 7.4 Retail
Chapter 8 Market Size and Forecast, By Region, 2022 - 2035 (USD Million & '000 Units)
- 8.1 Key trends
- 8.2 North America
- 8.2.1 U.S.
- 8.2.2 Canada
- 8.3 Europe
- 8.3.1 Germany
- 8.3.2 France
- 8.3.3 UK
- 8.3.4 Italy
- 8.3.5 Spain
- 8.3.6 Portugal
- 8.3.7 Romania
- 8.3.8 Netherlands
- 8.3.9 Switzerland
- 8.4 Asia Pacific
- 8.4.1 China
- 8.4.2 Japan
- 8.4.3 India
- 8.4.4 South Korea
- 8.4.5 Australia
- 8.5 Middle East & Africa
- 8.5.1 Saudi Arabia
- 8.5.2 UAE
- 8.5.3 Egypt
- 8.5.4 South Africa
- 8.6 Latin America
- 8.6.1 Brazil
- 8.6.2 Argentina
Chapter 9 Company Profiles
- 9.1 A.O. Smith
- 9.2 Ariston Holding N.V.
- 9.3 Baxi Heating
- 9.4 BDR Thermea Group
- 9.5 Bradford White Corporation
- 9.6 Carrier Corporation
- 9.7 Cleaver-Brooks
- 9.8 DAIKIN INDUSTRIES
- 9.9 Danfoss
- 9.10 Emerson Electric Co.
- 9.11 Ferroli
- 9.12 Fujitsu General
- 9.13 Fulton
- 9.14 Goodman Manufacturing Company
- 9.15 Honeywell International Inc.
- 9.16 Hoval
- 9.17 Johnson Controls International
- 9.18 Lennox International
- 9.19 LG Electronics
- 9.20 Midea
- 9.21 Mitsubishi Electric Corporation
- 9.22 Miura America
- 9.23 Navien
- 9.24 NIBE Industrier AB
- 9.25 Panasonic Corporation
- 9.26 Rheem Manufacturing Company
- 9.27 Rinnai Corporation
- 9.28 Robert Bosch
- 9.29 SAMSUNG
- 9.30 STIEBEL ELTRON GmbH
- 9.31 Thermax Limited
- 9.32 Trane Technologies
- 9.33 Vaillant Group
- 9.34 Viessmann Group
- 9.35 WM Technologies
- 9.36 WOLF GmbH

 暖氣設備:市場佔有率分析、產業趨勢與統計、成長預測(2026-2031)
 全球感應加熱系統市場規模、佔有率、趨勢和成長分析報告(2026-2034年)英國暖氣設備:市場佔有率分析、產業趨勢與統計及成長預測(2026-2031)
 加熱設備市場:2026-2032年全球市場預測(依燃料類型、產品類型、機制、最終用戶及銷售管道分類)
 全球工業製程加熱市場:按燃氣加熱和電加熱、按地區分類 - 預測至 2032 年
 低頻加熱系統市場預測至2034年-按產品類型、類別、應用和地區分類的全球分析
 暖氣設備市場規模、佔有率、趨勢和預測:按產品、應用和地區分類,2026-2034年
 2026年全球熱泵混合式熱水箱市場報告熱風加熱器市場:2026-2032年全球市場預測(依燃料類型、安裝方式、容量範圍、最終用戶和銷售管道)熱水地暖系統市場:依產品類型、地板材料類型、最終用戶、應用和分銷管道分類-2026年至2032年全球預測