


 |
市場調查報告書
商品編碼
2083263
從污水中回收鳥糞石市場:市場機會、成長要素、產業趨勢分析及2026-2035年預測Struvite Recovery from Wastewater Market Opportunity, Growth Drivers, Industry Trend Analysis, and Forecast 2026 - 2035 |
||||||

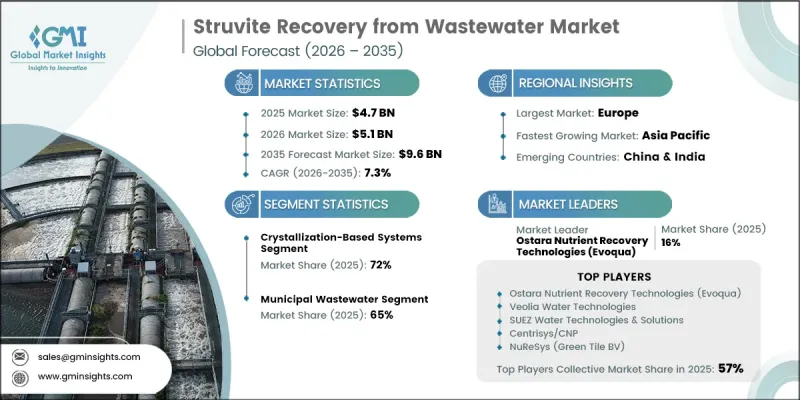
2025 年,全球從污水中回收鳥糞石的市值為 47 億美元,預計到 2035 年將以 7.3% 的複合年成長率成長至 96 億美元。
這一成長的促進因素包括更嚴格的營養物排放法規、循環經濟原則的日益普及以及人們對污水來源營養物作為寶貴商業資源的認知不斷提高。市場擴張反映的是長期的結構性變化,而非暫時的產業趨勢。鳥糞石回收技術不再僅被視為處理系統中控制結垢和磷積累的運作解決方案;相反,它代表著一項戰略投資,既能幫助設施滿足監管要求,又能生產出可銷售的肥料產品。隨著處理業者越來越意識到將廢物流轉化為創收資產的機會,專案實施的財務前景顯著改善。產品商業化產生的收入有助於抵消安裝和營運成本,從而提高專案經濟效益,並促進不同處理能力設施的更廣泛應用。同時,日益嚴格的磷控制法規不斷為主要廢水處理市場的先進營養物回收技術創造投資機會。
| 市場範圍 | |
|---|---|
| 開始年份 | 2025 |
| 預測期 | 2026-2035 |
| 初始市場規模 | 47億美元 |
| 預測金額 | 96億美元 |
| 複合年成長率 | 7.3% |
預計到2025年,結晶技術將佔據72%的市場。該技術在市場上的主導地位得益於其長期運作的可靠性、持續穩定的商業性化回收率以及監管機構和終端用戶的廣泛支持。這些系統的成熟性及其在實際運作條件下的良好表現,使得結晶技術成為尋求高效磷回收解決方案的設施的首選技術途徑。隨著污水處理業者致力於在確保合規性的同時最大限度地提高營養物回收率,各主要區域市場對成熟結晶製程的需求依然強勁。
預計到2025年,都市污水處理領域的市佔率將達到65%。這一顯著的市場佔有率得益於有利的磷濃度和強力的監管獎勵,這些措施鼓勵從都市污水處理基礎設施中回收營養物質。處理高濃度側流污水的污水處理廠通常含有較高濃度的溶解磷,有利於高效結晶和高回收率。這些運作條件為大規模部署提供了極具吸引力的經濟效益,並持續推動磷回收技術在都市污水處理網路中的廣泛應用。基礎設施現代化和資源回收投入的增加,進一步刺激了該應用領域的需求。
預計到2025年,北美廢水鳥糞石回收市場將佔據27%的佔有率,並在2035年之前以4.8%的複合年成長率成長。美國持續致力於改善營養物管理和廢水處理性能,因此仍然是該地區市場需求的最大貢獻者。旨在降低水系統中磷含量的監管措施正促使污水處理廠投資於能夠滿足日益嚴格的排放標準的先進營養物回收解決方案。隨著環境合規標準的不斷發展,污水處理業者正在增加對除磷技術的投入,同時創造資源回收的機會。
目錄
第1章:調查方法和範圍
第2章執行摘要
第3章 行業洞察
- 產業生態系分析
- 供應商情況
- 利潤率
- 每個階段增加的價值
- 影響價值鏈的因素
- 中斷
- 影響產業的因素
- 促進因素
- 產業潛在風險與挑戰
- 市場機遇
- 成長潛力分析
- 監理情勢
- 北美洲
- 歐洲
- 亞太地區
- 拉丁美洲
- 中東和非洲
- 波特的分析
- PESTLE分析
- 價格趨勢
- 按地區
- 透過技術
- 未來市場趨勢
- 技術與創新展望
- 最新科技趨勢
- 新興技術
- 專利趨勢
- 貿易統計
- 主要進口國
- 主要出口國
- 永續性和環境方面
- 永續計劃
- 減少廢棄物策略
- 生產中的能源效率
- 具有環保意識的舉措
第4章 競爭情勢
- 介紹
- 企業市佔率分析
- 按地區
- 北美洲
- 歐洲
- 亞太地區
- LATAM
- 中東和非洲
- 按地區
- 企業矩陣分析
- 主要市場公司的競爭分析
- 競爭定位矩陣
- 主要進展
- 併購
- 夥伴關係和聯盟
- 新產品發布
- 業務拓展計劃
第5章 市場估計與預測:依技術分類,2022年至2035年
- 結晶技術
- 流體化床反應器(FBR)
- 攪拌釜反應器
- 氣升反應爐
- 打包床系統
- 電化學回收系統
- 犧牲鎂陽極系統
- 混合電化學和結晶平台
- 利用生物炭進行結晶
- 鎂浸漬生物炭體系
- 生物炭-鳥糞石複合物的製備
第6章 市場估算與預測:依廢水來源分類,2022年至2035年
- 都市污水(污泥液/側流)
- 從消化道回收上清液
- 脫水濃縮液/濾液的回收
- 厭氧消化後的處理水
- 工業污水
- 食品加工業
- 化學品/肥料生產
- 乳製品和飲料業
- 製藥和特種化學品行業
- 農業、工業及畜牧業廢水
- 牲畜糞便處理設施
- 動物屍體處理加工廠
- 沼氣池殘渣的回收
- 分離處理水流
- 尿液分離系統
- 高濃度營養液
第7章 市場估算與預測:依最終使用者分類,2022年至2035年
- 都市污水處理廠(WWTP)
- 大型設施(人口當量10萬或以上)
- 中型設施(相當於 5 萬至 10 萬人)
- 先進生物除磷(EBPR)設施
- 工業加工設施
- 現場廢水處理(食品和飲料)
- 製藥和化工產業的設施
- 採礦和礦物加工企業
- 農業作業
- 已引進厭氧消化技術的畜牧場
- 沼氣廠及能源回收設施
- 大型育肥場及集中式畜牧設施(CAFO)
- 分散式/小規模系統
- 區域級處理系統
- 源頭分類及現場收集設施
第8章 市場估計與預測:依地區分類,2022年至2035年
- 北美洲
- 美國
- 加拿大
- 歐洲
- 德國
- 英國
- 法國
- 西班牙
- 義大利
- 其他歐洲國家
- 亞太地區
- 中國
- 印度
- 日本
- 澳洲
- 韓國
- 其他亞太國家
- 拉丁美洲
- 巴西
- 墨西哥
- 阿根廷
- 其他拉丁美洲國家
- 中東和非洲
- 沙烏地阿拉伯
- 南非
- UAE
- 其他中東和非洲國家
第9章:公司簡介
- Ostara Nutrient Recovery Technologies(Evoqua)
- Veolia Water Technologies
- SUEZ Water Technologies &Solutions
- Centrisys/CNP
- NuReSys(Green Tile BV)
- CNP Cycles GmbH
- Paques Technology
- Schwing Bioset
- Colsen BV
- PARFORCE Engineering
The Global Struvite Recovery from Wastewater Market was valued at USD 4.7 billion in 2025 and is estimated to grow at a CAGR of 7.3% to reach USD 9.6 billion by 2035.
Growth is fueled by stricter nutrient discharge regulations, rising adoption of circular economy principles, and growing recognition of wastewater-derived nutrients as valuable commercial resources. The market's expansion reflects a long-term structural shift rather than a temporary industry trend. Struvite recovery technologies are no longer viewed solely as operational solutions for managing scaling and phosphorus accumulation within treatment systems. Instead, they have become strategic investments that help facilities meet regulatory requirements while generating marketable fertilizer products. The financial outlook for project deployment has improved considerably as treatment operators increasingly identify opportunities to transform waste streams into revenue-generating assets. Revenue generated through product commercialization is helping offset installation and operating costs, improving project economics and encouraging broader adoption across facilities of varying capacities. At the same time, increasingly stringent phosphorus management regulations are creating a consistent pipeline of investment opportunities for advanced nutrient recovery technologies across major wastewater treatment markets.
| Market Scope | |
|---|---|
| Start Year | 2025 |
| Forecast Year | 2026-2035 |
| Start Value | $4.7 Billion |
| Forecast Value | $9.6 Billion |
| CAGR | 7.3% |
The crystallization-based technologies segment held a 72% share in 2025. Their leading market position is supported by long-term operational reliability, consistent production of commercially acceptable recovered materials, and broad acceptance among regulators and end users. The maturity of these systems, combined with proven performance under full-scale operating conditions, continues to make crystallization the preferred technology pathway for facilities seeking effective phosphorus recovery solutions. As wastewater treatment operators focus on maximizing nutrient capture while maintaining regulatory compliance, demand for established crystallization processes remains strong across key regional markets.
The municipal wastewater streams segment reached 65% share in 2025. This substantial market share is supported by favorable phosphorus concentrations and strong regulatory incentives encouraging nutrient recovery from municipal treatment infrastructure. Wastewater treatment facilities processing concentrated sidestream flows frequently contain dissolved phosphorus levels capable of supporting efficient crystallization and high recovery yields. These operating conditions create attractive economics for large-scale deployment and continue to support the widespread adoption of phosphorus recovery technologies within municipal treatment networks. Increasing investments in infrastructure modernization and resource recovery initiatives are further strengthening demand across this application segment.
North America Struvite Recovery from Wastewater Market accounted for 27% share in 2025 and is projected to grow at a CAGR of 4.8% through 2035. The United States remains the largest contributor to regional market demand due to ongoing efforts to improve nutrient management and wastewater treatment performance. Regulatory measures targeting phosphorus reduction in water systems have encouraged treatment facilities to invest in advanced nutrient recovery solutions capable of achieving increasingly stringent discharge requirements. As environmental compliance standards continue to evolve, wastewater operators are allocating greater capital toward technologies that support phosphorus removal while creating opportunities for resource recovery.
Key participants operating in the Global Struvite Recovery from Wastewater Market include Ostara Nutrient Recovery Technologies (Evoqua/Xylem), Veolia Water Technologies, SUEZ Water Technologies & Solutions, Centrisys/CNP, and NuReSys (Green Tile BV). Companies operating in the Struvite Recovery from Wastewater Market are focusing on technological innovation, strategic partnerships, and expansion of nutrient recovery capabilities to strengthen their competitive position. Market participants are investing in advanced recovery systems that improve phosphorus capture efficiency, enhance product quality, and reduce operating costs for wastewater treatment facilities. Collaboration with municipal utilities, industrial operators, engineering firms, and infrastructure developers remains a key growth strategy for accelerating project deployment. Many companies are also emphasizing research and development to optimize crystallization performance and support broader applications across different wastewater streams.
Table of Contents
Chapter 1 Methodology & Scope
- 1.1 Research approach
- 1.2 Quality Commitments
- 1.2.1 GMI AI policy & data integrity commitment
- 1.2.1.1 Source consistency protocol
- 1.2.1 GMI AI policy & data integrity commitment
- 1.3 Research Trail & Confidence Scoring
- 1.3.1 Research Trail Components
- 1.3.2 Scoring Components
- 1.4 Data Collection
- 1.4.1 Partial list of primary sources
- 1.5 Data mining sources
- 1.5.1 Paid sources
- 1.5.1.1 Sources, by region
- 1.5.1 Paid sources
- 1.6 Base estimates and calculations
- 1.6.1 Base year calculation for any one approach
- 1.7 Forecast model
- 1.7.1 Quantified market impact analysis
- 1.7.1.1 Mathematical impact of growth parameters on forecast
- 1.7.1 Quantified market impact analysis
- 1.8 Research transparency addendum
- 1.8.1 Source attribution framework
- 1.8.2 Quality assurance metrics
- 1.8.3 Our commitment to trust
Chapter 2 Executive Summary
- 2.1 Industry 360° synopsis
- 2.2 Key market trends
- 2.2.1 Regional
- 2.2.2 By Technology
- 2.2.3 By Wastewater Source
- 2.2.4 By End User
- 2.3 TAM Analysis, 2026-2035
- 2.4 CXO perspectives: Strategic imperatives
Chapter 3 Industry Insights
- 3.1 Industry ecosystem analysis
- 3.1.1 Supplier landscape
- 3.1.2 Profit margin
- 3.1.3 Value addition at each stage
- 3.1.4 Factor affecting the value chain
- 3.1.5 Disruptions
- 3.2 Industry impact forces
- 3.2.1 Growth drivers
- 3.2.2 Industry pitfalls and challenges
- 3.2.3 Market opportunities
- 3.3 Growth potential analysis
- 3.4 Regulatory landscape
- 3.4.1 North America
- 3.4.2 Europe
- 3.4.3 Asia Pacific
- 3.4.4 Latin America
- 3.4.5 Middle East & Africa
- 3.5 Porter’s analysis
- 3.6 PESTEL analysis
- 3.7 Price trends
- 3.7.1 By region
- 3.7.2 By technology
- 3.8 Future market trends
- 3.9 Technology and Innovation landscape
- 3.9.1 Current technological trends
- 3.9.2 Emerging technologies
- 3.10 Patent Landscape
- 3.11 Trade statistics (HS code)
- 3.11.1 Major importing countries
- 3.11.2 Major exporting countries
- 3.12 Sustainability and environmental aspects
- 3.12.1 Sustainable practices
- 3.12.2 Waste reduction strategies
- 3.12.3 Energy efficiency in production
- 3.12.4 Eco friendly initiatives
Chapter 4 Competitive Landscape, 2025
- 4.1 Introduction
- 4.2 Company market share analysis
- 4.2.1 By region
- 4.2.1.1 North America
- 4.2.1.2 Europe
- 4.2.1.3 Asia Pacific
- 4.2.1.4 LATAM
- 4.2.1.5 MEA
- 4.2.1 By region
- 4.3 Company matrix analysis
- 4.4 Competitive analysis of major market players
- 4.5 Competitive positioning matrix
- 4.6 Key developments
- 4.6.1 Mergers & acquisitions
- 4.6.2 Partnerships & collaborations
- 4.6.3 New Product Launches
- 4.6.4 Expansion Plans
Chapter 5 Market Estimates and Forecast, By Technology, 2022 to 2035 (USD Million) (Tons)
- 5.1 Key trends
- 5.2 Crystallization-Based Technologies
- 5.2.1 Fluidized Bed Reactors (FBR)
- 5.2.2 Stirred Tank Reactors
- 5.2.3 Air-Lift Reactors
- 5.2.4 Packed-Bed Systems
- 5.3 Electrochemical Recovery Systems
- 5.3.1 Sacrificial Magnesium Anode Systems
- 5.3.2 Hybrid Electrochemical-Crystallization Platforms
- 5.4 Biochar-Assisted Crystallization
- 5.4.1 Mg-Impregnated Biochar Systems
- 5.4.2 Biochar-Struvite Composite Production
Chapter 6 Market Estimates and Forecast, By Wastewater Source, 2022 to 2035 (USD Million) (Tons)
- 6.1 Key trends
- 6.2 Municipal Wastewater (Sludge Liquor/Sidestream)
- 6.2.1 Digester Supernatant Recovery
- 6.2.2 Dewatering Centrate/Filtrate Recovery
- 6.2.3 Post-Anaerobic Digestion Streams
- 6.3 Industrial Wastewater
- 6.3.1 Food Processing Industry
- 6.3.2 Chemical & Fertilizer Manufacturing
- 6.3.3 Dairy & Beverage Industries
- 6.3.4 Pharmaceutical & Specialty Chemical Sectors
- 6.4 Agro-Industrial & Livestock Wastewater
- 6.4.1 Manure Processing Facilities
- 6.4.2 Animal Rendering & Processing Plants
- 6.4.3 Biogas Digestates Recovery
- 6.5 Source-Separated Streams
- 6.5.1 Urine Separation Systems
- 6.5.2 Concentrated Nutrient Streams
Chapter 7 Market Estimates and Forecast, By End User, 2022 to 2035 (USD Million) (Tons)
- 7.1 Key trends
- 7.2 Municipal Wastewater Treatment Plants (WWTPs)
- 7.2.1 Large-Scale Facilities (>100,000 Population Equivalents)
- 7.2.2 Medium-Scale Facilities (50,000-100,000 Population Equivalents)
- 7.2.3 Enhanced Biological Phosphorus Removal (EBPR) Plants
- 7.3 Industrial Treatment Facilities
- 7.3.1 On-Site Wastewater Treatment (Food & Beverage)
- 7.3.2 Pharmaceutical & Chemical Industry Facilities
- 7.3.3 Mining & Mineral Processing Operations
- 7.4 Agricultural Operations
- 7.4.1 Livestock Farms with Anaerobic Digestion
- 7.4.2 Biogas Plants & Energy Recovery Facilities
- 7.4.3 Large-Scale Feedlots & Concentrated Animal Feeding Operations (CAFOs)
- 7.5 Decentralized/Small-Scale Systems
- 7.5.1 Community-Level Treatment Systems
- 7.5.2 Source-Separation & On-Site Recovery Facilities
Chapter 8 Market Estimates and Forecast, By Region, 2022 to 2035 (USD Million) (Tons)
- 8.1 Key trends
- 8.2 North America
- 8.2.1 U.S.
- 8.2.2 Canada
- 8.3 Europe
- 8.3.1 Germany
- 8.3.2 UK
- 8.3.3 France
- 8.3.4 Spain
- 8.3.5 Italy
- 8.3.6 Rest of Europe
- 8.4 Asia Pacific
- 8.4.1 China
- 8.4.2 India
- 8.4.3 Japan
- 8.4.4 Australia
- 8.4.5 South Korea
- 8.4.6 Rest of Asia Pacific
- 8.5 Latin America
- 8.5.1 Brazil
- 8.5.2 Mexico
- 8.5.3 Argentina
- 8.5.4 Rest of Latin America
- 8.6 Middle East and Africa
- 8.6.1 Saudi Arabia
- 8.6.2 South Africa
- 8.6.3 UAE
- 8.6.4 Rest of Middle East and Africa
Chapter 9 Company Profiles
- 9.1 Ostara Nutrient Recovery Technologies (Evoqua)
- 9.2 Veolia Water Technologies
- 9.3 SUEZ Water Technologies & Solutions
- 9.4 Centrisys/CNP
- 9.5 NuReSys (Green Tile BV)
- 9.6 CNP Cycles GmbH
- 9.7 Paques Technology
- 9.8 Schwing Bioset
- 9.9 Colsen B.V.
- 9.10 PARFORCE Engineering

 全球電子廢棄物回收市場規模、佔有率、趨勢和成長分析報告(2026-2034)
 鳥糞石肥料:市場佔有率分析、產業趨勢與統計、成長預測(2026-2031)
 工業資源回收市場預測至2034年-按材料類型、回收流程、來源、服務類型、應用和地區分類的全球分析2026-2034年全球電子廢棄物回收再利用服務市場規模、佔有率、趨勢及成長分析報告
 電子廢棄物回收市場:市場規模、佔有率和趨勢分析(按材料、來源、回收過程和地區分類),細分市場預測(2026-2033 年)資源回收市場預測至2034年—按資源類型、廢棄物來源、技術、應用、最終用戶和地區分類的全球分析電子廢棄物中稀有金屬回收市場預測—全球分析(按金屬類型、電子廢棄物來源、回收技術、最終用戶和地區分類)—2034年
 貴金屬電子廢棄物回收市場機會、成長要素、產業趨勢分析及2026-2035年預測
 2026-2030年全球電子廢棄物回收市場
 2026年全球貴金屬電子廢棄物回收市場報告