


 |
市場調查報告書
商品編碼
2027607
貴金屬電子廢棄物回收市場機會、成長要素、產業趨勢分析及2026-2035年預測Precious Metals E-Waste Recovery Market Opportunity, Growth Drivers, Industry Trend Analysis, and Forecast 2026 - 2035 |
||||||
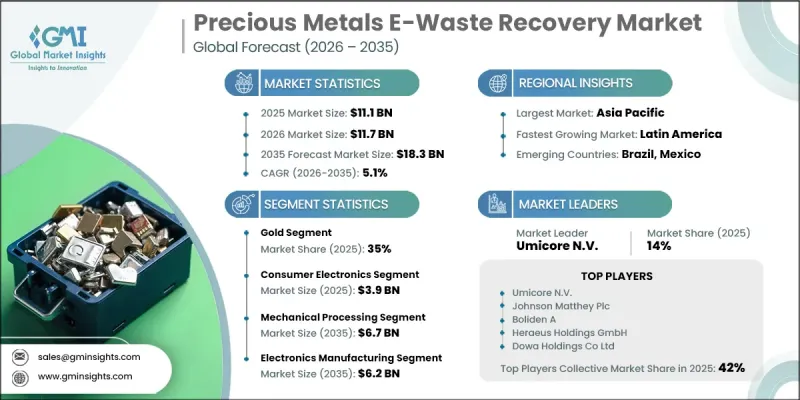
全球貴金屬電子廢棄物回收市場預計到 2025 年價值 111 億美元,預計到 2035 年將以 5.1% 的複合年成長率成長至 183 億美元。
隨著對永續性和技術進步的日益重視,市場正經歷穩步轉型,回收方法也隨之重塑。人們對環保加工方法的興趣日益濃厚,推動了先進技術的應用,這些技術在保持高效率的同時,最大限度地減少了排放。同時,機器人、感測器系統和數據驅動分析等自動化技術的整合,提高了分類精度,提升了回收率,並減少了對人工的依賴。儘管機械加工仍然是回收方法中材料分離的基礎步驟,但更先進的方法因其環境優勢而日益受到重視。儘管人們對永續性的關注度不斷提高,傳統的大規模加工流程在大批量處理中仍發揮著重要作用。終端用戶產業的需求依然強勁,尤其是那些需要穩定貴金屬供應的製造業。從區域來看,亞太地區由於材料供應充足和工業成長,市場活動最為活躍,其次是歐洲和北美。同時,發展中地區也逐漸擴大其在全球市場的佔有率。
| 市場範圍 | |
|---|---|
| 開始年份 | 2025 |
| 預測期 | 2026-2035 |
| 上市時的市場規模 | 111億美元 |
| 預測金額 | 183億美元 |
| 複合年成長率 | 5.1% |
預計到 2025 年,黃金板塊將佔據 35% 的市場佔有率,到 2035 年將以 4.7% 的複合年成長率成長。黃金的高經濟價值及其在電子元件中的廣泛應用,使其成為市場上最重要的回收材料,從而推動了整個回收行業的穩定需求。
預計到 2025 年,消費性電子產品市場規模將達到 39 億美元,並從 2026 年到 2035 年以 5% 的複合年成長率成長。對電子設備的強勁需求顯著增加了可回收材料的數量,從而支撐了該領域的持續成長,並鞏固了其在市場中的主導地位。
預計2026年至2035年,北美貴金屬電子廢棄物回收市場將以7%的複合年成長率成長。該地區的成長主要得益於嚴格的環境法規、完善的回收基礎設施以及人們對永續廢棄物管理實踐日益增強的意識。現有產業參與企業進一步鞏固了市場,而循環經濟舉措的日益普及和持續的技術進步也推動了市場的長期擴張。
目錄
第1章:調查方法和範圍
第2章執行摘要
第3章業界考察
- 生態系分析
- 供應商情況
- 利潤率
- 每個階段增加的價值
- 影響價值鏈的因素
- 中斷
- 影響產業的因素
- 促進因素
- 產業潛在風險與挑戰
- 市場機遇
- 成長潛力分析
- 監理情勢
- 波特五力分析
- PESTEL 分析
- 價格趨勢
- 按地區
- 依貴金屬類型
- 未來市場趨勢
- 科技與創新趨勢
- 當前技術趨勢
- 新興技術
- 專利趨勢
- 貿易統計(HS編碼)
- 主要進口國
- 主要出口國
- 永續性和環境方面
- 永續計劃
- 減少廢棄物策略
- 生產中的能源效率
- 環保意識的舉措
第4章 競爭情勢
- 介紹
- 企業市佔率分析
- 按地區
- 北美洲
- 歐洲
- 亞太地區
- 拉丁美洲
- 中東和非洲
- 按地區
- 企業矩陣分析
- 主要市場公司的競爭分析
- 競爭定位矩陣
- 主要進展
- 併購
- 夥伴關係與合作
- 新產品發布
- 業務拓展計劃
第5章 市場估價與預測:依貴金屬類型分類,2022-2035年
- 金子
- 銀
- 鉑
- 鈀
- 銠
- 其他
第6章 市場估算與預測:依原料分類,2022-2035年
- 家用電子產品
- 智慧型手機
- 筆記型電腦
- 藥片
- 電視機
- 穿戴式裝置
- 資訊科技/通訊設備
- 伺服器和資料中心設備
- 網路裝置
- 通訊設備
- 工業電子設備
- 工業自動化系統
- 控制面板
- 感測器和測量儀器
- 汽車電子
- 電控系統(ECU)
- 感測器和汽車電子產品
- 電動車電池管理電子設備
- 醫療設備
- 診斷設備
- 影像系統
- 監控設備
- 家用電器
- 冷藏庫
- 洗衣機
- 微波爐
- 其他
第7章 市場估計與預測:依復甦進程分類,2022-2035年
- 機械加工
- 粉碎
- 排序
- 磁選
- 濕式冶金工藝
- 浸出
- 溶劑萃取
- 離子交換
- 熱冶金工藝
- 冶煉
- 熱處理
- 電化學過程
- 電解提煉
- 提煉
- 生物技術工藝
- 生物瀝取
- 微生物恢復
第8章 市場估算與預測:依最終用途分類,2022-2035年
- 電子設備製造
- 汽車產業
- 航太/國防
- 醫療設備製造
- 珠寶飾品和貴金屬提煉
- 其他
第9章 市場估計與預測:依地區分類,2022-2035年
- 北美洲
- 美國
- 加拿大
- 歐洲
- 德國
- 英國
- 法國
- 西班牙
- 義大利
- 其他歐洲地區
- 亞太地區
- 中國
- 印度
- 日本
- 澳洲
- 韓國
- 亞太其他地區
- 拉丁美洲
- 巴西
- 墨西哥
- 阿根廷
- 其他拉丁美洲地區
- 中東和非洲
- 沙烏地阿拉伯
- 南非
- 阿拉伯聯合大公國
- 其他中東和非洲地區
第10章:公司簡介
- Umicore NV
- Johnson Matthey Plc
- Boliden A
- Heraeus Holding GmbH
- DOWA Holding Co., Ltd
- Tanaka Precious Metals
- Sims Limited
- Materion Corporation
- TES-AMM Pte. Ltd.
- EnviroLeach Technologies Inc.
The Global Precious Metals E-Waste Recovery Market was valued at USD 11.1 billion in 2025 and is estimated to grow at a CAGR of 5.1% to reach USD 18.3 billion by 2035.
The market is undergoing a steady transformation as sustainability priorities and technological progress reshape recovery practices. Increasing focus on environmentally responsible processing methods is encouraging the adoption of advanced techniques that minimize emissions while maintaining high efficiency. At the same time, the integration of automation technologies such as robotics, sensor systems, and data-driven analytics is improving sorting accuracy, enhancing recovery yields, and reducing reliance on manual labor. Among recovery approaches, mechanical processing continues to dominate as a foundational step for material separation, while more advanced methods are gaining momentum due to their environmental advantages. Traditional large-scale processes remain relevant for high-volume operations despite growing sustainability concerns. Demand across end-use industries remains strong, particularly from sectors that require a consistent supply of precious metals for manufacturing applications. Regional dynamics highlight strong activity in Asia Pacific due to high material availability and industrial growth, followed by Europe and North America, while developing regions are gradually expanding their presence in the global landscape.
| Market Scope | |
|---|---|
| Start Year | 2025 |
| Forecast Year | 2026-2035 |
| Start Value | $11.1 Billion |
| Forecast Value | $18.3 Billion |
| CAGR | 5.1% |
The gold segment accounted for 35% share in 2025 and is expected to grow at a CAGR of 4.7% through 2035. Its high economic value and widespread utilization in electronic components make it the most prominent material recovered within the market, driving consistent demand across recycling operations.
The consumer electronics segment generated USD 3.9 billion in 2025 and is projected to grow at a CAGR of 5% from 2026 to 2035. Strong demand for electronic devices contributes significantly to the volume of recoverable materials, supporting continuous growth in this segment and reinforcing its leading position within the market.
North America Precious Metals E-Waste Recovery Market is expected to grow at a CAGR of 7% during 2026-2035. Growth in the region is supported by stringent environmental regulations, well-developed recycling infrastructure, and increasing awareness of sustainable waste management practices. The presence of established industry participants further strengthens the market, while growing adoption of circular economy initiatives and continued technological advancements are contributing to long-term expansion.
Key companies operating in the Global Precious Metals E-Waste Recovery Market include Umicore NV, Johnson Matthey Plc, Boliden AB, Heraeus Holding GmbH, DOWA Holding Co., Ltd, Tanaka Precious Metals, Sims Limited, Materion Corporation, TES-AMM Pte. Ltd., and EnviroLeach Technologies Inc. Companies in the Precious Metals E-Waste Recovery Market are focusing on strengthening their competitive position through technological innovation and strategic expansion. Significant investments are being made in advanced recovery technologies to improve efficiency, reduce environmental impact, and enhance metal recovery rates. Partnerships and collaborations are helping companies access new markets and expand operational capabilities. Firms are also investing in automation and digital solutions to optimize processing and reduce costs. Expanding recycling capacity and strengthening supply chain networks are key priorities to meet growing demand. Additionally, companies are aligning with regulatory standards and sustainability goals while developing circular economy strategies to ensure long-term growth and market leadership.
Table of Contents
Chapter 1 Methodology & Scope
- 1.1 Research approach
- 1.2 Quality Commitments
- 1.2.1 GMI AI policy & data integrity commitment
- 1.2.1.1 Source consistency protocol
- 1.2.1 GMI AI policy & data integrity commitment
- 1.3 Research Trail & Confidence Scoring
- 1.3.1 Research Trail Components
- 1.3.2 Scoring Components
- 1.4 Data Collection
- 1.4.1 Partial list of primary sources
- 1.5 Data mining sources
- 1.5.1 Paid sources
- 1.5.1.1 Sources, by region
- 1.5.1 Paid sources
- 1.6 Base estimates and calculations
- 1.6.1 Base year calculation for any one approach
- 1.7 Forecast model
- 1.7.1 Quantified market impact analysis
- 1.7.1.1 Mathematical impact of growth parameters on forecast
- 1.7.1 Quantified market impact analysis
- 1.8 Research transparency addendum
- 1.8.1 Source attribution framework
- 1.8.2 Quality assurance metrics
- 1.8.3 Our commitment to trust
Chapter 2 Executive Summary
- 2.1 Industry 360° synopsis
- 2.2 Key market trends
- 2.2.1 Regional
- 2.2.2 Precious Metal Type
- 2.2.3 Source
- 2.2.4 Recovery Process
- 2.2.5 End Use Industry
- 2.3 TAM Analysis, 2025-2035
- 2.4 CXO perspectives: Strategic imperatives
Chapter 3 Industry Insights
- 3.1 Industry ecosystem analysis
- 3.1.1 Supplier landscape
- 3.1.2 Profit margin
- 3.1.3 Value addition at each stage
- 3.1.4 Factor affecting the value chain
- 3.1.5 Disruptions
- 3.2 Industry impact forces
- 3.2.1 Growth drivers
- 3.2.2 Industry pitfalls and challenges
- 3.2.3 Market opportunities
- 3.3 Growth potential analysis
- 3.4 Regulatory landscape
- 3.4.1 North America
- 3.4.2 Europe
- 3.4.3 Asia Pacific
- 3.4.4 Latin America
- 3.4.5 Middle East & Africa
- 3.5 Porter's analysis
- 3.6 PESTEL analysis
- 3.7 Price trends
- 3.7.1 By region
- 3.7.2 By precious metal type
- 3.8 Future market trends
- 3.9 Technology and Innovation landscape
- 3.9.1 Current technological trends
- 3.9.2 Emerging technologies
- 3.10 Patent Landscape
- 3.11 Trade statistics (HS code)
- 3.11.1 Major importing countries
- 3.11.2 Major exporting countries
- 3.12 Sustainability and environmental aspects
- 3.12.1 Sustainable practices
- 3.12.2 Waste reduction strategies
- 3.12.3 Energy efficiency in production
- 3.12.4 Eco-friendly initiatives
Chapter 4 Competitive Landscape, 2025
- 4.1 Introduction
- 4.2 Company market share analysis
- 4.2.1 By region
- 4.2.1.1 North America
- 4.2.1.2 Europe
- 4.2.1.3 Asia Pacific
- 4.2.1.4 LATAM
- 4.2.1.5 MEA
- 4.2.1 By region
- 4.3 Company matrix analysis
- 4.4 Competitive analysis of major market players
- 4.5 Competitive positioning matrix
- 4.6 Key developments
- 4.6.1 Mergers & acquisitions
- 4.6.2 Partnerships & collaborations
- 4.6.3 New Product Launches
- 4.6.4 Expansion Plans
Chapter 5 Market Estimates and Forecast, By Precious Metal Type, 2022-2035 (USD Billion) (Kilo Tons)
- 5.1 Key trends
- 5.2 Gold
- 5.3 Silver
- 5.4 Platinum
- 5.5 Palladium
- 5.6 Rhodium
- 5.7 Others
Chapter 6 Market Estimates and Forecast, By Source, 2022-2035 (USD Billion) (Kilo Tons)
- 6.1 Key trends
- 6.2 Consumer Electronics
- 6.2.1 Smartphones
- 6.2.2 Laptops & Computers
- 6.2.3 Tablets
- 6.2.4 Televisions
- 6.2.5 Wearable devices
- 6.3 IT & Telecommunication Equipment
- 6.3.1 Servers & data center equipment
- 6.3.2 Networking hardware
- 6.3.3 Communication devices
- 6.4 Industrial Electronics
- 6.4.1 Industrial automation systems
- 6.4.2 Control panels
- 6.4.3 Sensors and instrumentation
- 6.5 Automotive Electronics
- 6.5.1 Electronic control units (ECUs)
- 6.5.2 Sensors and onboard electronics
- 6.5.3 EV battery management electronics
- 6.6 Medical Devices
- 6.6.1 Diagnostic equipment
- 6.6.2 Imaging systems
- 6.6.3 Monitoring devices
- 6.7 Household Appliances
- 6.7.1 Refrigerators
- 6.7.2 Washing machines
- 6.7.3 Microwaves
- 6.8 Others
Chapter 7 Market Estimates and Forecast, By Recovery Process, 2022-2035 (USD Billion) (Kilo Tons)
- 7.1 Key trends
- 7.2 Mechanical Processing
- 7.2.1 Shredding
- 7.2.2 Sorting
- 7.2.3 Magnetic separation
- 7.3 Hydrometallurgical Processes
- 7.3.1 Leaching
- 7.3.2 Solvent extraction
- 7.3.3 Ion exchange
- 7.4 Pyrometallurgical Processes
- 7.4.1 Smelting
- 7.4.2 Thermal treatment
- 7.5 Electrochemical Processes
- 7.5.1 Electrowinning
- 7.5.2 Electrorefining
- 7.6 Biotechnological Processes
- 7.6.1 Bioleaching
- 7.6.2 Microbial recovery
Chapter 8 Market Estimates and Forecast, By End Use, 2022-2035 (USD Billion) (Kilo Tons)
- 8.1 Key trends
- 8.2 Electronics Manufacturing
- 8.3 Automotive Industry
- 8.4 Aerospace & Defense
- 8.5 Healthcare Equipment Manufacturing
- 8.6 Jewelry & Precious Metal Refining
- 8.7 Others
Chapter 9 Market Estimates and Forecast, By Region, 2022-2035 (USD Billion) (Kilo Tons)
- 9.1 Key trends
- 9.2 North America
- 9.2.1 U.S.
- 9.2.2 Canada
- 9.3 Europe
- 9.3.1 Germany
- 9.3.2 UK
- 9.3.3 France
- 9.3.4 Spain
- 9.3.5 Italy
- 9.3.6 Rest of Europe
- 9.4 Asia Pacific
- 9.4.1 China
- 9.4.2 India
- 9.4.3 Japan
- 9.4.4 Australia
- 9.4.5 South Korea
- 9.4.6 Rest of Asia Pacific
- 9.5 Latin America
- 9.5.1 Brazil
- 9.5.2 Mexico
- 9.5.3 Argentina
- 9.5.4 Rest of Latin America
- 9.6 Middle East and Africa
- 9.6.1 Saudi Arabia
- 9.6.2 South Africa
- 9.6.3 UAE
- 9.6.4 Rest of Middle East and Africa
Chapter 10 Company Profiles
- 10.1 Umicore NV
- 10.2 Johnson Matthey Plc
- 10.3 Boliden A
- 10.4 Heraeus Holding GmbH
- 10.5 DOWA Holding Co., Ltd
- 10.6 Tanaka Precious Metals
- 10.7 Sims Limited
- 10.8 Materion Corporation
- 10.9 TES-AMM Pte. Ltd.
- 10.10 EnviroLeach Technologies Inc.
 2026-2030年全球電子廢棄物回收市場
 2026年全球貴金屬電子廢棄物回收市場報告2026年全球電子廢棄物回收再利用服務市場報告
 電子垃圾回收再利用服務市場:依來源地和地區分類
 2026-2034年全球貴金屬電子廢棄物回收市場規模、佔有率、趨勢及成長分析報告
 日本電子廢棄物回收市場:規模、佔有率、趨勢和預測:按材料、來源和地區分類,2026-2034年
 貴金屬回收服務市場(按回收金屬類型、製程、客戶類型、純度等級、技術、產能、最終用途產業、分銷管道和應用分類),全球預測,2026-2032年
 電子廢棄物回收和資源回收市場預測至2032年:按廢棄物類型、材料類型、服務類型、技術、最終用戶和地區分類的全球分析
 電子垃圾回收市場機會、成長促進因素、產業趨勢分析及預測(2025-2034年)電子垃圾回收市場預測至2032年:按服務類型、材質、電子垃圾來源、回收方法、最終用戶和地區分類的全球分析