


 |
市場調查報告書
商品編碼
2083054
2026 年至 2035 年 N 型太陽能電池組件的市場機會、成長要素、產業趨勢和預測。N Type Solar Module Market Opportunity, Growth Drivers, Industry Trend Analysis, and Forecast 2026 - 2035 |
||||||

全球 N 型太陽能電池組件市場預計到 2025 年將達到 580 億美元,年複合成長率為 5.3%,到 2035 年將達到 998 億美元。
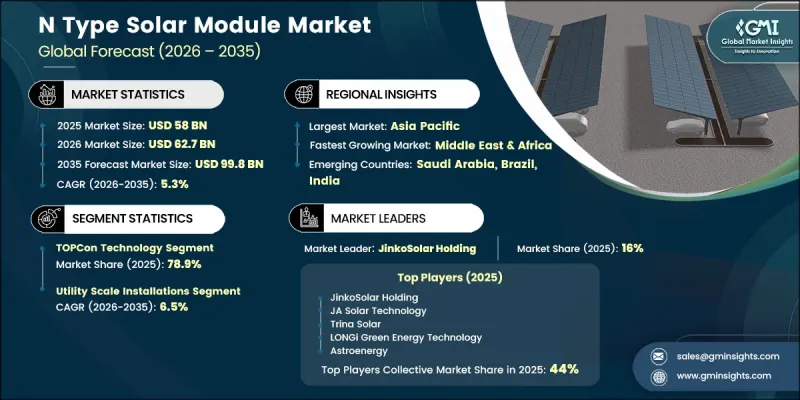
在全球太陽能市場中,可再生能源政策、製造成本下降以及專案經濟效益的提升共同推動了N型太陽能組件市場的成長。先進電池結構的日益普及提高了組件性能,從而提升了長期發電量和運作效率。與傳統光伏技術相比,N型組件具有更低的劣化率、更高的可靠性以及在各種環境條件下更優異的性能,使其成為專案開發商和投資者越來越青睞的選擇。這些優點有助於提高光電裝置整個生命週期的能源輸出,並帶來更佳的發電經濟效益。隨著各國政府、電力公司和私人企業不斷擴大可再生能源發電產能,對高效能光伏技術的需求預計將進一步成長。持續的技術進步、不斷擴大的生產規模以及對長期資產性能日益成長的重視,將在整個預測期內持續支撐市場成長前景。
| 市場範圍 | |
|---|---|
| 開始年份 | 2025 |
| 預測期 | 2026-2035 |
| 初始市場規模 | 580億美元 |
| 預測金額 | 998億美元 |
| 複合年成長率 | 5.3% |
預計到2025年,拓普康(TOPCon)技術將佔據78.9%的市場佔有率。其主導地位得益於卓越的製造擴充性、高轉換效率以及與現有太陽能發電基礎設施的兼容性。該技術已展現出在維持24.5%以上效率的同時實現商業化生產的能力,使其成為尋求最佳化產量和組件性能的製造商的理想選擇。隨著製造商持續投資先進製造能力,拓普康技術憑藉其在成本效益、性能和生產柔軟性的出色平衡,預計將繼續保持其市場領先地位。
預計到2025年,公用事業規模的太陽能裝置將佔據67.9%的市場佔有率,並將以6.5%的複合年成長率持續成長至2035年,成為成長最快的應用領域。在大型太陽能發電工程中,N型組件因其卓越的長期性能、低劣化率和更高的發電容量而日益受到青睞。公用事業開發商持續優先考慮那些能夠支持長期運作可靠性並提升專案經濟效益的技術。專案營運商為提高安裝效率、最佳化土地利用和降低系統總成本而不斷成長的高功率組件需求,也推動了該領域的成長。這些因素進一步鞏固了公用事業規模專案作為全球N型光學模組需求主要驅動力的地位。
預計到2025年,北美N型太陽能模組市佔率將達到17.9%,並在2035年之前以6.6%的複合年成長率成長,成為成長最快的區域市場之一。該地區市場成長得益於有利的可再生能源政策、不斷提高的太陽能部署目標以及旨在加強國內太陽能製造能力的投資。支持性的法律規範和財政獎勵正在促進先進太陽能技術的應用,同時提升本地製造產品的競爭力。此外,對能源安全、永續性措施以及清潔能源發電需求的不斷成長,持續推動北美太陽能基礎設施的投資,為市場的長期擴張創造了有利條件。
目錄
第1章:調查方法和範圍
第2章執行摘要
第3章 行業洞察
- 產業生態系統
- 監理情勢
- 影響產業的因素
- 促進因素
- 產業潛在風險與挑戰
- 成長潛力分析
- 成本結構分析
- 技術與創新展望
- 價格趨勢分析
- 按細分市場分析歷史價格趨勢
- 定價策略:按業務類型分類
- 波特的分析
- PESTLE分析
- 新機會和趨勢
- 數位化和物聯網整合
- 投資分析及未來展望
第4章 競爭情勢
- 介紹
- 企業市佔率分析:按地區分類
- 北美洲
- 歐洲
- 亞太地區
- 中東和非洲
- 拉丁美洲
- 主要市場公司的競爭分析
- 競爭定位矩陣
- 主要進展
- 併購
- 夥伴關係和聯盟
- 新產品發布
- 業務拓展計劃及資金籌措
- 按公司規模進行基準測試
- 排名分類標準與遴選標準
- 按銷售額、地區和創新能力分類的層級定位矩陣。
第5章 市場規模及預測:依細胞技術分類,2022-2035年
- TOPCon
- HJT
- IBC
- 其他
第6章 市場規模及預測:依模組配置分類,2022-2035年
- 單面印刷
- 雙面印刷
第7章 市場規模及預測:依電池規格分類,2022-2035年
- 半切細胞
- 單細胞
- 全細胞
第8章 市場規模及預測:額定功率,2022-2035年
- 小於500瓦
- 500~600 W
- 600~700 W
- 超過700瓦
第9章 市場規模及預測:依應用領域分類,2022-2035年
- 住宅
- 商業和工業用途
- 公用事業
第10章 市場規模及預測:依地區分類,2022-2035年
- 北美洲
- 美國
- 加拿大
- 墨西哥
- 歐洲
- 德國
- 法國
- 荷蘭
- 義大利
- 西班牙
- 亞太地區
- 中國
- 日本
- 韓國
- 印度
- 澳洲
- 中東和非洲
- 沙烏地阿拉伯
- UAE
- 南非
- 拉丁美洲
- 巴西
- 智利
第11章:公司簡介
- AIKO Solar
- Astronergy
- Canadian Solar Inc.
- DMEGC Solar
- First Solar
- Hanwha Q CELLS
- Huasun Energy
- JinkoSolar Holding
- JA Solar Technology
- LONGi Green Energy Technology
- Maxeon Solar Technologies
- REC Group
- Risen Energy
- Seraphim Energy Group
- TCL Solar
- Tongwei Solar
- Trina Solar
- VSUN Solar
- Waaree Energies
- Yingli Solar
The Global N-Type Solar Module Market was valued at USD 58 billion in 2025 and is estimated to grow at a CAGR of 5.3% to reach USD 99.8 billion by 2035.
Growth in the N-Type Solar Module Market is being driven by the combined impact of renewable energy policies, declining manufacturing costs, and improving project economics across global solar markets. The increasing adoption of advanced cell architectures is enhancing module performance, improving long-term energy generation, and supporting greater operational efficiency. Compared with conventional photovoltaic technologies, N-type modules offer lower degradation rates, improved reliability, and stronger performance under varying environmental conditions, making them increasingly attractive to project developers and investors. These advantages contribute to enhanced lifecycle energy output and more favorable electricity generation economics over the lifespan of solar installations. As governments, utilities, and private-sector organizations continue to expand renewable energy capacity, demand for high-efficiency solar technologies is expected to strengthen further. Ongoing technological advancements, manufacturing scale improvements, and growing emphasis on long-term asset performance continue to reinforce the market's growth outlook through the forecast period.
| Market Scope | |
|---|---|
| Start Year | 2025 |
| Forecast Year | 2026-2035 |
| Start Value | $58 Billion |
| Forecast Value | $99.8 Billion |
| CAGR | 5.3% |
TOPCon technology accounted for 78.9% share in 2025. Its leadership position is supported by strong manufacturing scalability, high conversion efficiency, and compatibility with existing solar production infrastructure. The technology has demonstrated its ability to achieve commercial-scale production while maintaining efficiency levels exceeding 24.5%, making it an attractive solution for manufacturers seeking to optimize production output and module performance. As producers continue investing in advanced manufacturing capabilities, TOPCon technology is expected to maintain its strong position within the market due to its balance of cost efficiency, performance, and production flexibility.
Utility-scale installations represented 67.9% share in 2025 and is projected to register a CAGR of 6.5% through 2035, making this the fastest-growing application segment. Large-scale solar projects increasingly favor N-type modules because of their superior long-term performance characteristics, lower degradation profiles, and enhanced energy generation capabilities. Utility developers continue to prioritize technologies that improve project economics while supporting long-term operational reliability. Growing demand for higher-wattage module formats is also contributing to segment growth, as project operators seek to improve installation efficiency, optimize land utilization, and reduce overall system costs. These factors continue to strengthen the role of utility-scale projects as the primary demand driver for N-type solar modules globally.
North America N-Type Solar Module Market accounted for 17.9% share in 2025 and is expected to grow at a CAGR of 6.6% through 2035, representing one of the fastest-growing regional markets. Market growth in the region is being supported by favorable renewable energy policies, increasing solar deployment targets, and investments aimed at strengthening domestic solar manufacturing capabilities. Supportive regulatory frameworks and financial incentives are encouraging broader adoption of advanced solar technologies while improving the competitiveness of locally manufactured products. In addition, growing demand for energy security, sustainability initiatives, and clean energy generation continues to drive investment in solar infrastructure across North America, creating favorable conditions for long-term market expansion.
Major companies operating in the Global N-Type Solar Module Market include Trina Solar, JinkoSolar Holding, Canadian Solar, LONGi Green Energy Technology, JA Solar Technology, Hanwha Q CELLS, First Solar, REC Group, Astroenergy, and Waaree Technologies. Companies operating in the N-Type Solar Module Market are implementing several strategic initiatives to strengthen their market position and expand global market share. Product innovation remains a primary focus, with manufacturers investing heavily in advanced cell technologies, higher conversion efficiencies, and improved module durability. Capacity expansion programs are being pursued to support growing global demand while reducing production costs through economies of scale. Many companies are also enhancing vertical integration across the value chain to improve supply chain control and operational efficiency. Strategic partnerships, long-term supply agreements, and geographic expansion efforts are helping market participants increase customer reach and strengthen distribution networks.
Table of Contents
Chapter 1 Methodology & Scope
- 1.1 Research design
- 1.2 Quality commitment
- 1.2.1 GMI AI policy & data integrity commitment
- 1.2.1.1 Source consistency protocol
- 1.2.1 GMI AI policy & data integrity commitment
- 1.3 Research Trail & Confidence Scoring
- 1.3.1 Research trail components
- 1.3.2 Scoring components
- 1.4 Data Collection
- 1.4.1 Partial list of primary sources
- 1.5 Data mining sources
- 1.5.1 Paid sources
- 1.5.1.1 Sources, by region
- 1.5.1 Paid sources
- 1.6 Base estimates and calculations
- 1.6.1 Base year calculation for any one approach
- 1.7 Forecast model
- 1.8 Research transparency addendum
- 1.8.1 Source attribution framework
- 1.8.2 Quality assurance metrics
- 1.8.3 Our commitment to trust
- 1.9 Market definitions
Chapter 2 Executive Summary
- 2.1 Industry 360° synopsis, 2022 - 2035
- 2.2 Business trends
- 2.3 Cell technology trends
- 2.4 Module configuration trends
- 2.5 Cell format trends
- 2.6 Power rating trends
- 2.7 Application trends
- 2.8 Regional trends
Chapter 3 Industry Insights
- 3.1 Industry ecosystem
- 3.2 Regulatory landscape
- 3.3 Industry impact forces
- 3.3.1 Growth drivers
- 3.3.2 Industry pitfalls & challenges
- 3.4 Growth potential analysis
- 3.5 Cost structure analysis
- 3.6 Technology & Innovation Landscape
- 3.7 Price trend analysis
- 3.7.1 Historic price trend analysis by segment
- 3.7.2 Pricing strategy by player type
- 3.8 Porter's analysis
- 3.8.1 Bargaining power of suppliers
- 3.8.2 Bargaining power of buyers
- 3.8.3 Threat of new entrants
- 3.8.4 Threat of substitutes
- 3.9 PESTEL analysis
- 3.9.1 Political factors
- 3.9.2 Economic factors
- 3.9.3 Social factors
- 3.9.4 Technological factors
- 3.9.5 Legal factors
- 3.9.6 Environmental factors
- 3.10 Emerging opportunities & trends
- 3.11 Digitalization & IoT integration
- 3.12 Investment analysis and future outlook
Chapter 4 Competitive landscape, 2026
- 4.1 Introduction
- 4.2 Company market share analysis, by region, 2025
- 4.2.1 North America
- 4.2.2 Europe
- 4.2.3 Asia Pacific
- 4.2.4 Middle East & Africa
- 4.2.5 Latin America
- 4.3 Competitive analysis of major market players
- 4.4 Competitive positioning matrix
- 4.5 Key developments
- 4.5.1 Mergers & acquisitions
- 4.5.2 Partnerships & collaborations
- 4.5.3 New product launches
- 4.5.4 Expansion plans & funding
- 4.6 Company tier benchmarking
- 4.6.1 Tier classification criteria & qualifying thresholds
- 4.6.2 Tier positioning matrix by revenue, geography & innovation
Chapter 5 Market Size and Forecast, By Cell Technology, 2022 - 2035 (USD Million & MW)
- 5.1 Key trends
- 5.2 TOPCon
- 5.3 HJT
- 5.4 IBC
- 5.5 Others
Chapter 6 Market Size and Forecast, By Module Configuration, 2022 - 2035 (USD Million & MW)
- 6.1 Key trends
- 6.2 Monofacial
- 6.3 Bifacial
Chapter 7 Market Size and Forecast, By Cell Format, 2022 - 2035 (USD Million & MW)
- 7.1 Key trends
- 7.2 Half cut cell
- 7.3 Shingled cell
- 7.4 Full cell
Chapter 8 Market Size and Forecast, By Power Rating, 2022 - 2035 (USD Million & MW)
- 8.1 Key trends
- 8.2 <500 W
- 8.3 500-600 W
- 8.4 600-700 W
- 8.5 >700 W
Chapter 9 Market Size and Forecast, By Application, 2022 - 2035 (USD Million & MW)
- 9.1 Key trends
- 9.2 Residential
- 9.3 Commercial & Industrial
- 9.4 Utility
Chapter 10 Market Size and Forecast, By Region, 2022 - 2035 (USD Million & MW)
- 10.1 Key trends
- 10.2 North America
- 10.2.1 U.S.
- 10.2.2 Canada
- 10.2.3 Mexico
- 10.3 Europe
- 10.3.1 Germany
- 10.3.2 France
- 10.3.3 Netherlands
- 10.3.4 Italy
- 10.3.5 Spain
- 10.4 Asia Pacific
- 10.4.1 China
- 10.4.2 Japan
- 10.4.3 South Korea
- 10.4.4 India
- 10.4.5 Australia
- 10.5 Middle East & Africa
- 10.5.1 Saudi Arabia
- 10.5.2 UAE
- 10.5.3 South Africa
- 10.6 Latin America
- 10.6.1 Brazil
- 10.6.2 Chile
Chapter 11 Company Profiles
- 11.1 AIKO Solar
- 11.2 Astronergy
- 11.3 Canadian Solar Inc.
- 11.4 DMEGC Solar
- 11.5 First Solar
- 11.6 Hanwha Q CELLS
- 11.7 Huasun Energy
- 11.8 JinkoSolar Holding
- 11.9 JA Solar Technology
- 11.10 LONGi Green Energy Technology
- 11.11 Maxeon Solar Technologies
- 11.12 REC Group
- 11.13 Risen Energy
- 11.14 Seraphim Energy Group
- 11.15 TCL Solar
- 11.16 Tongwei Solar
- 11.17 Trina Solar
- 11.18 VSUN Solar
- 11.19 Waaree Energies
- 11.20 Yingli Solar

 拓普康太陽能電池全球市場規模、佔有率、趨勢和成長分析報告(2026-2034)
 有機太陽能電池:市場佔有率分析、產業趨勢與統計及成長預測(2026-2031)軟性太陽能電池:市場佔有率分析、產業趨勢與統計及成長預測(2026-2031)
 串聯太陽能電池市場預測至2034年—按電池結構、效率範圍、技術、應用、最終用戶和地區分類的全球分析有機太陽能電池(OPV)市場預測—全球材料、裝置結構、應用、終端用戶和地區分析—2034年太陽能電池:市場佔有率分析、行業趨勢和統計數據、成長預測(2026-2031)
 有機太陽能電池市場規模、佔有率和趨勢分析報告:按類型、應用、最終用戶、材料、地區和細分市場分類(2026-2033 年)串聯太陽能電池市場規模、佔有率、成長、全球產業分析、區域趨勢及2026-2034年預測。第三代能源市場規模、佔有率、成長、全球產業分析、區域趨勢及2026-2034年預測。
 下一代太陽能電池市場規模、佔有率和成長分析:按技術、材料、應用、安裝類型、最終用戶、組件和地區分類-2026-2033年產業預測